

 PDF
PDF ePub
ePub Citation
 Print
Print


INTRODUCTION
Maxillary molar distalization is a frequently preferred nonextraction treatment option for patients with Class II malocclusion. In recent years, several intraoral appliances have been designed, which are expected to be more patient-friendly and maximize patient cooperation.123
The application site based on the design of the appliance is a major determinant of the final post-treatment position of the maxillary molars. Intraoral maxillary molar distalizers can be buccally acting, palatally acting, or both. Kinzinger et al.4 pointed out that tooth movement induced during molar distalization requires evaluation in relation to spatial planes, and sagittal and vertical tooth movements during molar distalization using different types of appliances are well documented.56789
Several authors have emphasized the importance of molar rotation for the correction of Class II malocclusion1011 accordingly, selection of the appliance design on the basis of the rotational need is becoming popular. However, transverse discrepancies may exist in conjunction with rotational discrepancies, and few studies have evaluated the nature and extent of transverse changes during molar distalization.121314
The net effects of the palatally acting pendulum appliance and its modifications include expansion and distalization accompanied by distopalatal rotation.41516 Meanwhile, the distal jet appliance applies palatal force that results in both expansion and distobuccal rotation of the first molars.17 Erverdi et al.18 identified significant distopalatal rotation caused by the application of magnetic force using nickel titanium (NiTi) open coil springs from the buccal side, while Bondemark and Kurol19 reported distobuccal rotation. Papadopoulos et al.20 reported that the lack of molar rotation can be attributed to the double-track system of first class appliances. However, Acar et al.21 observed distopalatal rotation of the maxillary first molars when a combination of the pendulum appliance and K-loop was used.
To the best of our knowledge, no study has compared the transverse dental changes induced by buccally and palatally acting molar distalization appliances. Therefore, we conducted this study to evaluate and compare the transverse dental changes induced by the palatally applied Frog appliance (Forestadent, Pfarzheim, Germany) and buccally applied Karad's integrated distalizing system (KIDS)22 for maxillary molar distalization using orthodontic study models. The tested hypothesis was that both appliances will have different effects on rotation of the first molar and expansion in the same region.
MATERIALS AND METHODS
Power analysis revealed that 19 patients per group would achieve a statistical power of approximately 80% at a significance level of 0.05.
We retrospectively analyzed pre- and postdistalization orthodontic study models of 39 patients, including 19 (Frog group; 13 girls, six boys; mean age, 14.8 ± 1.40 years) treated using the palatally applied Frog appliance and 20 (KIDS group; nine girls, 11 boys; mean age, 14.4 ± 1.42 years) treated using the buccally positioned KIDS.
The inclusion criteria were as follows: permanent dentition with all second molars in occlusion, Angle Class II division 1 malocclusion with a bilateral complete Class II molar relationship and an ANB angle of 0°-5°, an optimal vertical growth pattern (SN/GoGn, 32° ± 6°), moderate crowding in the maxillary arch (approximately 6 mm), no or minimum crowding in the mandibular arch (0-2 mm), and the availability of good-quality dental casts. Patients with congenitally missing teeth, congenital syndromes such as a cleft lip/palate, and/or Angle Class II subdivision malocclusion were excluded.
Patients with third molars were evaluated before treatment initiation, and all third molars with crowns below the level of the second molar trifurcation were extracted.
Ethical approvals were previously obtained for use of the appliances from the Ethical Committee of the University (2008/18, 2010/087).
Appliances
Palatally acting Frog appliance
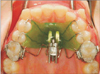
The Frog appliance comprises a screw, a preformed spring, and a screwdriver. Molar bands with palatal sheaths were placed on the maxillary first molars, and a maxillary impression was recorded. Both premolars were attached to the Nance appliance using a 0.8-mm stainless steel wire. The occlusal rests lied in the embrasures mesial to the anchor teeth. The Frog screw was placed on the model approximately 10-12 mm from the occlusal surface. The preformed 0.032-inch stainless steel spring was adjusted to the palatal sheaths of the molar bands and the Frog screw (Figure 1). The patients or their parents were instructed to activate the Frog screw by two turns in a clockwise direction every week. One complete rotation around the axis of the activation screw opened the appliance by 0.4 mm.
Buccally acting KIDS
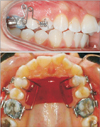
A triple helical spring made from a 0.017 × 0.025-inch titanium-molybdenum alloy wire was placed between the first molar tubes and the first premolar brackets. The springs were initially activated by 2 mm and reactivated bimonthly. The maxillary first premolars were attached to the Nance appliance using a 0.9-mm stainless steel wire. These occlusal rests lied in the embrasures mesial and distal to the anchor teeth. To guide the first molars during distalization, 1.62-mm stainless steel crimpable tubes were placed on the lateral curvatures of the palate, parallel to the occlusal plane (Figure 2).
Measurements on photocopies of the study models
Transverse dental changes were determined using study models prepared before and after molar distalization. The median palatal suture and cusp tips of the maxillary premolars and molars were marked on the study models using a 0.5-mm pencil and photocopies of the models were obtained as described by Champagne.23
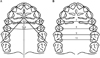
The median palatal suture was used as the midline reference plane (ML). The line passing through the buccal and palatal cusp tips of the premolars formed the premolar axis, and premolar rotation was determined from the angles between the right (R4 and R5 angles) and left premolar (L4 and L5 angles) axes and ML. Rotation of the maxillary first molars was assessed by measuring the angles between the line passing through the distobuccal and mesiopalatal cusp tips of the molars and ML (R6 and L6 angles; Figure 3A).
Transverse movements of the maxillary premolars (U4 and U5 distances) were determined by measuring the distance between the buccal cusp tips of the right and left premolars. The distances between the mesiobuccal (U6M) and distobuccal cusp tips (U6D) of the right and left first molars were also measured (Figure 3B).
The amount of first molar distalization and anchorage loss (mesial movement of the first premolars) were directly measured on millimeter paper with reference to ML (median palatal suture) when the model copies were superimposed on the incisive papilla, median palatal suture, and palatal raphe. The amount of rotation per millimeter of distalization/mesialization (R4ang/R4mes, L4ang/L4mes, R6ang/R6dis, L6ang/L6dis) was derived from measurements made directly on the model casts.
Fifteen randomly selected models were marked, photocopies were obtained, and measurements were recorded by the same orthodontist after a period of 2 weeks. The method error and intraobserver reliability were determined using Dahlberg's24 formula and paired t-tests.
Statistical analysis
All statistical analyses were performed using SPSS ver. 16.0 (SPSS Inc., Chicago, IL, USA). To check for data normality, the Shapiro-Wilk test was applied. Because the data were not normally distributed, the Wilcoxon signed-rank test was used to evaluate the mean changes during distalization in each group. Differences between the two groups were determined using the Mann-Whitney U test.
RESULTS
The method error did not exceed 0.4 mm and 0.6° for any of the variables investigated, while the duplicated measurements were not significantly different (p > 0.05).
There were no significant differences in the pretreatment variables between groups (Table 1). Post-treatment changes in each variable in the two groups and intraand intergroup comparisons of transverse dental changes are shown in Table 2.
In Frog group, significant distopalatal rotation was observed for the bilateral maxillary premolars (R4 and L4 angles and R5 and L5 angles; p < 0.05 and p < 0.01, respectively). Furthermore, the interpremolar distance for the first and second premolars (U4 and U5 distances) increased significantly (p < 0.01), while the maxillary first molar angles (R6 and L6 angles), which indicated distobuccal rotation, decreased significantly (p < 0.05).
In KIDS group, the distance between the cusp tips of the maxillary right and left second premolars (U5 distance) showed a significant increase (p < 0.001). In addition, there were significant increases in the maxillary right and left first molar angles (R6 and L6 angles), which indicated distopalatal rotation (p < 0.01), and the distances between the mesiobuccal (U6M distance) and distobuccal (U6D distance) cusp tips of the maxillary right and left first molars (p < 0.001).
The increase in the maxillary second premolar angles (R5 and L5 angles) was significantly greater in Frog group than in KIDS group (p < 0.05). On the other hand, the increase in the distance between the second premolar cusp tips (U5 distance) was significantly greater in KIDS group than in Frog group.
The decrease in the maxillary first molar angles (R6 and L6 angles) induced by palatal forces was significantly lesser than the increase induced by buccal forces (p < 0.001). Furthermore, the increase in the distances between the mesiobuccal (U6M distance) and distobuccal (U6D distance) cusp tips of the maxillary first molars was significantly greater in KIDS group than in Frog group (p < 0.001).
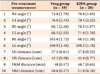
There was no significant difference in the amount of rotation per millimeter of anchorage loss in the first premolars (L4ang/L4mes, R4ang/R4mes). However, the amount of rotation per millimeter of first molar distalization (L6ang/L6dis, R6ang/R6dis) was significantly greater in KIDS group than in Frog group (p < 0.001; Table 3).
DISCUSSION
The effects of intraoral molar distalizer appliances on sagittal and vertical movements of the maxillary first molars and anchorage teeth are well documented.151617181920212526 However, very few studies1213 have evaluated the transverse dental changes induced by these appliances, and no study has compared the effects of appliances with different sites of force application on rotation of the maxillary first molar and expansion in the same region. Therefore, the present study focused on transverse dental changes induced by the palatally acting Frog appliance and buccally acting KIDS and found differences in the type and amount of maxillary first molar rotation between the two. The Frog appliance induced a significant mean distobuccal rotation of 5.9° on the right and 4.4° on the left. In contrast, KIDS induced a significant mean distopalatal rotation of 6.3° on the right and 5.5° on the left. In Frog group, the direction of the applied force was palatal from the center of resistance. Our findings were consistent with those of Kinzinger et al.,17 who used the palatally acting distal jet appliance and observed a distobuccal rotation of 8.35° for the right first molar and 7.88° for the left one. However, other studies reported distopalatal rotation of the maxillary first molars with the use of the palatally acting pendulum appliance.1527 Kinzinger et al.4 explained that toe-in bending produces a mesiobuccal torque that opposes the distobuccal torque resulting from the force of the pendulum spring. The authors4 also mentioned that the magnitude of the distobuccal torque was extremely small, and that the resultant torque induced mesiobuccal rotations of 5.2° and 4.2° in the right and left first molars, respectively. These differences among studies on palatally acting appliances may be attributed to the design of the appliances. With palatally acting appliances, additional toe-in bending may be useful to prevent undesirable rotation. On the other hand, Kinzinger et al.17 mentioned that toe-in bends should not be used in distal jet appliances because they could result in friction in the guide tubes. If required, the U-bends of the Frog appliance can be used to neutralize its rotational effects. It should be noted that toe-in bending was not employed in the present study.
In several studies, distopalatal rotation was reported as a beneficial factor for the correction of Class II malocclusion.112728 In the present study, the desired distopalatal rotation was achieved in KIDS group, and this observation was supported by Erverdi et al.,18 who reported significant distopalatal rotation with buccally acting appliances such as magnets (9.9°) and NiTi coils (8.6°).
The amount of maxillary first premolar rotation was not significantly different between the two groups in the present study, probably because the first premolars were used as anchorage units in both groups. On the other hand, the maxillary second premolars were used as anchorage units only in Frog group, and they exhibited significant distopalatal rotation during distalization. In KIDS group, the second premolars were free to drift distally and showed no significant rotation. Thus, the direction and magnitude of transverse changes in the premolars appeared to depend on the anchorage unit design, not the type of intraoral molar distalization appliance. Acar et al.21 also reported that the amount of maxillary left first premolar rotation with the pendulum appliance supported buccally by the K-loop was significantly different from that with a cervical headgear.
Previous studies have reported a slight, insignificant amount of expansion induced between the buccal cusp tips of premolars by the distal jet and pendulum appliances.2930 In the present study, the second premolars were not included in the anchorage unit in KIDS group and their freedom to drift distally was one of the reasons for greater expansion in this region compared with that in Frog group.
Kinzinger et al.4 reported that the increased transverse arch width between the mesiobuccal cusp tips, central fossa, and distobuccal cusp tips of the maxillary first molar was evidence of expansion in this region during treatment with the K-pendulum. Significant increases in intermolar distances were also emphasized in other studies on the pendulum and distal jet appliances.161730 Acar et al.21 found a significant increase between the mesial cusp tips of the maxillary first molars after treatment with the pendulum appliance–K loop combination. However, they reported that the increase in the distance between the distopalatal cusp tips was not statistically significant. Bolla et al.30 suggested that distalization results in divergence of the right and left molars along the natural shape of the arch form. The rotation of the maxillary molars or arch form may be primary factors affecting the increase in the intermolar distance. In the present study, the increase in the intermolar distance was insignificant in Frog group and significant and greater in KIDS group. This was probably caused by the greater amount of rotation per millimeter of first molar distalization in KIDS group. Clinically, the addition of U-bends or screws in the design of palatally acting appliances will help in increasing the intermolar distance.
This study was limited by the lack of cephalometric measurements for the amount of molar distalization, tipping, and anchorage loss. Further studies are needed to overcome this limitation and clarify our findings.
CONCLUSION
In summary, expansion and the amount of rotation per millimeter of first molar distalization was greater with KIDS than with the Frog appliance. While the Frog appliance resulted in distobuccal rotation of the first molar, KIDS resulted in distopalatal rotation. Finally, the amount of expansion in the second premolar region was greater with KIDS than with the Frog appliance. These results confirmed the hypothesis that buccally and palatally acting intraoral molar distalizers result in different transverse changes in the dentition. Distalization of maxillary molars can be achieved with several appliance designs. Our findings suggest that the type and amount of first molar rotation and expansion vary with the design of the distalization appliance used. Therefore, awareness of not only sagittal and vertical movements but also the type and amount of transverse changes induced in the molars and anchorage units can aid in the selection of an appropriate distalization appliance.


 XML Download