

 PDF
PDF ePub
ePub Citation
 Print
Print


INTRODUCTION
Orthodontic mini-implants (OMIs) have been widely used with a high rate of success as a form of skeletal anchorage in orthodontic treatment. However, various cases of failure have also been reported.1 Causes of failure include early loosening, fracture of the OMI, root damage, and inflammation. Of these, early loosening is considered to be clinically important in the early stages of treatment.23 In order to avoid early loosening, clinicians must select an area of good bone quality and avoid approaching vulnerable anatomical structures, such as the proximal root, during surgical procedures.456 However, it is often difficult to secure a good placement site that is free from such anatomical structures. Accordingly, different modifications to OMI design were attempted in order to enhance their stability. A conical shape was applied to reduce the space between the bone and implant.789 In addition, the difference between the core diameter and thread diameter of implants was increased to widen the bone contact area. Nevertheless, the high risk of fracture due to a decreased core diameter has discouraged these efforts.10 In an attempt to improve stability while maintaining a low risk of fracture, surface treatments of self-tapping type OMIs have been suggested to induce osseointegration.1112
The available surface treatments for dental implants include titanium plasma spraying, grit blasting, acid etching, anodization, and calcium phosphate coating, which are known to show better osseointegration compared to non-surface-treated machined surfaces.13 Of those, the grit blasting which includes sandblasted large grit and acid etched (SLA) surface treatment, and resorbable blasting media (RBM) surface treatment are typical ones for the dental implants.13
Regarding the suitability of SLA surface treatments for self-tapping and self-drilling OMIs, pre-drilling is recommended in self-tapping OMIs, which have no cutting edge.1112 However, the pre-drilling procedure is performed at a comparatively high revolution per minute (RPM) and generates high amounts of heat, which can cause bone necrosis and destruction of the alveolar bone. In addition, proximal root damage may occur if the location or angulation of the drill is inappropriate.9 Moreover, the possibility of the presence of a space between the implant and bone may adversely affect the initial stability of implants.14 Therefore, surface treatments are more suitable for self-drilling OMIs, which do not require pre-drilling, instead of self-tapping OMIs.
However, self-drilling OMIs, especially those of a small diameter, carry a higher risk of fracture during the placement procedure.1516 To mitigate this, commercially pure titanium (CP Ti) is often replaced by high-strength Ti alloys in OMIs1718 as well as other dental implants.19 Non-surface-treated Ti-alloy dental implants have been well studied, but there has been little investigation regarding the osseointegrative properties of surface-treated Ti-alloy OMIs.2021
Furthermore, the surface treatment can influence the insertion pattern of Ti-alloy self-drilling OMIs22 by changing the bone cutting capacity, which needs to be evaluated to determine the clinical significance.
The purpose of this study was to compare the effects of osseointegration and bone cutting capacity of a variety of surface treatment methods in Ti-alloy self-drilling OMIs, in order to find out which method produces the most clinically efficient and stable implants.
MATERIALS AND METHODS
Materials
Orthodontic mini-implant
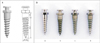
Conical shape OMIs (orthodontic screw, OSSH1606; Osstem Implant, Seoul, Korea) with a 1.6-mm diameter and 6-mm thread length were used for the study. The OMIs were made of a Ti6Al4V alloy. Their shape and size are illustrated in Figure 1.
The experimental group was defined according to a previous study22 performed in our department, as follows: the etched group was composed of OMIs etched with hydrochloric acid and nitric acid. The RBM group was composed of OMIs, which were blast treated with 75-µm diameter calcium phosphate and then rinsed with acid. The hybrid group was composed of OMIs blast treated with calcium phosphate, except for the lower 1/3 of the cutting edge, and then rinsed with acid. The control group was composed of non-surface treated (machined) OMIs (Figure 1).
Artificial bone block
Artificial bone blocks were prepared from polyurethane foam (solid rigid polyurethane foam; Sawbones, Vashon Island, WA, USA), and attached with cyanoacrylate adhesives, in substitute for the cortical bone and cancellous bone. The thickness was 1.5 mm for the cortical bone, and 30 mm for the cancellous bone. The mechanical properties and specifications were in conformance with the American Society for Testing and Materials standard specification F-1839.
Experimental animals
Twenty-five New Zealand white male rabbits with a mean weight of 3.2 kg were used for the experiments. An adaptation period of one week and a standardized diet were given. The animal experiments and breeding were conducted at the College of Veterinary Medicine,Jeju National University in compliance with the Management Policy of animal laboratories, and with the approval of the Animal Ethics Committee of the Jeju National University (approval number 2010-0047).
Methods
Comparison of bone cutting capacity
Using a cutting capacity test machine (Osstem Implant), 10 OMIs of each experimental group were inserted into the artificial bone at a vertical load of 9 N, and at a rotational velocity of 12 rpm, which are the maximum levels of the machine. The insertion depths were recorded at intervals of 10 milliseconds, and the insertion depth at 30 seconds was measured and compared.
Comparison of osseointegration
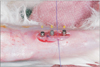
a. Measurement of removal torque of OMIs placed in tibia of rabbits: General anesthesia was induced in the 25 New Zealand white male rabbits through intramuscular injection of 0.2 mL/kg of tiletamine zolazepam (Zoletil 50; Virbac, Carros, France) and the fur on both tibias was shaved. In order to prevent reflex movement caused by pain, and to control bleeding, local anesthesia was also administered to the tibia area using a mixture of articaine hydrochloride and epinephrine (Septanest; Septodont, Saint-Maur-des-Fossés, France) in the ratio of 1:100,000. A 3–4 cm long incision was initiated 10 mm from the femoral articular surface of the internal surface of the tibia, and the OMIs were inserted at intervals of 5–6 mm using a hand driver. Fractures occurred frequently during the procedure, likely because the rabbit tibia has a low percentage of cancellous bone. As a result, the OMIs of the RBM group were excluded from the animal experiments. Three OMIs from the control and experimental groups were inserted into each tibia (Figure 2). The implants were inserted, alternatingly, in a randomized sequence or matching sequence between each tibia, depending on the bone quality and thickness of the different areas (not shown).
For postoperative infection control, penicillin G procaine (Penicillin INJ.; Green Cross Veterinary Products Co., Ltd., Seoul, Korea) was administered at a dose of 30,000 IU/kg once a day via subcutaneous injections in addition to dressing on the surgical area using a chlorhexidine solution. In order to avoid the risk of septicemia as a secondary infection caused by contamination, implant head was not exposed throughout the whole experimental period.
At 1, 2, 4, and 8 weeks after placement, potassium chloride was administered for euthanasia. The removal torque was measured while the OMIs were removed through counterclockwise rotation using a digital torque gauge (MGT12; Mark-10, Copiague, NY, USA).
b. Histomorphometric analysis: The tissue specimens were fixed for histomorphologic observation using a 10% phosphate buffered formalin solution. After phasing dehydration using alcohol, embedding was performed using resin (Technovit 7210 VLC; Heraeus Kulzer GmbH, Wehrheim, Germany). The embedded block was cut using a diamond band cutting system (Exakt CP; Exakt Apparatebau, Norderstedt, Germany), ground to a 30–40 µm thickness using a micro grinding system (Exakt 400CS; Exakt Apparatebau) and stained with hematoxylin and eosin.
Images of the specimens were obtained at ×100 magnification with a digital camera (DP71; Olympus Co., Tokyo, Japan) mounted on an optical microscope (BX51; Olympus Co). The percentage of bone to implant contact (BIC) and percentage of bone area inside the thread (BA) were measured using an image analysis program (Image-Pro Plus; Media Cybernetics Inc., Rockville, MD, USA).
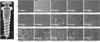
c. Surface observation using a scanning electron microscope (SEM), and energy dispersive X-ray spectroscopy (EDS) analysis: Sixty removed specimens of the OMIs and tissue were dehydrated and dried using 50%, 70%, 90%, and 100% alcohol, and were gold-coated for 120 seconds for observation.
The images (×1,000 in magnification) obtained from SEM (JSM-6480LV; JEOL, Tokyo, Japan) were examined to evaluate the surface changes in the OMIs. Since cancellous bone is hardly found in the tibia of rabbit, our observations were mostly regarding the cortical bone contact area.
A quantitative surface content analysis was conducted to measure the content of carbon, oxygen, calcium, and phosphorous using an EDS (INCA; Oxford Instruments, Oxfordshire, UK) under 15 kV of accelerating voltage and ×1,000 magnification.
Statistics
A one-way analysis of variance was conducted to determine the difference between groups, and between experiment weeks, after randomness and normality were confirmed, using the SPSS software (version 12.0; SPSS Inc., Chicago, IL, USA). In addition, we used the Duncan and Tukey tests as post hoc tests. A value of p < 0.05 was considered statistically significant.
RESULTS
Comparison of bone cutting capacity
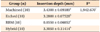
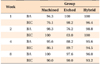
The RBM group showed a significantly shallower insertion depth compared with other groups. The machined group showed the deepest depth (p < 0.05) among the groups, and the hybrid group and etched group did not show a significant difference from each other (p > 0.05, Table 1).
Comparison of osseointegration
Comparison of removal torque in experimental groups
Eight specimens were obtained for statistics from each group and each measured week.
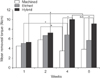
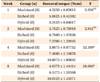
At 1 and 2 weeks after placement, no significant difference was found among the experimental groups (p > 0.05). At 4 and 8 weeks after placement, all the experimental groups showed significant differences, with the hybrid group showing the highest removal torque level, followed by the etched group, and the machined group (p < 0.05) (Figure 3, Table 2).
Change of removal torque with time
The removal torque of the machined group was significantly decreased at 4 weeks, compared to the previous measurement (p < 0.05). In the etched group, it was significantly increased at 4 weeks (p < 0.05). Meanwhile, in the hybrid group, the removal torque began to be significantly increased at 2 weeks, and this trend persisted to 8 weeks (p < 0.05) (Figure 3, Table 2).
Histomorphometric analysis
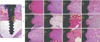
We obtained two specimens at most for histomorphometric analysis for each group and each experiment week, due to the losses during the observation period and specimen cutting. We measured the contact area between the cortical bone and threads using an optical microscope under ×100 magnification to calculate BIC and BA (Figure 4). Differences between the morphological characteristics, and BIC and BA values were not found between the specimen from each group and each experiment week (Figure 4, Table 3), even though those could not be analyzed statistically due to a limited number of the specimen.
SEM observation and EDS surface analysis
Microscopic remnant tissues were found on the surface under SEM observation. The machined and etched groups had less remnant tissues than the hybrid group, which showed high amounts of microscopic remnant tissues between the surface-treated rough surfaces (Figure 5).
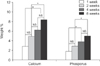
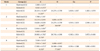
Regardless of the time of sacrifice, carbon was detected in all experimental groups while calcium and phosphorus were detected in the hybrid group only, based on the EDS surface analysis. At 1 week, more carbon was detected in the hybrid group than in the other groups (p < 0.05). At 2 weeks, no significant differences were found in carbon content, but more oxygen was detected in the hybrid group than in the etched group while no oxygen was detected in the machined group. At 4 weeks, more carbon content was detected in the hybrid group than in the etched group while oxygen was detected only in the hybrid group (p < 0.05) (Figure 6, Table 4).
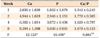
Since calcium and phosphorus were detected only in the hybrid group, calcium, phosphorus, and calcium/phosphorus (Ca/P) ratio in hybrid group were compared according to the time of sacrifice. Both calcium and phosphorous content significantly increased with time (p < 0.05). No significant difference in the Ca/P ratio was observed over time (p > 0.05) (Figure 6, Table 5).
DISCUSSION
Comparison of bone cutting capacity
Unlike the self-tapping OMI, the self-drilling OMI has cutting edges, with which bone can be cut during the insertion procedure. The cutting capacity test machine is designed to measure the cutting capacity of dental implant drills, and can measure the changes in depth with respect to time.
The RBM group showed a very low cutting speed compared to the other groups and failed to penetrate the 1.5-mm thick cortical bone of the artificial bone in 30 seconds. The blunter cutting edge caused by the surface treatment was thought to be the reason of the very low cutting speed in the RBM group.
Although the cutting speed in the etched group was lower than in the machined group, it was similar to that in the hybrid group. This implies that acid etching surface treatment can affect the bone cutting capacity. In addition, the hybrid group, which has both the sharp cutting edges of the machined surface in the lower part, and an RBM surface in the upper part, has a bone cutting capacity similar to the etched group, and more than that of the RBM group.
Comparison of osseointegration
Comparison of removal torque in experimental animals
The method of measuring removal torque introduced by Carlsson et al.23 was applied to evaluate the levels of osseointegration of OMIs in this study.912
A high removal torque implies good osseointegration. In this study, the removal torque of the machined group was decreased at 4 weeks, was increased at 4 weeks in the etched group, and in the hybrid group, began to be increased at 2 weeks and by 8 weeks was the highest among all the groups.
No significant difference was found between the 4 and 8 weeks in the hybrid group, presumably because the cycle of bone mineral metabolism in rabbits is six weeks.24
Histomorphometric analysis
There are two histomorphometric measurements used to evaluate the osseointegration level of dental implants: percentage of BIC, and percentage of BA.25 In this study, BIC and BA were measured but no difference was observed in these measurements among the groups. The major reason for the similarity could be that the self-drilling OMIs used in this study needed no predrilling,26 and the amount of original bone among the threads becomes large as the OMI is placed.
Even though the implants appear to contact with bone under histomorphometric observation, a barren layer is known to be found between bone and implant when observing the hyperfine structures.27 In this study, the difference in removal torque could not be explained by differences in BIC or BA. We thus assumed that the machined group and etched group had more barren layers between the bone and implant at the level of hyperfine structures, which exceeds the resolution of optical microscopes, compared with the hybrid group.
SEM observation and EDS surface analysis
According to the SEM observations, there were no significant tissue remnants in the machined group and etched group. In contrast, the hybrid group was covered with thick remnant tissues.
In order to investigate the osseointegration levels using content analysis on the remnant tissues on the surface of OMIs, quantitative analysis of carbon, oxygen, calcium, and phosphorous was conducted by EDS. Calcium and phosphorus were detected only in the hybrid group, from 1 week after placement, and the amounts increased with time. This could be related to the highest removal torque value observed in the hybrid group.
The calcium and phosphorus at 1 week in hybrid group could be related to the presence of the original woven bone attached to the surface of the OMI, and the increase in calcium and phosphorus with time could be due to the matured woven bone being firmly attached on the original bone.28
While the etched group, in which calcium and phosphorus were not detected, showed an increased removal torque at 4 weeks, the value was lower than in the hybrid group, in which calcium and phosphorus were detected. This might be due to the difference in surface roughness; the ideal value for osseointegration has been suggested to be between 1.0–1.5 µm.222930 The surface roughness31 of the hybrid group was assumed to produce a higher osseointegration32 capacity than that of the etched group.
The Ca/P ratio in the hybrid group did not significantly change from its original value of 1.5 ± 0.2 throughout the period of study. This is presumably because most of the detected calcium and phosphorus were derived from the original bone, not from newly formed bone. Kim et al.29 reported that the Ca/P ratio was above 1.5 in the early stage of placement of implant, because of the presence of newly formed bone. The difference probably arises from the fact that transmission electron microscopy was used, which is able to detect newly formed bone, unlike the SEM33 that we used in this study. This could be considered a limitation of our study.
CONCLUSION
The capacity of bone cutting and osseointegration were compared in the surface-treated self-drilling OMIs of an acid-etched group (Etched group), RBM surface-treated group (RBM group) and partial RBM surface-treated group (Hybrid group). Among the experimental groups, the hybrid group had the highest stability of self-drilling OMIs, without a corresponding reduction in bone cutting capacity.
 XML Download