

 PDF
PDF ePub
ePub Citation
 Print
Print


INTRODUCTION
The curve of Spee (COS) is an important characteristic of the mandibular arch.1 Most dentists believe that the COS comprises the occlusal surfaces of the molars and incisal edges.2 The COS is flatter in the primary dentition than in the permanent dentition, and develops with the eruption of the mandibular permanent first molars and permanent incisors.3 Once established, the COS remains relatively stable.45 The rationale behind the traditional concept of leveling the COS is somewhat obscure.6 Andrews7 suggested that the COS should be leveled to a flat plane to facilitate the construction of optimal occlusion. He also suggested that a flat plane should be the treatment goal as a form of overtreatment.7 Correction of a deep overbite often involves leveling of the COS,8 and this leveling is an everyday practice in orthodontic clinics.9 Leveling of the COS is associated with an increase in the arch length.891011121314 As the COS deepens, the amount of additional arch length required for leveling the COS (AALL) increases. Since leveling of the COS requires additional arch length, the COS can be viewed as crowding or as an arch length discrepancy that is expressed in the vertical aspect. Therefore, evaluating the AALL is as important as evaluating arch length discrepancy when there is a deep COS.9 However, the amount of AALL is not easily predicted. A popular rule of thumb for estimating the AALL is that 1 mm of arch length is needed to level each millimeter of COS depth, where the COS depth is the average of the depths on the right and left sides.1011 This popular theory is thought to be based on a study by Baldridge,12 who used setups of patient malocclusion models with varying COS depths to develop an equation for estimating the AALL. Germane et al.9 also reported an equation for estimating the AALL from a mathematical model.
Most recently, Braun et al.13 used a coordinate measuring machine to record the three-dimensional (3D) coordinates of the cusp tips and incisal edges of malocclusion models, and then calculated the AALL by subtracting the planar projection of the total arch circumference from the total arch circumference (Table 1). The total arch circumference is measured by summing the distances between the cusp tips,13 and can be described as the 3D arch circumference. The planar projection of the total arch circumference can be thought of as the planar projection of the 3D arch circumference onto the occlusal plane, and can be described as the two-dimensional (2D) arch circumference. Therefore, the AALL can be measured by subtracting the 2D arch circumference from the 3D arch circumference.
In addition, the AALL can be measured for an individual tooth by subtracting the 2D tooth width from the 3D tooth width. The 3D tooth width is the conventional tooth width measured between the mesial and distal maximum convexities, and the 2D tooth width is the projection of the 3D tooth width onto the occlusal plane. This individual tooth AALL means that space is needed to upright the occlusal surface of a tooth parallel to the occlusal plane. Additional arch length is required to upright teeth tipped mesiodistally along the COS, but is not required for pure extrusion or intrusion of teeth maintaining the mesiodistal tooth axis. The AALL of an arch also can be measured by subtracting the sum of the 2D tooth widths from the sum of the 3D tooth widths or by summing individual tooth AALLs.
When estimating the AALL, the question is raised as to which reference points should be used for arch circumference measurements. Braun et al.13 measured the 3D arch circumference by summing the distances between the distobuccal cusp tip of the second molar, the mesiobuccal cusp tip of the first molar, the buccal cusp tips of the premolars, the cusp tip of the canine, and the center points of each incisal edge. This may lead to underestimation of the 3D arch circumference in the molar region because the curve formed by the occlusal surfaces of the molars is deeper than the line connecting the distobuccal cusp tip of the second molar, the mesiobuccal cusp tip of the first molar, and the buccal cusp tip of the second premolar. When using a coordinate measuring machine equipped with a mechanical probe, the position of the contact point or the proximal maximum convexity cannot be reached by the mechanical probe. This could explain why Braun et al.13 used the cusp tips as measurement points.
A software tool that calculates the 2D arch circumference and 2D tooth width can be added easily to digital model analysis programs,1415 which means that the AALL can be estimated more easily and accurately by subtracting the 2D arch circumference from the 3D arch circumference or by subtracting the sum of the 2D tooth widths from the sum of the 3D tooth widths in each case, rather than estimating the AALL using various equations suggested by different authors.91011121316 In this case, using the proximal maximum convexities to calculate the AALL can be more convenient than using landmarks such as cusp tips because identification of the proximal maximum convexities is also required for tooth size measurements and calculations of the required space and arch length discrepancy.
The purpose of this study was to compare the AALL measured from the cusp tips (AALLct) with that measured from the proximal maximum convexities (AALLpmc) to determine the most suitable reference points for calculation of the AALL.
MATERIALS AND METHODS
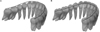
A set of mandibular teeth from a typodont (PEANA001; Nishin, Tokyo, Japan) was scanned using a 3D scanner. From these digital models of teeth, a virtual occlusal plane was established to measure the COS, and 16 digital setup models were made using 3D software (Geomagic Design X 2014; 3D Systems, Rock Hill, SC, USA). The COS of each setup was increased gradually from 0 mm to 4.7 mm. The maximum depth of 4.7 mm was set according to the maximum COS reported in a previous study.17 The definitions of terms used in this present study are listed in Table 1.
Previous studies121316 used the sum of the COS depths on the right and left sides. However, in the present study, the COS depth was defined as the average of the right side and left side depths, because the average value is more frequently used than the sum of the right side and left side COS depths391819 and compatible with the rule of thumb.1011
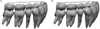
In each setup, even marginal ridge relationships between adjacent teeth were maintained. The interproximal contacts were made to occur at the adjacent proximal maximum convexities, which were determined from a plane perpendicular to both the occlusal plane and line of occlusion (Figure 1B). These contacts were checked with a clipped view to minimize overlapping of the proximal surfaces. During each setup, the mesiobuccal cusp tip of the mandibular first molar was placed deepest from the occlusal plane, because this was observed in previous studies.161819 A constant arch form was maintained by setting the intercanine and intermolar widths at 27 mm and 46 mm, respectively. The AALL was calculated by subtracting the 2D arch circumference from the 3D arch circumference (Tables 2 and 3, Figure 2).
While distances between cusp tips cannot be described as the tooth width, distances between adjacent cusp tips or between adjacent proximal maximum convexities were defined as the tooth width for ease of understanding (Table 1). The contribution of the uprighting of each tooth on the AALL was evaluated by calculating the individual tooth’s AALL by subtracting the 2D tooth width from the 3D tooth width. These values were measured for each setup, and mean values were calculated after averaging the measurements from the right and left sides.
The Shapiro-Wilk test confirmed that measurements from the cusp tips and proximal maximum convexities were consistent with a normal distribution. Therefore, the paired t-test was used to evaluate differences between these two measurements. In addition, linear regression equations were obtained for both measurements. The determination of reference points and measurements of the 10 setup models were repeated by the first author at a 3-month interval. Then, method errors were calculated with Dahlberg’s formula.20 The method errors of both 3D and 2D measurements of distances between cusp tips were 0.429 mm and 0.431 mm, respectively, and the method errors of 3D and 2D measurements of distances between proximal maximum convexities were 0.111 mm and 0.094 mm, respectively. The threshold for statistical significance was set at p < 0.05. All statistical evaluations were conducted using IBM SPSS Statistics version 20 (IBM Co., Armonk, NY, USA).
RESULTS
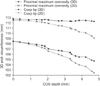
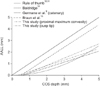
As the average of the right side and left side COS depths increased from 0 mm to 4.7 mm, the 2D arch circumference decreased by 6.0 mm in the cusp tip measurements, and by 3.4 mm in the proximal maximum convexity measurements (Tables 2 and 3, Figure 3). Simultaneously, the 3D arch circumference decreased by 3.8 mm in the cusp tip measurements and by 0.4 mm in the proximal maximum convexity measurements. These changes resulted in a 2.3 mm increase in the AALLct and a 3.0 mm increase in the AALLpmc as the COS depth deepened from 0 mm to 4.7 mm. A paired t-test revealed a significant difference between the AALLct and AALLpmc (p = 0.002).
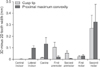
Examination of the mean values of the individual tooth AALL disclosed that the value was highest between the first and second molars for the cusp tip measurements (0.27 mm) and at the mandibular second molar for the proximal maximum convexity measurements (0.32 mm).
The following regression equations were obtained:
Y = 0.48X – 0.31 (R2 = 0.94) for the cusp tip measurements
Y = 0.62X – 0.38 (R2 = 0.88) for the proximal maximum convexity measurements
where Y (mm) is the AALL and X (mm) is the average of the right side and left side COS depths.
DISCUSSION
The 3D arch circumference represents the arch length after complete leveling of the COS. Therefore, the 3D arch circumference should be constant regardless of the COS depth. However, the 3D arch circumference decreased by 3.8 mm in the cusp tip measurements because the distances between adjacent cusp tips decreased as the COS deepened from 0 mm to 4.7 mm. This means that the AALLct would be underestimated. In contrast, the 3D arch circumference measured from the proximal maximum convexity decreased by only 0.4 mm as the COS deepened from 0 mm to 4.7 mm.
When the COS deepens, the interproximal contact points move slightly in the occlusal direction, thereby reducing distances between contact points. This might have caused the 0.4 mm reduction in 3D arch circumference in the proximal maximum convexity measurements. This result indicates that the proximal maximum convexity is more appropriate than the cusp tip as a reference point for estimation of the AALL.
There was also a greater reduction in the 2D arch circumference with the cusp tip measurements. Therefore, the greatest difference in the AALL (3D arch circumference minus 2D arch circumference) was only 0.9 mm smaller with the AALLct when the COS depth was 4.7 mm.
The mean value of individual tooth AALLs was lowest in the mandibular second premolar and central incisor areas, and highest in the mandibular second molar area. The lowest value for the 3D tooth width minus the 2D tooth width at the mandibular second premolar is attributable to it being near the center of the COS and having a smaller mesiodistal width than the mandibular first molar (Figure 4). The greatest increase in the COS was reported as occurring with the eruption of the mandibular second molars.3 The value of the 3D tooth width minus the 2D tooth width of the mandibular second molar accounted for about half of the AALL. If the mandibular second molar could be uprighted with the center of rotation near its center of resistance, then this uprighting would cause minimal flaring of the mandibular incisors during leveling of the COS. Extraction of the third molars would be helpful to make room for distal uprighting of the mandibular second molars and to facilitate uprighting of the mandibular second molar with the accelerated regional phenomenon.2122
Braun et al.13 reported a relationship of Y = 0.2462X – 0.1723, where Y is the arch circumference differential in millimeters, which is the same as the AALL in the present study, and X is the sum of the right side and left side COS depths in millimeters. When X is defined as the average of the right side and left side COS depths, as in the present study, this regression equation can be converted to Y = 0.4924X – 0.1723. The popular rule of thumb for estimating the AALL is Y = X.1011 In the present study, the linear regression equation of Y = 0.479X – 0.31 was obtained from cusp tip measurements.
This similarity between the cusp tip measurements in the study by Braun et al.13 and in the present study is attributable to the use of the same reference points. When the COS depth is 4.7 mm, the equations from cusp tip measurements in the present study and the equation from Braun et al.13 would predict only 61% (1.94/3.2) and 67% (2.14/3.2) of the AALLpmc values, respectively.
Braun et al.13 suggested that the increase in arch length after leveling is mainly due to flaring of the incisors during leveling with a continuous wire and the geometric requirement of the AALL being smaller than was previously thought (Figure 5).121623 This suggestion emphasizes the importance of flaring caused by the biomechanics of leveling using a continuous arch wire. Although this suggestion is valid, the geometric requirement of the AALL is not negligible given the larger AALL estimated from the proximal maximum convexity measurements.
If the available space is measured using a brass wire bent to follow both the line of occlusion and the COS in the vertical aspect, this available space would constitute the 3D available space. Digital model analysis programs usually measure the available space by drawing a 3D spline curve over the arch and inserting control points as needed to conform to the COS, and these control points are automatically placed onto the mesh surface. This measurement of available space is also the 3D available space. In these cases, measurement of the arch length discrepancy reflects the space deficiency or redundancy in aligning teeth into the arch with the COS bent into the brass wire or spline curve that was used for the measurement of available space. Thus, the AALL can be estimated by subtracting the 2D available space that is the projection of the 3D available space (length of the spline curve or brass wire) onto the occlusal plane. This 2D available space also can be measured by bending a flat brass wire over a transparent acrylic or glass plate placed over the occlusal surface of a model. If a brass wire or digital spline curve for measuring the available space was not bent to conform to the COS and kept flat in the vertical aspect, this measurement also can be viewed as the 2D available space. The arch length discrepancy and AALL can be calculated simultaneously by simply subtracting the required space from the 2D available space. When this measurement of arch length discrepancy is used, neither AALL estimation nor measurement of the COS depth is needed.
It would be desirable to add a tool to digital model analysis programs to estimate the AALL automatically by subtracting the 2D arch circumference from the 3D arch circumference. This could be easily implemented by transforming the 3D coordinates of the reference points into 2D coordinates by removing the coordinate values representing vertical height (usually z values) when the occlusal plane is parallel to the base plane (usually the xy plane). This method will estimate the AALL more accurately than using a regression equation. A similar method can be used to calculate individual tooth AALLs, and this can provide information regarding which tooth requires the largest space for leveling, and would help in planning the leveling method. When the second molars have not yet erupted, the arch length discrepancy and AALL measurements can be made from the first molar to the first molar. In this case, the COS depth can be underestimated and eruption of the second molar can increase the COS.
The most ideal method of estimating the AALL and arch length discrepancy can be performed using model setups. However, model setups require considerable work. This could be overcome when a software tool for automatic alignment of the dentition is developed in the future. Until then, calculation of the AALLpmc can be useful.
A limitation of the present study is that the simulation was performed with a typodont model. It is difficult to use patient malocclusion models because there is some crowding in most cases with a deep COS. Further studies using patient malocclusion models are needed. When the COS is leveled with a continuous arch wire, then extrusion of the canines and premolars, flaring of the incisors, and tipping back of the molars would occur. This would cause a slight change in the occlusal plane. There would be a significant change in the occlusal plane, especially when leveling by intrusion is attempted. This issue should be addressed in detail in future studies.


 XML Download