

 PDF
PDF ePub
ePub Citation
 Print
Print


INTRODUCTION
The assessment of facial growth as well as the development of dental occlusion is part of the process of diagnosing orthodontic abnormalities that if prevented or treated would provide measurable benefits to patients.1 Orthodontists have acknowledged that maxillary transverse deficiencies are a significant component of many malocclusions.2
The treatment of transverse deficiencies is aimed at reducing potential periodontal problems, and improving dental and skeletal stability as well as smile esthetics.2 Lateral expansion of the bony halves of the maxilla at the mid-palatal suture was reported as early as the mid-19th century as a method to overcome transverse maxillary deficiencies.3 Current treatment methods to address skeletal maxillary constriction include the application of orthopedic forces with slow or rapid maxillary expansion protocols in children and adolescents, and surgical mid-palatal splitting in adults.456 After the completion of the adolescent growth spurt, as the mid-palatal suture progressively becomes more fused, heavier forces across the suture are required to produce meaningful maxillary skeletal expansion.6 Therefore, it is vital to assess the craniofacial skeleton in the transverse dimension as early as possible and accurately diagnose the need for transverse maxillary expansion, to improve the efficiency and effectiveness of treatment. This has driven the continued evolution and development of diagnostic tools for evaluating the maxillary transverse dimension.
Diagnosis of maxillary transverse deficiencies can be difficult, and often includes the use of more than one of the following methods: clinical evaluation, dental cast analysis, occlusograms and/or craniofacial radiography.7 Posteroanterior cephalograms (PACs) have previously been considered the most readily available and reliable way to evaluate transverse skeletal discrepancies.8 Nevertheless, it is known that conventional two-dimensional (2D) imaging of skeletal structures has technical limitations that affect the accuracy of landmark placement, which along with practitioner inexperience in identifying PAC landmarks has resulted in significant landmark identification errors.91011
To further complicate the situation, a universal gold standard has not been identified in the literature for diagnosing maxillary transverse deficiencies; however, it has been suggested that a sufficiently accurate diagnosis involves both clinical and radiographic evaluations, and PAC is currently considered the best modality for evaluating transverse skeletal dimensions.8 Most commonly, clinicians use a method that relies on a combination of clinical and dental cast assessments that evaluates the presence of crossbites, degree of crowding, arch width measurements, perceived buccolingual inclination of teeth, and the shape and height of the palatal vault.68
With three-dimensional (3D) imaging emerging as a feasible diagnostic modality for clinical use in orthodontics, improvements in the utilization of cone-beam computed tomography (CBCT) images to diagnose maxillary transverse deficiencies may be useful. As 3D images are not affected by the technical limitations associated with 2D PAC, the use of this technology has thus far demonstrated significantly less variability and more reproducibility of transverse measurements on CBCT-constructed PAC images, compared to conventional 2D PAC.1213 The ability to make localized and specific transversal radiographic cuts of CBCT images to assess areas of clinical interest is also of significant potential in the diagnosis of the craniofacial transverse dimension.
As the availability of CBCT imaging in clinical practice increases, it would be beneficial to determine whether CBCT imaging improves the diagnosis of transverse maxillary deficiencies, or whether it just improves landmark location precision. Clinically meaningful accuracy and reliability should be confirmed before the more widespread use of CBCT and its associated ionizing radiation is advocated. The objective of this review was to evaluate the accuracy and reliability of the available diagnostic tools used to assess maxillary transverse deficiencies.
Go to : 
MATERIALS AND METHODS
Reporting of this review was based on the Preferred Reporting Items for Systematic Reviews and Meta-Analyses (PRISMA).14
Eligibility criteria
The clinical question was generated using the PICOS format15;
Population: Orthodontic patients with mixed or permanent dentitions with all permanent first molars present.
Intervention: 3D diagnostic analysis.
Comparison: Combination of clinical assessments, plaster models, and/or PAC as a proxy for a gold standard, as there is no universally accepted gold standard.
Outcomes: Accuracy and reliability of 3D diagnostic analysis.
Study design: Diagnostic, observational, and interventional studies were considered. With regard to the latter, only data pertinent to the systematic review question were collected.
Only studies that reported the accuracy, validity, and/or reliability of a diagnostic method or evaluation technique for maxillary transverse dimensions in humans with mixed or permanent dentitions and all first permanent molars present were included in the analysis. Studies that included primary dentition, only evaluated vertical and/or anteroposterior maxillary deficiencies, or included syndromic patients and cleft lip and/or palate patients were excluded.
Information sources
A systematic search of the three electronic databases MEDLINE (OvidSP), PubMed, and EMBASE (OvidSP) from the date of their establishment to the second week of April 2015 was conducted to identify relevant studies, with the aid of a health sciences librarian.
Search strategy
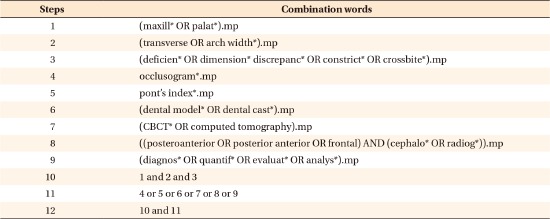
The search was conducted irrespective of language using key words, combinations of key words with truncations, and Medical Subject Headings (MeSH). The search strategy was designed for MEDLINE as shown in Appendix 1, and was adapted to facilitate searching of the other databases. Reference lists of retrieved articles were manually searched to identify additional potentially relevant articles. A limited search of the "grey-literature" was conducted via Google searching (analyzing the first 100 hits) and searching relevant textbooks using key words.
Study selection
In the initial stage of article selection, titles and abstracts were reviewed by two reviewers (DS and KC) to remove all articles that appeared to be unrelated to the topic or breached the exclusion criteria. At this stage, any articles that evaluated maxillary transverse dimensions were included. Results between reviewers were compared to identify discrepancies. Where they existed, they were resolved by a third party (ML). Where the abstract of an identified article did not contain sufficient information (or was unavailable), the full text of that article was obtained for review. For those abstracts that were deemed potentially useful, full text articles were then reviewed in the final selection stage. Inclusion and exclusion criteria were applied again in duplicate (by DS and KC) as some of the information provided in the abstracts may have been misleading. References lists of full text articles that were included in the review were also manually searched to identify any additional articles.
Data collection process
Two independent reviewers (DS and KC) assessed and obtained data from each of the selected articles. The data collected were compared and a third party (ML) resolved any discrepancies identified.
Data items
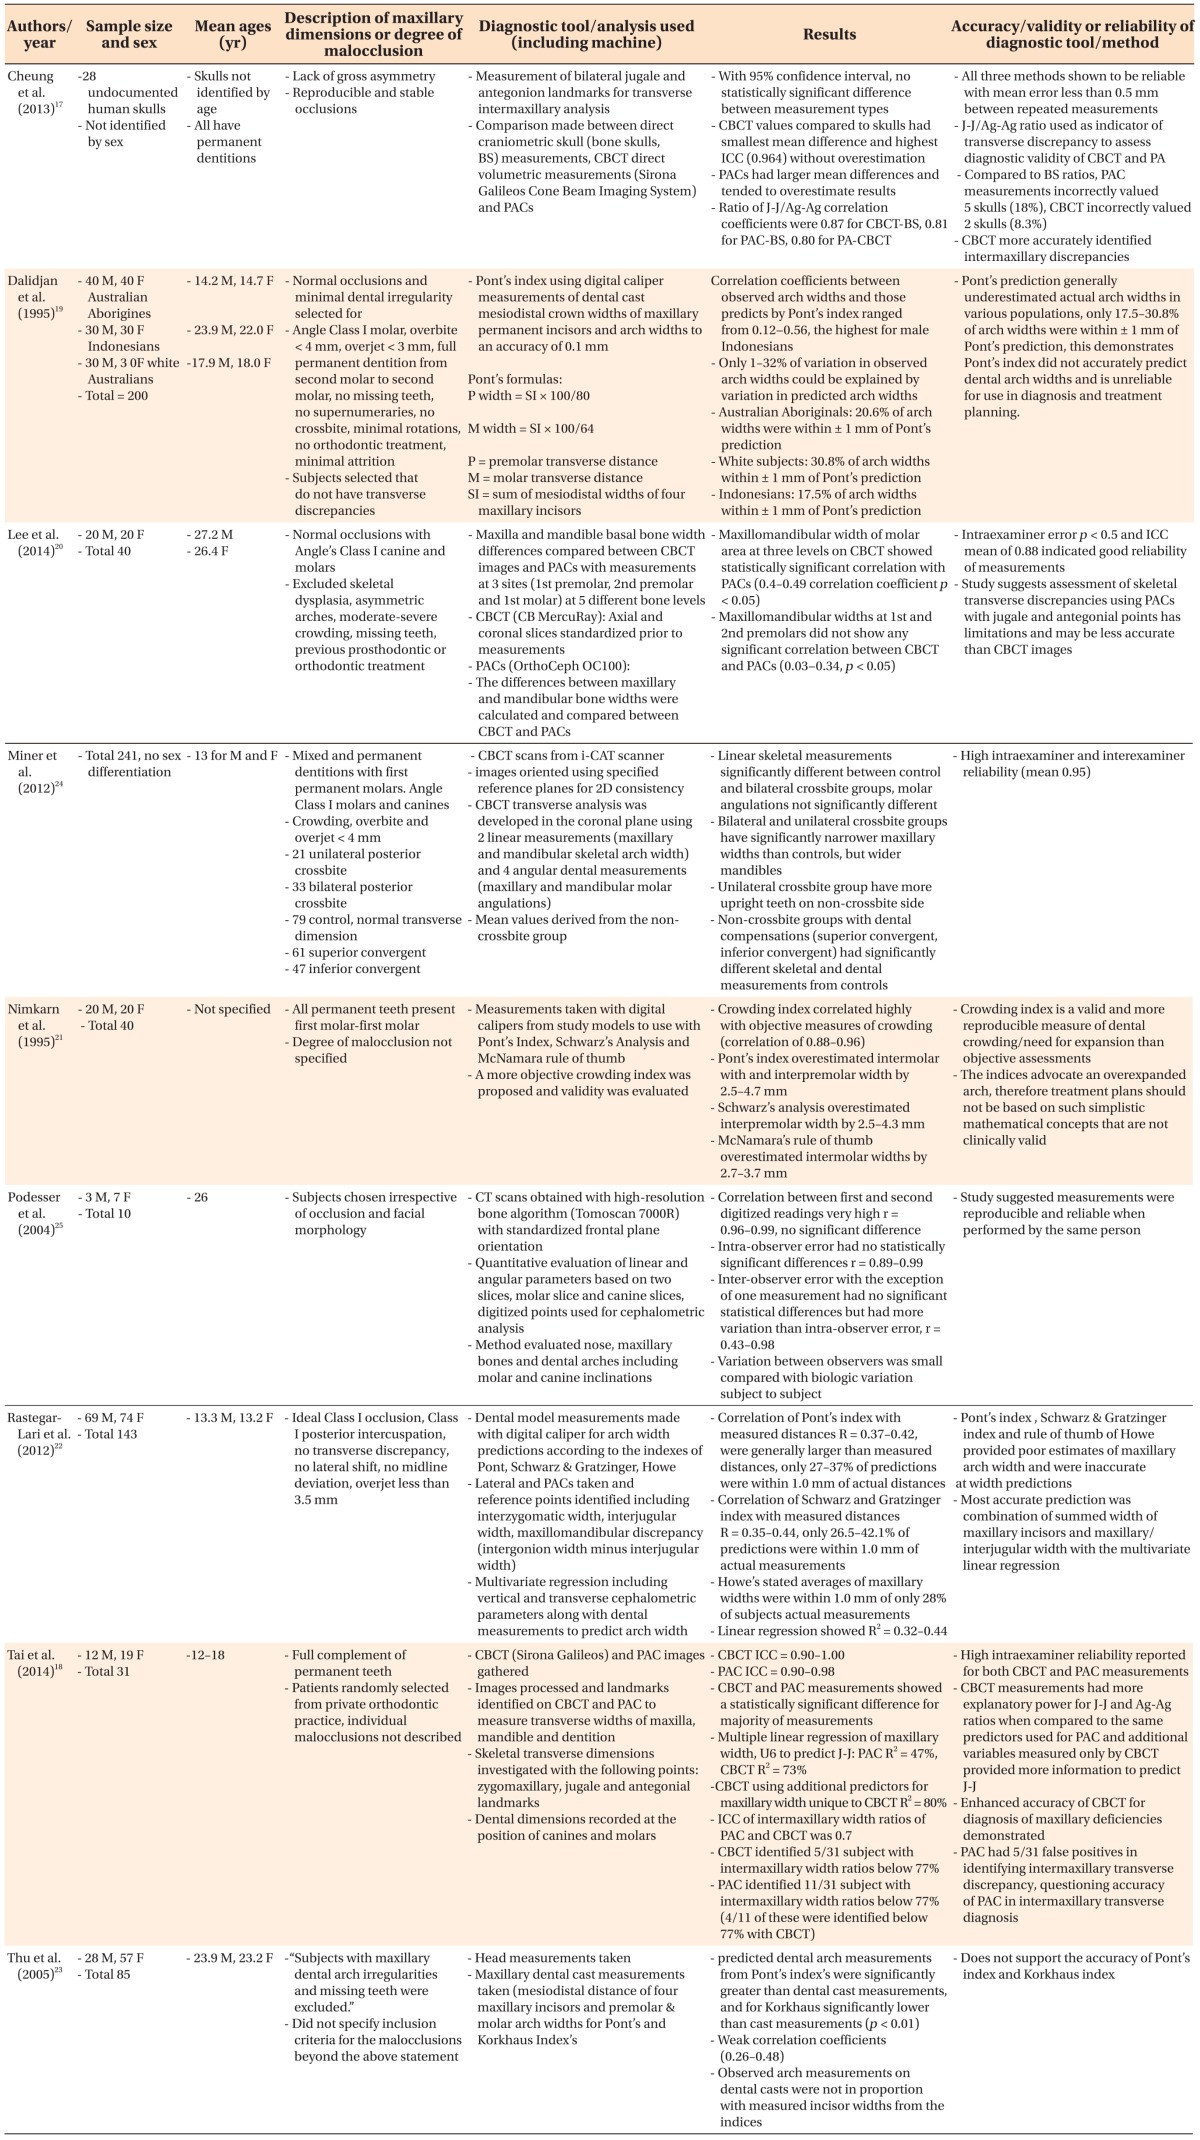
Data that were obtained from the final studies selected included sample size, mean age, type of diagnostic tool (including machine) used, degree of maxillary transverse dimensional deficiency, diagnostic accuracy, accuracy and reliability of each tool, and analysis or assessment method used (Table 1).
Risk of bias in individual studies
Two reviewers (DS and KC) used the Quality Assessment of Diagnostic Accuracy Studies tool-2 (QUADAS-2) to evaluate risk of bias.16 The reviewers assessed the risk of bias of each study independently and discrepancies were resolved by a third reviewer (ML).
Summary measures
The accuracy and reliability of each method were considered, as were the sensitivity and specificity of each diagnostic technique used to assess maxillary transverse dimensions. In addition, positive predictive value (PPV), negative predictive value (NPV), positive likelihood ratio (LR+), negative likelihood ratio (LR–), and ROC curves were considered, where available.
Go to :
RESULTS
Study selection
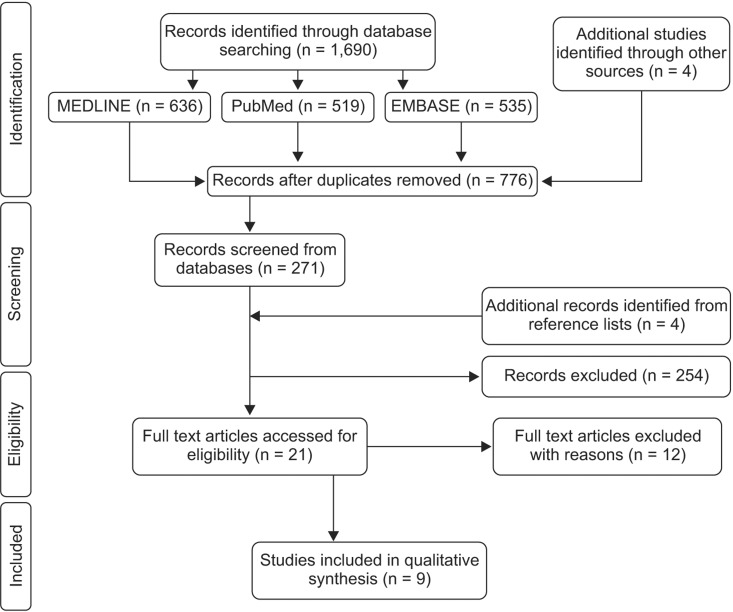
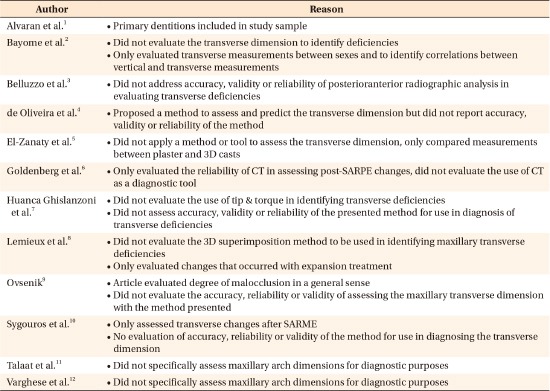
A flow chart of the article selection process at each stage of the review is presented in Figure 1. A total of 21 full text articles were retrieved and reviewed, of which 12 were subsequently excluded due to reasons outlined in Appendix 2. Nine articles were found to meet the selection criteria and were included for qualitative analysis.
Study characteristics
A summary of the key study characteristics and results of the selected articles is presented in Table 1. The articles were all in English, they were published between 1995 and 2014, and the sample sizes of the studies ranged from 10–241. Only 2 studies1718 assessed the validity of the tools they used to diagnose maxillary transverse discrepancies. Five assessed the accuracy of each tool or analysis technique used to measure or predict arch widths,1920212223 while only 2 evaluated the reliability of a proposed transverse analysis or assessment technique.2425 No studies reported the sensitivity, specificity, PPV, NPV, LR+, LR−, or ROC curves of the methods used to diagnose transverse deficiencies.
Risk of bias within studies
The risk of bias was assessed in each article using the QUADAS tool (Table 2). The studies were heterogeneous, with moderate to low methodological quality, and all were deemed to have a high risk of bias. Six articles were of moderate quality, fulfilling 50−64% of the QUADAS criteria, and 3 were of low quality, fulfilling 29−32% of the QUADAS criteria. Common weaknesses included inconsistent reference standards attributed to the lack of a true gold standard (all studies), inadequate sample sizes,171825 no blinding (all studies), use of a spectrum of patients not representative of the population that would receive the assessment in practice,1719202225 and failure to validate the accuracy of the diagnostic method used to identify maxillary transverse deficiencies.19202122232425
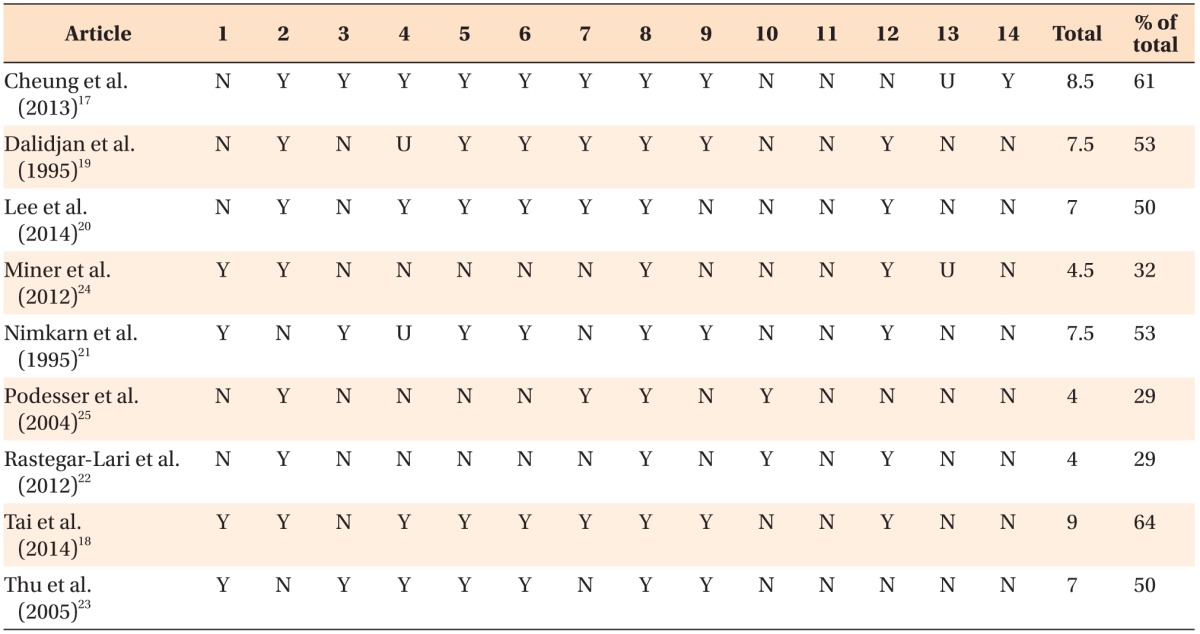
Table 2
The QUADAS-2 methodological scores of selected articles
1–14, Methodologic criteria in Table 2.
Y, Yes; fulfilled QUADAS methodologic criteria (1 point).
N, No; did not fulfill QUADAS methodologic criteria (0 point).
U, Unclear; did not provide sufficient information to evaluate (0.5 point).
QUADAS-2, the Quality Assessment of Diagnostic Accuracy Studies tool-2.
![]()
Results of individual studies
Table 1 provides a summary of the individual articles included in the current review. The studies that evaluated stone dental casts with calipers and applied various indices to predict arch width demonstrated that Pont's Index, Schwarz & Gratzinger analysis, McNamara's rule of thumb, Korkhaus' index and Howe's Index were inaccurate for predicting arch widths, and unreliable for use in diagnosis when compared to actual arch width measurements.192123 The crowding index21 and multivariate linear regression21, which combined dental cast measurements and PAC landmarks,22 were shown to be more accurate tools for predicting arch width dimensions than the other dental cast indices.
The studies171820 that compared transverse landmark identification and analysis of CBCT images to PAC, including one that compared both imaging techniques to dry skull measurements,17 concluded that CBCT images more accurately and reliably assessed intermaxillary transverse discrepancies. Two studies2425 proposed new 3D transverse analyses with CBCT images using skeletal and dental linear and angular measurements. These demonstrated that the methods were reliable and reproducible, but did not compare them to other existing diagnostic tools to assess their accuracy in identifying transverse discrepancies.
Analysis of results
A meta-analysis was not possible due to the heterogeneity of the diagnostic tools assessed and the variability in study designs.
Go to :
DISCUSSION
Summary of the evidence
Accurate diagnosis of maxillary transverse deficiencies is critical for long-term periodontal stability, as an undiagnosed discrepancy may result in adverse periodontal effects and gingival recession.26 In the current systematic review, the literature was analyzed to evaluate the accuracy and reliability of the diagnostic tools used to assess maxillary transverse deficiencies in mixed and permanent dentitions. The results demonstrated that there is a lack of strong evidence and high quality diagnostic studies available that have evaluated the sensitivity and specificity of such diagnostic tools. This may be partly due to the absence of scientific literature providing evidence that supports the identification of a true gold standard diagnostic tool for evaluating skeletal transverse deficiencies. The 9 studies selected in this review were of a low to moderate standard with regard to evidence, yet they were the best studies available to address the research question; although none of them reported sensitivity or specificity.
Clinical evaluation of skeletal transverse discrepancies was not addressed in any of the studies included in the current review, although it is one of the most widely used methods for the evaluation of transverse deficiencies.27 As mentioned above in the Introduction section, chair-side assessment evaluates the presence of crossbites, degree of crowding, arch widths measured at the muccogingival junction and dental crowns, perceived buccolingual inclination of posterior teeth, and the shape and height of the palatal vault.68 One of the problems with clinical assessment is that it is based on dental crowns, without consideration of the buccolingual inclination of roots, which may camouflage the true skeletal transverse deficiency.27 There may be minimal soft tissue changes associated with a maxillary transverse deficiency including paranasal hollowing, a narrow nasal base, deepened nasolabial folds, and zygomatic hypoplasia. Therefore, anteroposterior and vertical maxillary hypoplasias are much easier to clinically diagnose due to observable soft tissue changes.8 Where anteroposterior and vertical maxillary dysplasias exist, they can clinically mask a transverse deficiency rendering clinical evaluation alone inadequate for the diagnosis of transverse skeletal discrepancies.2829
Historically, orthodontics has attempted to develop arch width predictions and average measurements using dental casts to assess the transverse dimension, but few of these proposed associations are clinically useful or accurate for individualized arch width predictions.30 Pont's index31 was proposed in 1909, to predict maxillary arch widths from the sum of the mesiodistal widths of the four maxillary incisors. Four of the articles ultimately analyzed in this review suggested that Pont's Index poorly estimates maxillary arch widths, explaining less than 32% of arch width variations, and consistently over or underestimates actual widths; resulting in low correlations between observed and predicted maxillary measurements.192123 In Schwarz & Gratzinger's analysis,32 they modified Pont's index by analyzing ideal maxillary interpremolar and intermolar widths corrected for facial type, but this was shown to generally overestimate interpremolar width in 2 of the studies included in the current review.2122 Rastegar-Lari et al.22 also found that Korkhaus' Index underestimated arch widths in their study population. Howe et al.33 proposed a simple rule of thumb for arch width prediction by determining an average maxillary intermolar width of 37.4 mm for males and 36.2 mm for females. Two articles2122 included in the current review found that McNamara's simple rule of thumb overestimated intermolar distances and inaccurately predicted maxillary arch widths.
In summary, these indices were developed to help determine how much expansion is needed to resolve crowding, but even the limited evidence identified and perused in this review strongly suggested that such methods are inaccurate, biased, and not clinically valid for diagnosis and treatment planning in the transverse dimension.2230 Dental cast measurements that are compared with averages or used with mathematical indices lead to errors, simply due to individual variation and possible selection bias of the patient population used to initially develop such tools. It is also pertinent to note that none of these methods consider the skeletal component of maxillary constrictions, questioning the usefulness of such indices and suggesting that study models are not an appropriate basis for skeletal diagnosis in the transverse dimension.26 An objective "Crowding Index" proposed by Nimkarn et al.21 was found to be a more valid and reproducible tool compared to previously developed indices, but this has not been further evaluated by other studies.
Multivariate linear regressions have been proposed by Alvaran et al.30 and Rastegar-Lari et al.22 that include cephalometric parameters, facial height, and width measurements to enhance the reliability of index predictions, providing better estimates. However, Alvaran et al.30 did not meet the inclusion criteria for this review because primary dentitions were also included in their sample and their removal from the data they provided was not possible. Rastegar-Lari et al.22 provided poor quality diagnostic evidence, and neither study validated or reported the accuracy of the methods they reported.
Accurate diagnosis and treatment objectives should be based on both clinical and radiographic evaluations of transverse deficiencies, especially when surgical expansion may be required.8 In the 1990s, PACs were considered the most readily available and reliable radiographs for evaluating transverse skeletal dysplasias.831 Using Ricketts Rocky Mountain Analysis,34 norms, and landmarks, Betts et al.8 developed a PAC analysis method that calculates the maxillomandibular width differential. This differential indicates that a transverse discrepancy greater than Ricketts norm of 19.6 mm requires skeletal expansion, and that a surgical approach may need to be considered in adults.826 However, clinicians do not routinely use PACs due to limitations related to landmark identification errors, superimposition, magnification distortion, and head rotation affecting horizontal relationships,113536 resulting in possible miscalculation of the maxillomandibular width and an inaccurate diagnosis.27 As a result, CBCT images are now being investigated for possible diagnostic superiority over 2D imaging because they have demonstrated high accuracy in quantitative and qualitative analyses, as they are better able to represent the 3D nature of the craniofacial skeleton.37
Three of the articles included in the current review compared transverse landmark identification and analysis of CBCT images to conventional PACs,171820 with one of these using direct dry bone skull measurements as a reference standard to compare both imaging modalities.17 Cheung et al.17 assessed the validity of a transverse intermaxillary analysis―the J-J/Ag-Ag ratio―on dry skulls, to identify potential errors associated with the use of PAC compared to CBCT. It was demonstrated that CBCT landmark identification was better correlated with bone skulls, and more reliable than PAC for the assessment of the intermaxillary transverse discrepancy, with CBCT incorrectly diagnosing fewer skulls (8%) than PAC (18%). Another article reported that there was no significant correlation between maxillomandibular width and CBCT images or PACs, except in the first molar area, suggesting that the assessment of transverse discrepancies using PACs may result in inaccuracies due to its 2D spatial limitations.20 Tai et al.18 also demonstrated a significant difference between specific landmarks identified on CBCT images compared to PACs, with CBCT better identifying patients with an intermaxillary width discrepancy. Interestingly, this article did not suggest a gold standard for the purpose of comparison. Therefore, the superiority of CBCT was a false premise in that article.19 At best, they were able to demonstrate that the two methods investigated yielded different results. The superiority of one method over another with regard to precision cannot be demonstrated without a gold standard. Cheung et al.17 used a dry skull as a gold standard, therefore, they were able to make a reasonable claim of superiority. However, their problem lay in the questionable clinical representation of real-life conditions when soft tissues are not depicted. These articles171820 had moderate methodological quality scores, suggesting there was less potential risk of bias compared to some of the other studies222425 included in the current review. However, the currently available evidence is not strong enough to draw reliable conclusions from, and further validation is required to confirm the diagnostic superiority of CBCT imaging.
The clinical use of CBCT in orthodontics has recently grown from 0% to 50%,38 which is not surprising as numerous studies have shown that 3D measurements closely approximate anatomic measurements,3739 supporting the accuracy of CBCT scans. CBCT demonstrates superior results over conventional 2D imaging, but its potential role in diagnosing intermaxillary transverse discrepancies is inconclusive.17 Additional standardization of structure identification, measurement processes, and image orientation is needed to enhance the quality of CBCT data.18 The article by Miner et al.24 included in this current review aimed to develop a transverse CBCT analysis method incorporating valid skeletal and dental landmarks to analyze jaw width and first molar inclination. The reliability of this newly proposed method was confirmed, but the sample size was not large enough to investigate the clinical validity of the results or to examine sensitivity and specificity.24 Podesser et al.25 suggested another method to quantify the transverse dimension with computed tomgraphy scans, involving the assessment of nasal and maxillary bones, dental arches, and molar and canine inclinations, and demonstrated a reasonably reliable 3D method to evaluate the transverse maxillary dimension. However, diagnostic accuracy was not reported in that study. Both 3D transverse analysis methods were found to be reliable and reproducible, but diagnostic validity, sensitivity, and specificity are also required to support clinical superiority over currently used diagnostic techniques. This is a clear and important limitation to our current understanding of this area. It is also critical to note that both of the proposed 3D analyses by Podesser et al.25 and Miner et al.24 used 3D scans, but confined analysis to specific 2D slices for evaluation, underutilizing the full 3D potential of the data and potentially introducing error due to inconsistencies in 3D image orientation.
Limitations of the review
At the systematic methodological review level, no reportable limitations exist as the widely accepted PRISMA guidelines were followed, and two reviewers independently selected articles and collected data to reduce selection bias. The fact that a meta-analysis was not possible is not a systematic review limitation, but rather a reflection of the limited available evidence identified.
At the study level, the most notable limitation of this review was the lack of quality diagnostic studies available for orthodontic craniofacial assessment. Of the articles retrieved, all demonstrated limited to poor evidence and a high risk of bias with regard to the reporting of diagnostic tools. None of the articles included addressed the sensitivity or specificity of the diagnostic methods used to assess clinical applicability, and 7 of them failed to validate the accuracy of the diagnostic method for identifying transverse discrepancies.19202122232425 Blinding was not performed in any of the studies included, and 5 evaluated a spectrum of patients with ideal class I malocclusions, which is not representative of the population that would receive the relevant assessments in practice.1719202225 One of the most notable weaknesses that impacted methodological QUADAS scores in the majority of the studies included in the current review was the use of an inconsistent reference standard. This is likely due to the lack of scientific evidence indicating a true gold standard that correctly identifies maxillary transverse deficiencies.
The establishment of a gold standard requires identification of the most accurate available method, that (optimally) always positively identifies the presence of a disease; or in this case a malocclusion.40 The difficulty of evaluating the sensitivity and specificity of a diagnostic method with regard to the identification of maxillary deficiencies is at least partly due to the continuous nature of dental and skeletal measurements, and the lack of clearly defined or agreed upon thresholds identifying patients as "normal" or "abnormal".41 Given the extensive variation in the normal population, it is difficult to clearly differentiate between normal and abnormal patients with a high degree of accuracy, which would be required to develop a gold standard method.
In orthodontics, defining dental and skeletal proportions that produce functionally stable and esthetic results can be quite subjective, leading to a lack of consensus among clinicians. As shown by Streit,42 when provided with intraoral and extraoral photographs, study models, frontal radiographs, and CBCT images for evaluation, there was only 55.6% agreement among experienced orthodontic clinicians when assigning patients to "transverse deficient" or "not transverse deficient" categories. The fact that expert clinicians are evidently unable to come to a consensus when identifying an "ideal" population questions the applicability of the concept of normative radiographic data. The subjective nature of orthodontic diagnoses when evaluating malocclusions, which exist on a continuum, is an inherent limitation to developing a gold standard diagnostic method in this context. This is not a problem unique to the transverse dimension; it also pertains to anteroposterior and vertical orthodontic diagnosis.
Go to :
CONCLUSION
The evidence available to-date did not allow definitive conclusions to be drawn with regard to the initial research questions, due to a lack of diagnostic studies with a low risk of bias that have evaluated maxillary transverse deficiencies. Nevertheless, some pertinent clinical conclusions could be drawn.
It seems likely that clinical evaluation alone is inadequate for diagnosing transverse skeletal discrepancies. An objective assessment method would be more useful to clinicians.
Arch width prediction indices and average measurements derived from dental casts are not clinically applicable to the general population, and do not take the skeletal component of transverse deficiencies into account.
CBCT images appear to be more reliable than PACs, and offer an unobstructed view for the assessment of transversal intermaxillary discrepancies; though notably, further validation is required to confirm the diagnostic superiority of CBCT.
Go to :
 XML Download