

 PDF
PDF ePub
ePub Citation
 Print
Print


INTRODUCTION
Conventional orthognathic surgery requires presurgical orthodontic treatment to achieve dental decompensation and establish stable surgical occlusion. However, presurgical orthodontic treatment has several disadvantages such as prolonged treatment time or worsening of function and facial profiles. Therefore, orthognathic surgery without presurgical orthodontic treatment (also known as the preorthodontic orthognathic surgery [POGS] approach) is currently being used in patients with skeletal Class III malocclusion seeking immediate esthetic improvement.12
The POGS approach can minimize presurgical preparation and achieve immediate esthetic improvement, while shortening the total orthodontic treatment time owing to the regional acceleratory phenomenon.345 However, the vertical dimension can increase after surgery because of occlusal interference, and the influence of such occlusal instability on postsurgical skeletal changes is not well understood.67
Several studies have documented postsurgical skeletal changes in patients undergoing POGS;67891011121314 however, these studies used lateral cephalograms and evaluated postsurgical changes two-dimensionally—a technique that has several limitations such as the superimposition of craniofacial structures that could obscure the landmarks and the distortion of distances and angles.1516 Moreover, a lateral cephalogram can be used to evaluate only anteroposterior and vertical movements and not transverse movements along the coronal plane. In contrast, three-dimensional (3D) cone-beam computed tomography (CBCT) can produce more accurate images without distortion and can be used to evaluate 3D skeletal changes via superimposition with the cranial base structure, which is not affected by surgery.171819
The aim of this study was to use CBCT to evaluate postsurgical skeletal and dental changes in patients with skeletal Class III malocclusion who underwent orthognathic surgery using intraoral vertical ramus osteotomy (IVRO) with and without presurgical orthodontic treatment. The null hypothesis was there would be no differences in postsurgical skeletal and dental changes after IVRO between the POGS and conventional surgery (CS) groups.
MATERIALS AND METHODS
Subjects
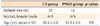
This retrospective study included 24 patients (12 men and 12 women; mean age at the time of surgery, 22.1 years) with skeletal Class III malocclusion, who underwent bimaxillary orthognathic surgery performed by a single surgeon. The inclusion criteria were as follows: (1) skeletal Class III malocclusion with ANB ≤ 0°; (2) age ≥ 18 years; (3) cervical stage ≥ 5 determined using the cervical vertebral method at the presurgical stage; and (4) bimaxillary orthognathic surgery (maxilla, 1-piece Le Fort I osteotomy; mandible, bilateral IVRO). The exclusion criteria were as follows: (1) craniofacial disorders such as cleft lip and palate and (2) a history of orofacial surgery because of trauma. Subjects were divided into two groups: the POGS group (6 men and 6 women; mean age, 21.8 ± 4.3 years) underwent orthognathic surgery without presurgical orthodontic treatment, and the CS group (6 men and 6 women; mean age, 22.4 ± 3.2 years) underwent conventional presurgical orthodontic treatment, including leveling, alignment, and arch coordination, for a mean duration of 18 months (Table 1). In both groups, intermaxillary fixation was retained for 2 weeks after surgery. Thereafter, the patients were instructed to undergo active physiotherapy (PT) using bilateral intermaxillary elastics, and the PT was continued until the appropriate range of jaw movement was achieved.
This study conformed to the guidelines of the Declaration of Helsinki and was approved by the institutional review board of Yonsei Dental Hospital (2 2013 0028).
CBCT scanning
Both groups underwent CBCT (Alphard 3030; Asahi Roentgen Inc., Kyoto, Japan) before surgery (T0), 1 month after surgery (T1), and 1 year after surgery (T2). The maxillofacial regions were scanned for 17 seconds with a field of view of 20 × 17.9 cm at 80 kVp and 5 mA. The CBCT data were reconstructed into 3D images by using the OnDemand3D software (CyberMed Inc., Seoul, Korea).
Analysis of 3D CBCT images
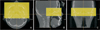
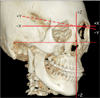
The 3D images at T0, T1, and T2 were superimposed with the cranial base structure, which was not altered by the surgical procedure, as the reference by using the OnDemand3D software (Figure 1). The horizontal reference plane was established parallel to the Frankfort plane (plane constructed with both the orbitale and porion) and passed through the nasion. The midsagittal reference plane was perpendicular to the horizontal reference plane and passed through the nasion and the midpoint of both orbitale points. The coronal reference plane was perpendicular to the horizontal and midsagittal reference planes and passed through the nasion. This coordinate system was used to construct a 3D coordinate system, and the nasion was set as the origin (0, 0, 0) (Figure 2).
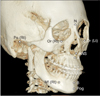
In the OnDemand3D program, 9 skeletal landmarks were designated (Table 2, Figure 3) and were redigitized 2 weeks later by a single investigator to confirm their reproducibility. The 3D movement of the maxillary and mandibular skeletal landmarks in the surgical (T0–T1) and postsurgical (T1–T2) periods were calculated. The mental foramen was used as a mandibular skeletal landmark because it is not affected by orthodontic treatment or surgeries, such as genioplasty or angle shaving.
Cephalometric variables
By using the lateral cephalograms generated from CBCT data, we identified 7 cephalometric variables including 5 angular measurements (S, N, and point A [SNA]; S, N, and point B [SNB]; point A, N, and point B [ANB]; the SN plane and maxillary incisor [U1 to SN]; and the mandibular plane and mandibular incisor [IMPA]) and 2 linear measurements (overjet [OJ] and overbite [OB]).
Statistical analysis
IBM SPSS Statistics for Windows, version 21.0 (IBM Corp., Armonk, NY, USA), was used for statistical analyses. Because of the small sample size, nonparametric statistics were used in this study. The Mann-Whitney U test was used to determine the differences between the two groups at each time point, and a Wilcoxon signed-rank test was used to compare the movement of the skeletal landmarks and changes in cephalometric variables during the surgical and postsurgical periods within each group.
RESULTS
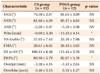
Baseline demographic characteristics were similar between the two groups (Table 1). In the presurgical period, the two groups showed no significant difference in the skeletal and dental variables except Wits and IMPA (Table 3).
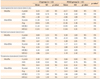
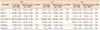
In the surgical period (T0–T1), the two groups showed no significant difference in the 3D movement of the skeletal landmarks. The mean surgical movement at the PNS was 1.3 mm (standard deviation [SD], 1.4 mm) anteriorly and 5.7 mm (SD, 1.0 mm) superiorly in the CS group, and 2.1 mm (SD, 1.0 mm) anteriorly and 5.3 mm (SD, 2.0 mm) superiorly in the POGS group. The mean surgical mandibular movement at the B point was 11.3 mm (SD, 5.2 mm) posteriorly in the CS group and 12.2 mm (SD, 4.8 mm) posteriorly in the POGS group. The movement along the X-axis was converted to an absolute value, and it revealed no significant transverse movement in the maxilla but revealed a significant transverse movement in the B point and Pog in the mandible in both groups. Surgical transverse movement at the B point was 2.2 mm (SD, 1.6 mm) in the CS group and 2.4 mm (SD, 1.3 mm) in the POGS group (Table 4).
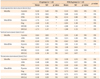
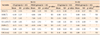
During the postsurgical period (T1–T2), the B point moved 1.8 mm (SD, 1.4 mm) anteriorly in the CS group and 2.1 mm (SD, 1.8 mm) anteriorly in the POGS group. All mandibular landmarks (the B point, Pog, and both Mf points) showed forward movement, and these changes did not differ significantly between the groups. Along the vertical plane, the Pog and both Mf points showed significantly greater upward movement in the POGS group than in the CS group (Pog, p < 0.01; Mf [right], p < 0.05; Mf [left], p < 0.01). The Pog moved 0.1 mm (SD, 1.7 mm) superiorly in the CS group and 1.6 mm (SD, 0.7 mm) superiorly in the POGS group. In both groups, none of the skeletal landmarks showed any statistically significant transverse movement (Table 5).
At 1 month after surgery (T1), the two groups showed no significant differences in SNA, SNB, and ANB. OJ and OB were 2.6 mm (SD, 0.6 mm) and 1.5 mm (SD, 0.6 mm), respectively, in the CS group and 4.8 mm (SD, 2.4 mm) and −0.2 mm (SD, 1.6 mm), respectively, in the POGS group. IMPA was 90.1° (SD, 4.9°) in the CS group and 82.4° (SD, 5.1°) in the POGS group. OJ was significantly greater in the POGS group than in the CS group (p < 0.05), whereas IMPA and OB were significantly greater in the CS group than in the POGS group (p < 0.001 and p < 0.01, respectively) (Table 6). During the surgical period (T0–T1), ANB and OJ increased and SNB and U1 to SN decreased in both groups (Table 7).
At 1 year after surgery (T2), the two groups showed no significant differences in cephalometric variables (Table 6). During the postsurgical period, SNB increased and ANB decreased in both groups. IMPA increased 2.7° (SD, 3.9°) in the POGS group and decreased 1.3° (SD, 1.5°) in the CS group. Compared to the CS group, the POGS group showed a decrease in OJ by 1.8 mm (SD, 2.5 mm) and an increase in OB by 1.8 mm (SD, 1.7 mm) (Table 7).
DISCUSSION
In this study, we used CBCT to evaluate the postsurgical skeletal and dental changes in patients with skeletal Class III malocclusion who underwent orthognathic surgery using IVRO with and without presurgical orthodontic treatment.
In the presurgical stage, the two groups showed no significant differences in variables, except Wits and IMPA. Decompensation of the incisors and the change in the angle of the occlusal plane caused by presurgical orthodontic treatment in the CS group resulted in a significant difference in those variables between groups. During the surgical period, the two groups showed no statistically significant differences in surgical movement. The PNS moved upward and the B point, Pog, and both Mf points moved backward, indicating posterior impaction of the maxilla and setback of the mandible. Significant transverse movement was observed at the B point and Pog because subjects with asymmetry were not excluded from the study.
During the postsurgical period, both groups showed minor movement (less than 1 mm) in the maxillary landmarks. In the mandible, both groups showed significant forward movement of the B point, Pog, and both Mf points, and this result coincided with those of previous studies on IVRO by Chen et al.20 who reported a 1.3-mm anterior relapse in the menton in their 2-year follow-up study, and of Abeltins et al.21 who reported forward and upward movements at the Pog 1 year after surgery. In contrast, other studies have reported different skeletal changes after IVRO. Greebe and Tuinzing22 reported a 1.2-mm backward movement at the Pog 1 year after surgery, and Jung et al.23 reported a 0.8-mm backward and 1.3-mm upward movement. Choi et al.24 reported that the most frequent relapse pattern after IVRO was backward movement of the mandible and showed a weak negative correlation between the amount of backward relapse and the amount of mandibular setback during surgery. According to this study, forward mandibular relapse would be expected when the amount of mandibular setback exceeds 13 mm.
Few previous studies have evaluated the postsurgical skeletal changes after IVRO with POGS.142526 Kim et al.26 reported a 0.6-mm forward and 2.9-mm upward movement of the Pog and menton at the 1-year follow-up, and Choi et al.14 reported a 1.9-mm and 2.7-mm upward movement at the B point and Pog at the 1-year postsurgical follow-up. Similar to the findings of our study, these results indicate greater upward movement of the mandible after IVRO in patients undergoing POGS. In our study, the POGS group showed significantly greater upward movement at the Pog and both Mf points than did the CS group. These postsurgical vertical changes in patients undergoing POGS have been reported to stem from the temporarily increased vertical dimension caused by occlusal interference. They subsequently decrease after postsurgical orthodontic correction of the occlusal interference and with the application of masticatory forces during the rehabilitation of the pterygomasseteric sling, which results in upward movement of the mandible.1426
Although patients undergoing POGS showed greater upward movement of the mandible in our study, the anterior movement of the mandible was not statistically different between the two groups. In their study on patients undergoing IVRO, Nihara et al.27 reported an "adaptive rotation" of the distal segment in the short-term period after surgery. The posterior part of the distal segment is pull up by the pterygomasseteric sling, and it causes clockwise rotation of the distal segment until 3 months after surgery because the distal segment loses its vertical support after separating from the proximal segment. In patients undergoing POGS, the removal of the occlusal interference and rehabilitation of the pterygomasseteric sling in the early postsurgical period might cause a decrease in the vertical dimension. This might induce upward movement of the distal segment rather than a counterclockwise rotation of the entire mandible on its condylar axis during the period of remodeling between the two segments.
In the POGS group, no statistically significant transverse movement was observed in the postsurgical period, despite significant upward mandibular movement. Moreover, despite the absence of rigid bone fixation between the proximal and distal segments, stable transverse position of the distal segment was maintained even in the POGS group. In both groups, intermaxillary fixation was maintained for 2 weeks after surgery, and active PT was continued until the appropriate range of jaw movement was achieved. A surgical wafer was used as a guide for the mandibular position during the PT, and this wafer was also utilized during the postsurgical orthodontic treatment, especially in patients undergoing POGS, to minimize occlusal instability. Previous studies have recommended that patients undergoing POGS, rather than CS, wear the surgical wafer for a longer duration to minimize the effect of occlusal instability.1019 Adequate use and adjustment of the surgical wafer during the postsurgical period and the force exerted by the bilateral masticatory muscles, which gradually recovered after surgery, might contribute to the stable transverse position of the mandible.
At 1 year after surgery, the two groups showed no significant difference in cephalometric variables. Nevertheless, the differences in the movement of the mandible during the postsurgical period, particularly the significantly greater upward movement observed in patients undergoing POGS, should be considered for a more reliable and predictable outcome.
The present study has several limitations. Although the movement of the maxillary landmarks was minor and statistically insignificant, it can be a confounding factor when interpreting mandibular movement. Moreover, this study had a small sample size and the follow-up was limited to 1 year. Therefore, future studies with larger sample sizes and longer-term follow-up are warranted to acquire further information about the postsurgical changes after IVRO in patients undergoing POGS.
CONCLUSION
We analyzed the postsurgical skeletal and dental changes after IVRO with and without presurgical orthodontics. Compared with the CS approach, the POGS approach with IVRO resulted in a significantly different postsurgical skeletal movement in the mandible; therefore, our null hypothesis regarding the postsurgical skeletal changes was rejected. Although both groups showed similar skeletal and dental outcomes at 1 year after surgery, in the patients undergoing POGS, upward movement of the mandible during the postsurgical period should be considered to ensure a more reliable outcome after POGS.
 XML Download