

 PDF
PDF ePub
ePub Citation
 Print
Print


INTRODUCTION
The use of plaster casts as representative dental models poses significant problems, including the possibility of deformation depending on the type of impression material, the chance of loss or damage during storage, and storage space constraints.123 To overcome these shortcomings, an alternative method using an intraoral scanner has been devised to produce three-dimensional (3D) digital models. These models offer several advantages, including easy storage and the possibility of computerized data acquisition and modeling.456789 Digital impression methods performed using intraoral scanners also completely eliminate the conventional impression-taking process using impression materials. Additionally, they reduce the gag reflex of the patient and are more comfortable, as breathing is freely permitted during the impression-taking process.1011
With the introduction of multiple intraoral scanners, numerous studies on their accuracy have also been performed. The accuracy of a scanner can be defined by 2 parameters: trueness and precision (ISO 5725-1, DIN 55350-13).12 Trueness relates to the ability of the scanner to reproduce a dental arch as closely to its true form as possible and without deformation or distortion, while precision indicates the degree to which images acquired by repeated scanning under the same conditions are identical, and has the same meaning as reproducibility.1314 Wiranto et al.15 and Naidu and Freer16 compared differences in tooth widths between images acquired by intraoral scanning and from a plaster cast model using a digital caliper to measure the accuracy of intraoral scanners. Their studies showed that measurements from the digital image and plaster cast model were similar, indicating a high level of accuracy. However, if the lengths of the plaster cast models are used as the control group, errors in the cast manufacturing process and inaccuracies originating from handling the caliper should be taken into consideration. In addition, it is difficult to set reference points for the measurement of such lengths.
Recently, to overcome the disadvantages of traditional measurement methods, the superimposition of digital images using a software program has been introduced as a method to determine scanner accuracy. In this method, the accuracies of images are compared by calculating deviations from the generated superimposed images.131417 Nevertheless, to date, studies comparing the accuracy of 3D images have mostly concerned either preparation models of single teeth for prostheses,18 the analysis of partial dental arches,19 and the analysis of ideal full dental arches.131417 They have not included cases with irregular tooth alignment, which are frequently observed in dental clinics. Crowding may cause undercut areas that appear as holes in the 3D model, and smoothing these areas with software tools can lead to errors.
Therefore, this study aimed to investigate whether tooth alignment and scanning sequence affect the precision of 3D images by scanning 4 models with various degrees of dental crowding in 2 directions and using 2 types of scanners. Moreover, by comparing sections of superimposed images of the models, differences in image precision were investigated depending on location in the arch.
MATERIALS AND METHODS
Dental arch models
Maxillary models were fabricated with resin teeth (ZYR-7008; Jining Xingxing Medical Instrument, Jining, China) and a resin base (Ortho-Jet Liquid & Acrylic powder; Lang Dental Manufacturing Co. Inc., Wheeling, IL, USA).
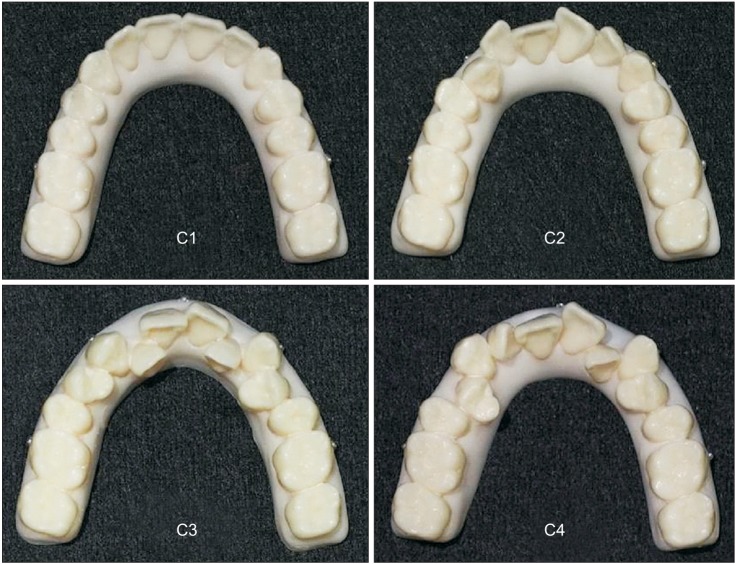
Four types of dental arch models were fabricated with differing arch length discrepancies (ALDs). The degree of dental crowding of the models was expressed in terms of ALD, which is normally used for the assessment of available space in Class I malocclusions. Model C1 represented ideal arch dentition (ALD, 0 mm); model C2 represented mild crowding (ALD, 3 mm); model C3 represented moderate crowding (ALD, 7 mm); and model C4 represented severe crowding (ALD, 10 mm) (Figure 1).
To minimize the influence of molar alignment and differences in the shape and size of the arch, the second premolar and first and second molars were arranged at the same positions and widths in all 4 models by using a putty index to hold the molars in identical positions. Dental crowding was randomly induced by repositioning only the first premolars, the canines, and the lateral and central incisors. Therefore, crowding was expressed only by anteroposterior and buccolingual displacement, and did not include deviations in vertical height.
Metal balls 1.5 mm in diameter were attached at 5 locations on the model base as fiducials to determine scanner accuracy. The posterior fiducials were located 4 mm below the dentogingival junction and below the mesiobuccal cusp of the first molars on both sides; the anterior fiducials were located 4 mm below the dentogingival junction and vertical to the contact point between the left and right central incisors. The fiducials in the canine region were located directly below the occlusal surface at the cusp tips of the canine teeth on both sides, and at the same height as the fiducials on the first molars and central incisors (Figure 1).
3D digital intraoral scanners and scanning procedures
Two types of 3D digital intraoral scanners, the iTero® (Align Technology Inc., San Jose, CA, USA) and the Trios® (3Shape Dental Systems, Copenhagen, Denmark), were used in this study. Scanning was performed following the manufacturer's instructions, and the models were divided into 2 groups based on scanning sequence.
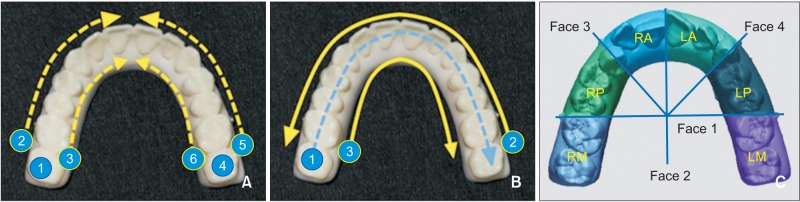
For the iTero®, Group Right indicated that the right molars were scanned first, followed by the left molars, and the scanned images from both sides were merged and connected at the anterior area. In Group Left, the left molars were scanned first, followed by the right molars, and the scanned images were similarly merged and connected.
For the Trios®, Group Right indicated that scanning started from the right molars and proceeded toward the left occlusal surface, and was completed at the left lingual surface. In Group Left, the direction of scanning was reversed; scanning started from the left molars and proceeded toward the right occlusal surface, and was completed at the right lingual surface (Figure 2).
The dental models were scanned from both the buccal and lingual aspects toward the model base; however, the bottom surface was not scanned. On the basis of the starting point of the scan, the images were classified as C1R, C2R, C3R, or C4R when the right molars were scanned first; and as C1L, C2L, C3L, or C4L when the left molar were scanned first.
A single researcher with sufficient training in scanner operation scanned a total of 16 groups (C1R−C4R and C1L−C4L on the iTero® and Trios®, respectively) 6 times (n = 6 for each group).
The superimposition of scans and the measurement of deviations
For the purpose of calculating precision, 6 of the scanned images were paired, resulting in 15 pairs of scanned data that were then superimposed. The superimposition was performed using a best-fit algorithm in Geomagic Verify™ software (3D Systems Inc., Rock Hill, SC, USA), which is point cloud inspection software that can align a pair of mesh geometries. This method is expressed using a color map that shows the deformed parts of the entire arch. The superimposed arches were divided into 6 sections, and the precision was measured in each: RM (right molar), RP (right premolar), RA (right anterior), LM (left molar), LP (left premolar), and LA (left anterior), as well as in the entire arch (Figure 2C).
Statistical analysis
Collected data were analyzed using IBM SPSS Statistics ver. 19.0 (IBM Co., Armonk, NY, USA). The precision between groups with varying degrees of tooth irregularity and the precision between sections within each group were assessed by one-way ANOVA and Duncan's post hoc analysis. The t-test was also used to compare precision among different scanning sequences and between scanners. The level of significance was set at p < 0.05.
RESULTS
Precision comparison according to the severity of tooth irregularity
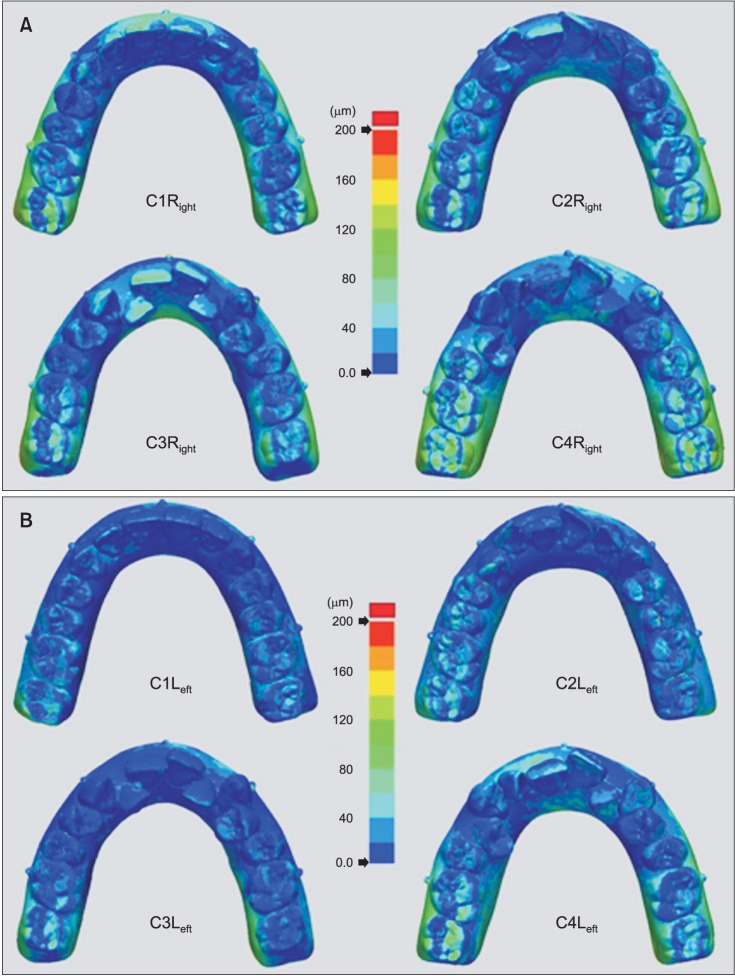
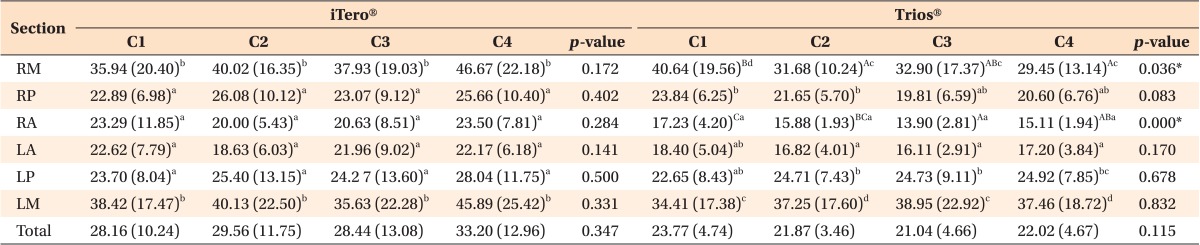
For the iTero®, there was no statistically significant difference in the deviation of any section (RM, RP, RA, LA, LP, or LM) or the whole arch (total) between models (p > 0.05). Thus, there was no significant difference in precision among dentitions with varying amounts of dental crowding. Additionally, deviations of the molar regions (LM and RM) were significantly lower than deviations of the incisal and premolar regions (p < 0.05) (Table 1). The superimposition of the scanned iTero® images was expressed as a color map (Figure 3).
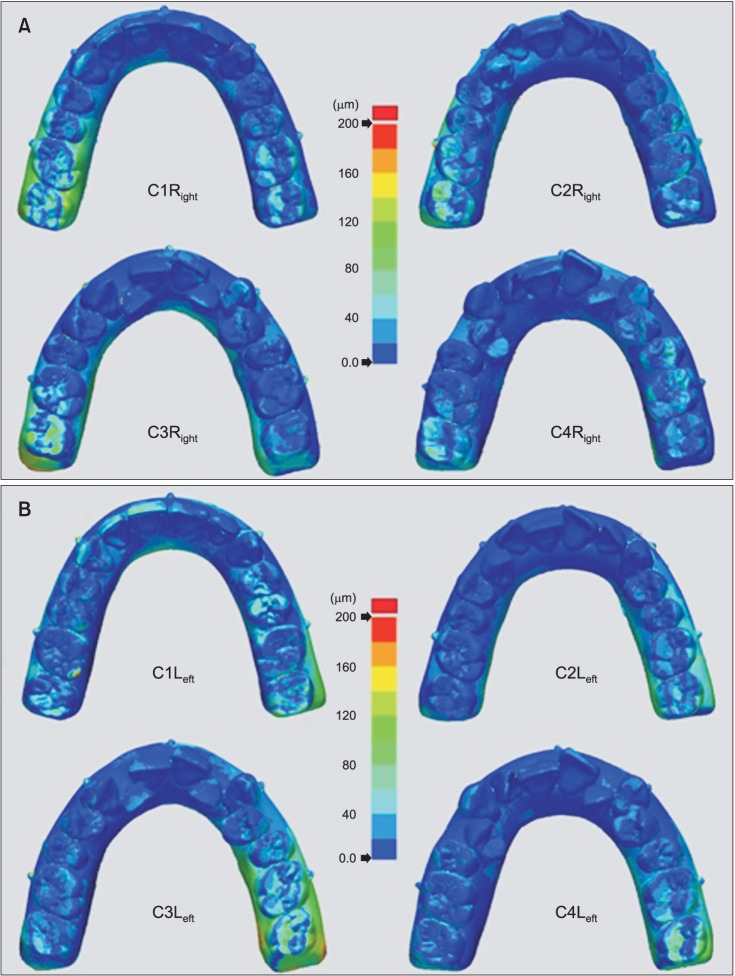
For the Trios®, there were statistically significant differences in the deviations of RM and RA between models (p < 0.05). Model C1 displayed the greatest deviations of 40.64 ± 19.56 µm and 17.23 ± 4.20 µm in the RM and RA sections, respectively. However, there was no statistically significant difference in the deviations of the other 4 sections (RP, LA, LP, or LM) or the entire arch (total) between models (p > 0.05). All models displayed less precision, and were ranked in precision in the following descending order: left and right molars, premolars, and incisors (p < 0.05) (Table 1). The superimposition of the scanned Trios® images was also expressed as a color map (Figure 4).
Comparison of precision according to scanning sequence
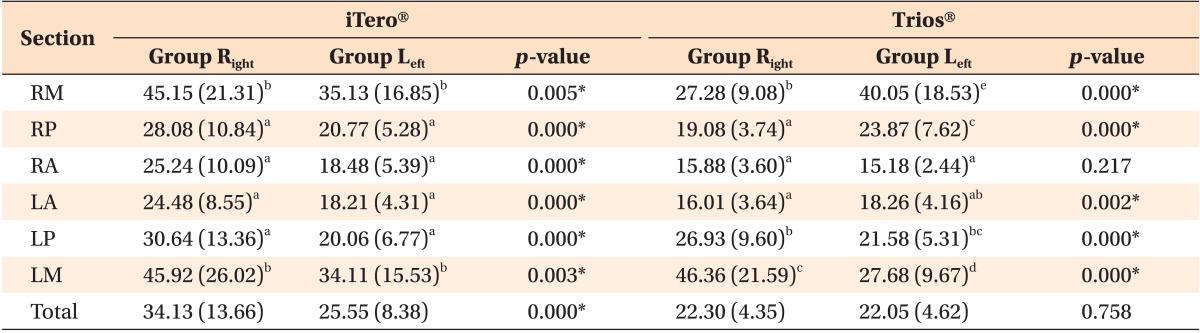
For the iTero®, the deviations of all sections (RM, RP, RA, LA, LP, and LM) and the entire arch (total) displayed statistically significant differences based on scanning sequence (p < 0.05). In the entire arch, Group Right showed a significantly greater deviation than Group Left (Figure 3). All models proved less precise in the left and right molar regions than in the incisal and premolar regions (p < 0.05) (Table 2).
For the Trios®, there were significant deviations in 5 sections (RM, RP, LA, LP, and LM) based on scanning sequence (p < 0.05). In LM and LP, Group Right displayed greater deviation than Group Left. However, in RM, RP, and LA regions, Group Left showed greater deviation than Group Right. In contrast, deviations of the RA region and the entire arch (total) showed no statistically significant difference among the groups (p > 0.05) (Figure 4). In addition, Group Right showed the least precision in the left molar region, and Group Left showed the least precision in the right molar region (p < 0.05) (Table 2).
Comparison of precision between scanners
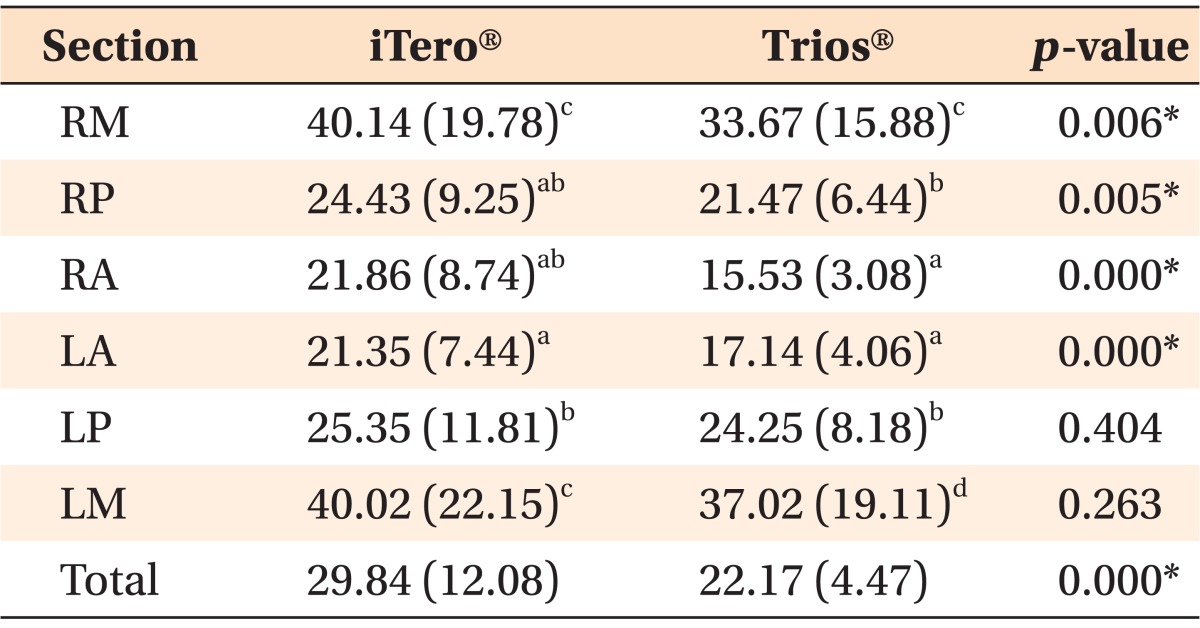
The mean deviations of the iTero® and Trios® were 29.84 ± 12.08 µm and 22.17 ± 4.47 µm, respectively. Therefore, the deviation of the iTero® was significantly greater than that of the Trios®. Deviations in 4 regions (RM, RP, RA, and LA) and the entire arch (total) showed statistically significant differences between the 2 scanners. Deviations of LP and LM regions showed no statistically significant difference between the 2 scanners (p > 0.05) (Table 3). These can be discerned more clearly on color maps (Figures 3 and 4). In addition, both scanners displayed less precision in the left and right molar regions compared with the anterior and premolar regions (p < 0.05).
DISCUSSION
As the application of digital models has broadened into many areas, the accuracy of 3D images acquired on an intraoral scanner has become an important topic in research. Hence, this study aimed to evaluate the accuracy of 2 commonly used intraoral scanner systems, the iTero® and Trios®. We evaluated the effects of crowding severity, scanning sequence, and position in the dental arch on the precision of maxillary model images obtained using these scanners. Previous studies have compared the width of teeth from scanned images with measurements taken from dental models. This method poses problems resulting from possible measurement errors and the difficulty of setting a reference point. However, recently, the superimposition of 3D images has been used extensively in studies on the accuracy of scanners.131417 Therefore, "precision" in this study was evaluated by the deviation revealed through the superimposition of images scanned repeatedly using the same scanner.
In previous studies evaluating accuracy, it was shown that superimposed scanned images were least accurate at the distal surfaces of the molar region, facial surfaces of the anterior region, and interproximal surfaces in all sections of the arch.1314 However, previous studies evaluating scanner accuracy have been carried out on models with ideal tooth alignment, and experiments on teeth with crowding have not been performed. Therefore, in this study, precision was measured by scanning models with gradually increasing amounts of crowding. In particular, the C3 model represented a typical dental arch of a patient who needs orthodontic treatment as a result of lingual side displacement of their maxillary lateral incisors. The impact of interdental overlapping on the overall scanning results was investigated in all crowding models. The experimental results suggested that neither intraoral scanner showed a significant difference in scanning precision with respect to dental crowding (Table 1). However, in a model with severe dental crowding, scanned images of the interproximal surface could not be obtained because of the limited accessibility of the scanner tip. Since both the iTero® and Trios® scanners utilize the confocal principle, they cannot focus on images if the scanner tip is far from the target.2021 In particular, in the iTero®, which has a larger scanner tip than the Trios®, there were more regions where images could not be obtained because of the limited approach of the scanner tip in anterior regions with crowding. Though there was no overall significant deviation, a large deviation, especially in interdental areas, was identified in the anterior region in models showing severe crowding (Figure 3). Since it is impossible to completely reproduce all sides of the teeth of patients with severe dental crowding using an intraoral scanner, there is the possibility of error, especially in orthodontic practices such as model measurement and the precise fabrication of an appliance.
iTero® scanners use a laser light beam based on the confocal principle, which is called "stitching," and this merging process can generate systematic errors.14 In previous studies using a Bluecam scanner (Sirona, Bensheim, Germany), images were less accurate in an experiment in which the entire arch was scanned than in other experiments in which only a quarter of the arch was scanned.1922 This implies that an increase in the image stitching process during data acquisition may affect image accuracy. In this study, the possibility of such errors was evaluated by varying the scanning sequences of both scanners. The scanning protocol was different between the Trios® and iTero® scanners. In the case of the iTero®, after half the arch was scanned separately on the left and right sides, the left and right scans were merged into a full arch based on overlapping data in the left and right central incisal regions. Compared to the Trios®, which scans all regions continuously, it is more likely that an error originating in the software occurred in the central incisal region, and in fact, it was shown that the precision of the iTero® was lower than that of the Trios® in the anterior region (Table 3). Additionally, images acquired by iTero® scanning that started from the right side displayed overall lower precision than scanned images acquired in a reverse sequence (Table 2 and Figure 3). It was likely that an error occurred as a result of changing the manufacturer's scan sequence protocol to the reverse direction. The manufacturers provide guidelines for the scanning sequence, but there are situations that make it difficult to follow these guidelines, such as difficult-to-scan areas because of severe undercuts, or scanning the more comfortable areas for patients first and the most uncomfortable areas last. Ender and Mehl23 also reported that scanning protocols deviating from those recommended by the manufacturer showed significantly lower accuracy. In contrast, although the entire arch is continuously scanned, the Trios® can generate more errors during the configuration process in regions scanned later than in those scanned earlier, as the merging of images is accumulated in the latter portion of the scanning sequence. When scanning was started from the right side, it would end on the left lingual side; therefore, lower precision was observed in the left molar region than in the right molar region. Conversely, if scanning started from the left side, the right molar region displayed lower precision (Table 2 and Figure 4). In addition, images from both the iTero® and Trios® showed lower precision closer to the bases of the models, and in particular, greater deviation was observed at the boundaries of the inferior region of the rearmost molar and the boundaries of the palatal region of the maxillary central incisor. This is consistent with the results presented as superimposition patterns of images from intraoral scanners in previous studies.131422
The precision of the Trios® was shown to be greater (deviation, 22.17 ± 4.47 µm) than that of the iTero® (deviation, 29.84 ± 12.08 µm) (Table 3). Among experiments on the precision of intraoral scanners different from those assessed in this study,1322 all deviations shown in such experiments were on the micrometer scale (less than 0.1 mm), which was difficult to identify with the naked eye. Therefore, the accuracy of most clinical intraoral scanners could be considered very high. Flügge et al.14 also compared deviations between structural intraoral images scanned directly and from cast models, and the deviation in scanning the dental arch was greater than that of model scanning. Lower precision from direct scanning can be caused by many factors, such as limited scanner operation because of the intraoral structure, a limitation of the incident angle of the scanning laser light, the presence of saliva, and increase in hand tremor due to difficulty in handling the equipment. Therefore, it is considered that further experimental studies measuring accuracy by directly scanning arches possessing irregular tooth arrangements, such as in this study, would have significance.
In other studies concerning factors affecting scanner accuracy, it was suggested that scanning targets with a slightly rough surface rather than a smooth surface increased the accuracy of scanning because light scattering due to reflection can cause inaccurate images.24 The acrylic resin used in model fabrication and the metal balls used as fiducials in this experiment also had the limitation of reflecting light, which caused more difficulties in scanning than with plaster models. In particular, since the incisal surface of the anterior region and the distal side of the rearmost molar were regions where light scattering readily occurs because of the sharp bending of the structure, errors occurred occasionally during the acquisition of images, and images were subsequently obtained through repeated scanning.18 Therefore, more attention should be paid to tooth morphology and prosthesis material when scanning intraoral structures.
Clinically, both scanners had very high precision, regardless of the amount of crowding. However, if there was dental crowding, images of all tooth surfaces within the arch could not be accurately obtained, especially of the proximal tooth surface. In addition, even if the same arch is scanned, the accuracy of an image can differ depending on the type of scanner and scanning sequence. This study can provide useful information for clinicians who intend to use a scanner on patients in clinical practice by comparing scanner precision according to dental crowding and by evaluating the impact of scanning sequence on the accuracy of 3D images. When clinicians use intraoral scanners, they should aim to select an appropriate scanner and consider aspects of the patient's oral condition that might increase the possibility of error. In the future, if digital impression taking using an intraoral scanner is to be applied to all patients, more studies on the accessibility and operability of these scanners will be required.
CONCLUSION
Precision according to the degree of tooth irregularity showed no significant difference for either the iTero® or the Trios® (p > 0.05). In other words, crowding had no effect on the precision of 3D models. However, differences in precision depending on scanning sequence were evident on both scanners. The iTero® resulted in less precise images when scanning started from the right rather than from the left (p < 0.05). The Trios® showed lower precision in the molar region opposite the location where scanning started (p < 0.05). Comparing the accuracy of the 2 scanners, the Trios® showed greater precision than the iTero®, with mean deviations of 22.17 ± 4.47 µm and 29.84 ± 12.08 µm, respectively, for the entire arch (p < 0.05).
 XML Download