

 PDF
PDF ePub
ePub Citation
 Print
Print


INTRODUCTION
Several occlusal indices have been developed to assess the outcome of orthodontic treatment in an objective and quantitative manner in order to ensure improvements in treatment quality.123 Numerous studies have evaluated occlusal index-related issues; validation by consensus among groups of experienced orthodontists, measuring and evaluating malocclusion, treatment outcome, and stability; assessing correlations or comparison among indices; and monitoring, auditing, and evaluating orthodontic care and education.456789101112131415
The Peer Assessment Rating (PAR) index and the American Board of Orthodontics Cast-Radiograph Evaluation (ABO-CR-Eval, known as the ABO-Objective grading system) are both used to ensure suitable quality of orthodontic treatment, but differ in their purposes and characteristics. The PAR index has been used to evaluate the general level of practice performance. Although the PAR enables an easy assessment of the treatment effect, it has been criticized for undue leniency with residual extraction spacing, unfavorable incisor inclinations, and rotations.16 Thus, the PAR index is not sufficiently precise to evaluate the completeness level of treatment outcome in detail. In contrast, the ABO-CR-Eval―one of the most professional standards measurement methods―was designed for specialist training and board examination in the USA.1718 It is too strict to exhibit general improvements after treatment,1019 which results in examinees selecting the best cases for the ABO evaluation. Hence, it is necessary to focus on to the ordinary or general level of practice performance.
Both the PAR index and ABO-CR-Eval uses cut-off scores to indicate the standard for assessing treatment outcome: > 30% improvement with the PAR scores and < 27 points in the ABO-CR-Eval.1718 However, the PAR index and ABO-CR-Eval markedly disagree in the assessment of treatment outcome and in the determination of the acceptable treatment outcome level. Hong et al.14 reported that, when assessing the orthodontic treatment outcome of the same subjects with Class I malocclusion, the degree of correspondence in the cut-off scores between the PAR index and ABO-CR-Eval was < 20%. Hence, it is essential to develop a new system to bridge the gap between the PAR index and ABO-CR-Eval and simultaneously indicate the amount of improvement and level of completeness after only a single measurement of the variables. Furthermore, there is a need to develop a method that can indicate the level of treatment outcome at any given time point.20 Accordingly, in this present study, we aimed to develop a new assessment system―the Improvement and Completion of Outcome (ICO) index―that can overcome the limitation of the PAR index and ABO-CR-Eval and also enable objective and consecutive evaluations of the quality of orthodontic treatment at any time point during treatment process.
MATERIALS AND METHODS
Analysis of the PAR index and ABO-CR-Eval
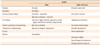
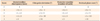
The PAR index assesses both pre- and post-treatment models and consists of 11 criteria (6 segmental assessments [upper and lower anterior segments, upper right and left segments, lower right and left segments] for teeth alignment: 2 occlusion measurements [right and left buccal occlusion] on molar relationship, and measurement of overjet, over-bite, and centerline; Table 1).4 The ABO-CR-Eval criteria include alignment/rotation, marginal ridges, bucco-lingual inclination, overjet, occlusal contact, occlusal relationships, interproximal contacts and root angulation (Table 1).18
There are several differences in the assessment protocol between the PAR index and ABO-CR-Eval. First, as the difference between the pre- and post-treatment PAR scores increase, the treatment outcome is considered to improve. However, when the ABO-CR-Eval score increases, the quality of treatment outcome is considered to deteriorate. Second, although the PAR index considers a 1-mm deviation as meaningful, the ABO-CR-Eval scoring uses 0.5 mm. Third, the overjet in the PAR index considers the relationship of the anterior teeth, whereas the ABO-CR-Eval considers both the anterior and buccal overjet (Table 1). The PAR index focuses on segmental assessments, whereas the ABO-CR-Eval assesses each tooth individually. Finally, the ABO-CR-Eval assesses 'marginal ridges' and 'bucco-lingual inclination', which are not included in the PAR index (Table 1).
Despite these differences, both the PAR index and the ABO-CR-Eval have common limitations for assessing treatment outcome. Neither of these indices includes facial assessment. Moreover, the ABO-CR-Eval only reveals degree of completeness of treatment outcome. Thus, neither index can clearly indicate the steps needed for improving the quality of treatment outcome at a specific time-point during the treatment process.
The ICO index
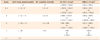
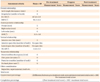
A total of 16 criteria of 4 major relationships were established to represent the malocclusion status prior to orthodontic treatment as well as the degree of improvement and the level of completion of treatment during and after orthodontic treatment (Tables 2, 3, 4, 5, 6). The information sources for the ICO index include not only dental model and intraoral measurements, but also cephalometric and photographic evaluations.
Dental relationship
· Arch length discrepancy (ALD; mm; dental model): the amount of crowding in the maxillary and mandibular arches. A positive ALD indicates spacing and is scored as −1, which means the score does not account for the amount of spacing. Intentional spacing left for dental implants and restoration is not considered as spacing.
· Irregularity (IR; number of teeth; dental model): the number of teeth that do not follow the line of occlusion.
· Upper incisor inclination to the anterior cranial base (U1-SN) (°, lateral cephalogram): if the inclination of the maxillary incisor is normal (Korean standard, 107.8° ± 5.9°), it indicates balance and harmony of the upper lip and nasolabial angle.
· Incisor-mandibular plane angle (IMPA) (°, lateral cephalogram): if the position of the mandibular incisor is normal (Korean standard, 96.3° ± 6.5°), it indicates balance and harmony of the lower lip and chin.
Antero-posterior relationship
· Overjet (mm, dental model): this is used to assess the antero-posterior relationship of the anterior teeth. Overjet is measured as the horizontal distance between the upper and lower incisal edges or cusp tips at the most prominent incisor, either as a positive or negative value from the left to the right lateral incisors. The ICO overjet is measured only in the anterior region as in the PAR index, and does not involve the assessment of every tooth, from the anterior to posterior portion, as in ABO-CR-Eval.
· Right molar position (mm, dental model): the distance from the mesio-buccal cusps to the treatment goal on the right side.
· Left molar position (mm, dental model): the distance from the mesio-buccal cusps to the treatment goal on the left side.
· Point A-nasion-Point B angle (ANB) (°, lateral cephalogram): if the value is normal (Korean standard, 2.3° ± 1.8°), it indicates balance and harmony between the 2 jaws. An excessively high or low ANB suggests Class II or III patterns in individuals.
Vertical relationship
· Anterior over-bite (mm, dental model): the greatest amount of vertical overlap of the 4 incisors.
· Anterior open-bite (number of teeth, dental model): open-bite relationship of the anterior teeth.
· Lateral open-bite (number of teeth, dental model): open-bite relationship of the premolars and molars.
· SN-MP (°, lateral cephalogram): Excessively high or low SN-MP (Korean standard, 31.8° ± 5.5°) suggests unfavorable growth patterns in individuals.
Transverse relationship
· Dental midline discrepancy (mm, dental model): the amount of difference between the maxillary and mandibular dental midlines.
· Chin point deviation (°, frontal facial photograph): the degree of the angle between the facial midline and a line perpendicular to the inter-pupillary line and the vertical line connecting the junction of these 2 lines and the soft-tissue menton, as observed in a frontal facial photo obtained in the natural head position.
· Posterior crossbite (number of teeth, dental model): buccal and lingual crossbite in the premolars and molars.
· Occlusal plane cant (°, smiling photograph): the degree of the angle between the inter-pupillary line and the line connecting the maxillary canine tips in a smile photograph.
Scoring system
For each cephalometric index, the mean value and standard deviation (SD) of the Korean samples with normal occlusion are presented in Tables 2, 3, 4, 5.21 In the "Pre-treatment", "Progress", and "Post-treatment" columns, the measurement values and scores can be observed in a side-by-side format in Tables 2, 3, 4, 5. Accordingly, the degree of improvement obtained by orthodontic treatment and the level of completion of the treatment in terms of the desired outcome can be determined at any time point during or after treatment. The score for each index was defined from 0 or −1 (worst) to 5 (ideal value or normal occlusion), in gradations of 1. The value of "−1" can be assigned only cases of spacing in ALD and negative overjet, regardless of the severity. Dental midline discrepancies and molar relationships can be measured in both directions; however, their scoring depends on the absolute measurement value. In addition, "other considerations" may be used to explain complexity or specific conditions, such as impaction, supernumerary tooth/teeth, missing tooth/teeth, etc. The decimal point of the mean and SD can be simplified according to the users' convenience.
Evaluation of the treatment outcome
The pre-treatment score indicates the problems that need to be resolved, whereas the post-treatment score presents the level of the desired treatment outcome attained. Hence, by using these 2 time-points, both the percentage improvement and the percentage completion can be evaluated.
The percentage improvement is estimate as follows:
([Difference between the pre-treatment total score and post-treatment total score] × 100)/Pre-treatment total score
Percentage completion is estimated as follows: (Post-treatment total score × 100)/Maximum total score
If the percentage completion exceeds 80%, the treatment outcome can be considered as successful; i.e., if the maximum total score is "80", a minimum of 64 points should be attained as the post-treatment final score. If the scores for "other considerations" are set by clinicians, it is necessary that some additional points should be obtained for the post-treatment total score to reach 80%.
RESULTS
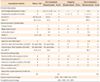
Case 1: Class I malocclusion with anterior crowding
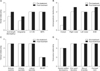
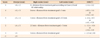
A 22-year-old woman complained of crowding (Table 7 and Figures 1 and 2). Prior to treatment, the "Dental relationship" evaluation indicated an ALD value of −4 mm ("3" points) and an Irregularity value of 6 ('2' points), which was primarily due to excess maxillary tooth mass according to the anterior Bolton ratio (75.5%). The maxillary incisors (U1 to SN, 112.2°) needed to be upright, and a slight proclination of the crowded mandibular incisors was considered. The antero-posterior relationship results were determined as follows: overjet of 7 mm ("1" point), molar distance from the Class I key of 0.5 mm ("4" points), and ANB of 3.7° ("4" points). Neither the 'Vertical relationship' nor 'Transverse relationship' values were significant, except for the midline discrepancy of 0.5 mm ("4" points). Therefore, treatment planning involved the resolution of crowding by using a non-extraction approach as well as interproximal reduction of the maxillary incisors.
Post-treatment assessments exhibited improvement in ALD (−0.5 mm, "4" points), Irregularity (4, "3" points), overjet (3 mm, "3" points), molar relationships (right, 0 mm, "5" points), and ANB (3.0°, "4" points). Since the total score was improved from "62" at pre-treatment to "68" at the post-treatment, a 9.7% improvement was obtained; however, the percentage completion was 85%, indicating a successful treatment outcome.
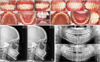
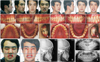
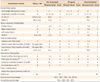
Case 2: skeletal Class III malocclusion
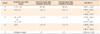
A 23-year-old man complained of having a long face and facial asymmetry (Table 8 and Figures 3 and 4). Pre-treatment assessments of the "Dental assessment" indicated an ALD values of −1 mm ("4" points) and an Irregularity value of 15 ("1" point). Despite the presence of generalized anterior spacing in both arches, both the anterior teeth (U1 to SN, 93.9°; IMPA, 75.9°) needed to be proclined, which was challenging. The antero-posterior relationship results were determined as follows: overjet of −3.5 mm ("−1" point), molar distance from the Class I key of −7 mm (left) and −8 mm (right) (overall, "1" point), and ANB of −2.3° ("−1" point). Assessments of the "Vertical relationship" indicated that the mandibular plane angle to the anterior cranial base (SN-MP) (41.3°, "2" points) was high. Furthermore, the results of the assessment of the transverse relationship were as follows: dental midline discrepancy of 1.5 mm ("3" points), posterior cross-bite value of 10 ("1" point), and occlusal plane cant of 3° ("3" points).
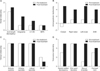
During pre-operative treatment, the correction of canting via active unilateral intrusion with miniscrews and mandibular setback (bilateral sagittal split ramus osteotomy) was planned for resolving the Class III malocclusion and facial asymmetry. During the post-surgical progress assessment, a temporary lateral open-bite was resolved by active intrusion of the maxillary molars.
The post-treatment assessment indicated improvement in ALD (0 mm, "5" points), irregularity (3, "3" points), overjet (1.8 mm, "5" points), molar relationships (right side, −0.5 mm, "4" points; left side, 0 mm, "5" points), ANB (0.7°, "4" points), dental midline discrepancy (0, "5" points), posterior cross-bite (0, "5" points) and occlusal plane cant (1°, "4" points). Since the total score had improved from "38" at the pre-treatment stage, a "64" at the post-treatment stage, a 68.4% improvement was obtained. Moreover, the percentage completion was 80%, indicating a successful treatment outcome.
DISCUSSION
In the present study, we proposed a novel assessment index that bridges the gap between subjective clinical judgment and objective assessment criteria in order to determine the orthodontic outcome. A total of 16 criteria from 4 major relationship categories were established to evaluate the degree of improvement and completion of treatment outcome, by using a systematic approach involving dental models, photographs, and radiographs obtained during the treatment process.
The assessment of the quality of ongoing treatment should be differentiated from a retrospective assessment of the outcome in completed cases. To incorporate the advantages of the PAR and ABO-CR-Eval as well as the analytical process of experts, we applied 3 distinct approaches in the present study―i.e., expansion of the assessment scope, visualization with consecutive monitoring, and a comprehensive scoring system.
The scope of assessment with the PAR and ABO-CR-Eval is limited to only a dental model and/or orthopantomogram. In reality, facial assessments are also vital. Hence, the ICO index includes 4 novel criteria related to incisor inclination and facial asymmetry: U1-SN, IMPA, chin point deviation, and occlusal plane cant. The mean and SD values of normal occlusion in any ethnicity or population can be used as reference values.
Second, the ICO index can clearly display both the problems that need to be resolved and the progress achieved by the treatment. Simple assessments and consecutive monitoring at any time-point, and not only at the end of the treatment, are fundamental to ensuring immediate and feasible feedback that can lead to suitable quality of treatment outcome. It is essential to visualize the treatment progress in the form of tables and charts by applying the same criteria from pre-treatment through to the final assessment (Tables 7 and 8, Figures 2 and 4).
Third, the ICO scoring system is designed to determine the extent of change achieved by the treatment and to concurrently determine the level of completion of the outcome. In fact, this new index appropriately balances these 2 elements. For example, in Case 1, if the pre- and post-treatment "displacement" of the PAR index had been used for assessment, the score would have been 15 and 1, respectively; a point reduction of 14 would have contributed to the degree of improvement. However, if the "Alignment" from the ABO-CR-Eval had been applied to Case 1, "4" points would have been lost, due to the lower threshold for allocating points and the inclusion of the 2nd molar assessment. In contrast, the ICO index involves an integral assessment to determine the outcome. In Case 1, the ALD was reduced by 3.5 mm and 2 teeth with Irregularity were corrected; although the final outcome still presented an ALD of −0.5 mm and 4 teeth with Irregularity, this case was evaluated as having the second best level of ALD and a middle level of 'Irregularity'.
Another example is that of overjet in Case 2; the PAR score for overjet was "4" points at the pre-treatment stage. Thereafter, the PAR score for an overjet of 1.8 mm after treatment reduced to "0" points; thus, a "4" point reduction in overjet was achieved according to the PAR assessment. However, an assessment with ABO-CR-Eval would have led to a loss of 3 points for overjet. By using the ICO index, an overjet value of −3.5 mm ("1" point) at the pre-treatment stage was found to be resolved to an overjet value of 1.8 mm ("5" points), which is the highest level of outcome for overjet according to the Korean standard values (Table 7).21
Although the percentage improvement was significantly different in Cases 1 and 2 (9.7% vs. 68.4%, Tables 7 and 8, respectively), the treatment outcome were satisfactory in both cases, with a percentage completion of 80% (Tables 7 and 8). Therefore, the difference in the level of improvement and completion of treatment outcome can be clearly explained by using these 2 percentage values.
Nevertheless, further assessments with the ICO index should be performed in various cases to establish the appropriate standard for a clinician’s overall care. Moreover, multicenter studies involving clinicians from different disciplines should be performed to determine the characteristics of clinicians that contribute to quality assurance and improved system design.
 XML Download