

 PDF
PDF ePub
ePub Citation
 Print
Print


INTRODUCTION
Bolton analysis is universally employed to determine tooth size abnormalities for diagnostic and treatment planning purposes.1 In 1958, Bolton2 evaluated patients with ideal occlusions and established two ratios using the sums of mesiodistal widths of maxillary and mandibular teeth. Bolton analysis allows clinicians to determine tooth size discrepancy and the extent of difference from the ideal ratio.34
With increasing acceptance of digital dental technology, digital study models are becoming more popular in orthodontic settings.5 The ability of digital model technology to offer efficiency and convenience for practitioners, as compared to traditional physical study models, is stimulating more rapid and wider adoption of this technology in orthodontic clinics and institutions.56
Several different methods of obtaining digital models currently exist, each with its own advantages and disadvantages. Cone-beam computed tomography (CBCT) provides three-dimensional (3D) imaging of anatomical dental and craniofacial morphology,7 providing a highly accurate one-to-one image-to-reality ratio8 and extensive diagnostic information. However, the use of CBCT in orthodontic settings is often limited to special circumstances because of the risk of the relatively high radiation dose.7 Direct digital impression scanning offers highly accurate digital models and almost one-to-one diagnostic information9 without the need for impressions. Nevertheless, Flügge et al.10 concluded that intraoral scanning was less precise than extraoral scanning. Scanning of impressions or physical models using a digital model scanner is another method of obtaining digital orthodontic models that aims to bridge the advantages of traditional physical models and digital models.
Several studies support the clinical use of computer digital models based on the clinically insignificant differences reported between physical and digital models in terms of measurement parameters including arch and tooth dimensions.51112 Whetten et al.13 studied the difference in treatment-planning decisions for patients with Class II malocclusion between digital and traditional physical study models. They concluded that digital models were an acceptable alternative to physical models in treatment planning for Class II malocclusions. Because digital models are increasingly being adopted for clinical use in treatment planning and orthodontic diagnosis, their accuracy for tests such as the Bolton analysis must be established. This is becoming especially important as new 3D scanners and software with different technologies and methodologies are being introduced to the market.
The aim of this study was to compare the accuracy of Bolton analysis of digital models scanned with the Ortho Insight 3D laser system to those of CBCT images and traditional plaster models (gold standard).
MATERIALS AND METHODS
The University of Alberta Orthodontic Program record database was used to obtain the samples needed for this study. Records were searched until 50 sets of plaster models (maxillary and mandibular) and corresponding CBCTs (I-Cat; Imaging Sciences International, Hatfield, PA, USA) were obtained. Plaster models and CBCT scans used in the study were obtained from each patient on the same day. Only complete dental arches (first molar to first molar in both arches) were included in the study.
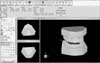
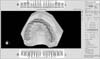
Plaster models were considered in this study to be the gold standard/true value measurement because Bolton analysis is based on their measurements. All sets of plaster models included were scanned using the Ortho Insight 3D laser scanner (Motionview Software LLC., Hixson, TN, USA), with scanning resolution set to "mid". Using the Ortho Insight 3D software (version 4.0.6), each model was digitized (Figure 1). Digitization of the models consisted of selecting the extent of each tooth mass, followed by assigning the facial axes for each tooth. The operator also indicated the location of the mesiodistal width of the tooth. The anterior and overall Bolton ratios were computed using the measurement analysis function (Figure 2).
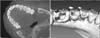
CBCT scans were taken with an I-Cat at 120 kVp, 7 mAs, and 8.9 seconds image timing. Images were taken in large view at 0.3 voxel size. Images were converted to Digital Imaging and Communications in Medicine (DICOM) format and analyzed using Avizo software (standard edition version 6.0; Mercury Computer System Inc., Chelmsford, MA, USA). To locate the required landmarks on the images, we employed 3D visualization using the Isosurface function set at a 600 to 2,700 threshold (depending on the patient's image) and CT slice visualization using the OrthoSlice function set at maximum width for contrast control and a center value adjusted for optimal perceptibility for each scan (Figure 3). Two landmarks that coincided with the maximal mesiodistal tooth width were located for each tooth from the first molar to the opposite first molar in maxillary and mandibular arches, resulting in 48 landmarks for each patient's CBCT scan. Most mesiodistal tooth width measurements in 3D CBCT images were similar to the scanned digital model analyses, but CT slice visualization was available to the examiner for more precise landmark location. For each landmark, x, y, and z coordinates were recorded. Mesiodistal tooth width measurements were obtained by calculating the distances between the coordinates of the two corresponding landmarks. Mesiodistal tooth widths were measured in all 50 plaster models using a digital caliper (Fisher Scientific International Inc., Hampton, NH, USA) and the measurements were recorded to the nearest 0.01 mm by the examiner. In order to minimize measurement errors, a single examiner performed the mesiodistal width measurements for all three types of study models.
Intraexaminer measurement errors were determined by randomly selecting 10 patient records, and the mesiodistal width measurements were repeated three times 1 week apart by the same examiner. The measurement error was obtained by subtracting two values of the three trials and averaging all differences to yield one measurement error. The average of the differences among the 10 measurements for each modality was subsequently determined.
Overall Bolton ratios were calculated by the Bolton tooth size analysis methodology2 by summing the widths of 12 mandibular teeth divided by the sum of the widths of the 12 maxillary teeth. Anterior Bolton ratios were calculated by summing the widths of the 6 anterior mandibular teeth divided by the sum of the widths of the 6 anterior maxillary teeth.
The 50 sets of records were measured once, and all measurements were tabulated using Microsoft Excel 2010 software (Microsoft Corp., Redmond, WA, USA). Statistical analyses were completed with IBM SPSS Statistics software (version 19.0; IBM Corp., Armonk, NY, USA). A paired t-test was used to analyze the mean differences between the measurements obtained from each modality. The intraclass correlation coefficient (ICC) was used to determine the agreement between the measurements.
RESULTS
Intraexaminer reliability results (Table 1) showed that intraexaminer error reliability was generally excellent (> 0.858 for all three diagnostic modalities), with < 1.45% discrepancy in the Bolton analysis. CBCT exhibited the lowest intraexaminer error reliability, with an ICC value of 0.858 for the anterior Bolton analysis and 0.927 for the overall Bolton analysis. Scanned digital models had the highest intraexaminer error reliability.
Descriptive statistics are presented in Table 2. Paired-sample t-tests comparing physical models, scanned digital models, and CBCT scan models showed mean differences in anterior and overall Bolton ratioscalculated between each of the different types of study models. The mean differences in anterior Bolton ratios between the scanned digital models and physical models, between the CBCT scan models and physical models, and between the CBCT scan models and scanned digital models were 0.59 ± 0.520%, 0.85 ± 0.641%, and 1.01 ± 0.780%, respectively. For the overall Bolton ratios, the mean differences between the scanned digital models and physical models was 0.41 ± 0.305%; between the scanned digital models and CBCT images, 0.45 ± 0.456%; and between the CBCT images and physical models, 0.67 ± 0.566%. There were no statistically significant differences in overall Bolton ratios among the three pairs, but there were statistically significant differences in anterior Bolton ratios. ICC values calculated between the CBCT scan models and the physical models were the lowest among the three pairs for both anterior and overall Bolton ratios. Nevertheless, all of the pairs showed an excellent evaluation of agreement at > 0.886.
Table 3 presents the evaluation of agreement among the physical models, scanned digital models, and CBCT scan models using the ICC. The three different study model modalities exhibited an excellent evaluation of agreement for both the anterior and overall Bolton ratios at > 0.970.
DISCUSSION
Several studies have examined and confirmed the clinical accuracy of digital 3D models compared to traditional physical models for specific measurements such as mesiodistal tooth width, arch width, and length.6111214 A previous study using the same 3D digital model scanner and software used by Kim et al.12 found that the discrepancy in the mesiodistal tooth width ranged from 0.0758 mm to 0.1410 mm; the authors suggested that this difference was low enough to be clinically acceptable. The present study suggests that the discrepancy in the mesiodistal tooth width measurement between physical and scanned digital models produces no clinically relevant differences in the anterior or overall Bolton ratios.
We observed a mean difference of 0.41 ± 0.305% in the overall Bolton ratios and 0.59 ± 0.520% in the anterior Bolton ratios between the physical and scanned digital models. This result is comparable to those of similar studies.1516 The largest percentage discrepancy of the overall Bolton ratios found between the digital and physical models was 1.31%, as compared to the considerably lower mean discrepancy of 0.41%. The highest percentage discrepancy was calculated to be 1.43 mm. This value is lower than the value (1.5 mm) suggested by Proffit17 to be clinically significant, demonstrating that all of the presented discrepancy values between the scanned digital models and the physical models in this study were clinically insignificant. In addition, the high intraclass correlations (0.970 for the anterior and 0.976 for the overall Bolton ratios) demonstrate excellent agreement among the scanned digital models, physical models, and CBCT scans.18
The discrepancies in Bolton ratios between the CBCT images and both the physical and digital models were higher than the discrepancy between the digital and physical models (Table 2). In fact, the largest overall Bolton ratio differences between the scanned digital models and CBCT images (1.92 mm) and between the physical models and CBCT images (2.34 mm) exceeded the clinically significant 1.5-mm discrepancy17 and even exceeded the 2.2-mm variance found by Shellhart et al.19 However, it is critical to note that most of the discrepancies between the CBCT images and the physical and scanned digital models were lower than the clinically significant 1.5 mm.
This result was expected because CBCT images are produced by direct imaging, whereas physical and digital models include errors associated with the alginate impression and physical model production stages.1216 Kim et al.,12 using the same Ortho Insight 3D scanner and software system, reported similar results for arch width, arch length, and mesiodistal tooth width, demonstrating that CBCT image results deviate relatively far from measurements obtained from scanned digital models and physical models. Interestingly, the intraexaminer difference for CBCT scans reported by Kim et al.12 was comparable to that for scanned models and physical models, while in this study the intraexaminer difference for CBCT scans was relatively higher than for the other two modalities. The software used to visualize CBCT scans in this study allows for highly detailed 3D images of the dental structure and thus can be very effective in locating landmarks precisely and determining distances between landmarks. CBCT images have already been proven to yield highly accurate measurements.8 However, CBCT software often provides very highly detailed images of orofacial structures but fails to allow the examiner to conveniently focus on the overall image of the dental structures and the surrounding oral tissue. In contrast, digital and physical models present dental and tissue structures while more conveniently depicting general relationships of all of the structures, allowing the examiner to measure multiple mesiodistal tooth widths for Bolton analysis with greater reproducibility. Moreover, physical and digitally scanned models are more familiar to examiners performing Bolton analyses. Nevertheless, the intraexaminer reliability demonstrates an excellent agreement for all three modalities for both the anterior and overall Bolton ratios (> 0.858), as shown in Table 1. Scanned digital models exhibit the highest intraexaminer reliability among the three modalities, with ICC scores of 0.981 for the anterior Bolton ratios and 0.977 for the overall Bolton ratios. These scores correspond to the intraexaminer reproducibility results reported by Naidu and Freer.15 In scanned digital models, Bolton analysis is automated by Ortho Insight 3D software during the digitization stage; in the other modalities, the examiner manually identifies the two landmarks for maximal mesiodistal tooth width. The software measuring mesiodistal tooth width frequently requires only minor modification by the examiner, resulting in the high reproducibility suggested by the high ICC score.
Despite providing clinically acceptable diagnostic records111215 and greater convenience for clinicians, scanned digital models still present some practical limitations for use in orthodontic settings. Scanning existing models, which large clinics and institutions may possess in great numbers, can be a slow and tedious process.12 In addition, Naidu and Freer15 explain that the learning curve and many different visualization features of the software may introduce measurement inaccuracies. New scanning products and software introduced to the market should continue to be investigated to determine their clinical accuracy and reliability. Several studies have reported clinically acceptable Bolton analysis performed with OrthoCad (Cadent Inc., Carlstadt, NJ, USA),1520 and Nalcaci et al.21 concluded that Bolton analysis performed with Ortho 3D Models (O3DM; ORTHOLAB, Sp, ZO.o., Częstochowa, Poland) can be reliably used in the clinical setting. The present study is the first to verify the clinical accuracy of Bolton analysis using the Ortho Insight 3D system. Unlike scanned digital models, CBCT images deliver abundant diagnostic information regarding bone levels, root positions, and temporomandibular joint status, as suggested by Kau et al.22 The present study suggests that clinicians using both scanned digital models and CBCT images for orthodontic diagnosis and analysis can be reassured that the Bolton analysis has high correlation between modalities. This finding may prevent measurements from being repeated unnecessarily.
CONCLUSION
Bolton analysis can be accurately and reliably performed in scanned digital models using the Ortho Insight 3D system. The present study shows that laser scanned digital models have high correlation with physical models (gold standard) and CBCT scans in assessing the spatial relationship of dental arches for orthodontic diagnosis.


 XML Download