Abstract
Objective
To quantify, for each activation, the effect of preactivations of differing distribution and intensity on the neutral position of T-loops (7-mm height), specifically the horizontal force, moment to force (M/F) ratio, and load to deflection ratio.
Methods
A total 100 loops measuring 0.017 × 0.025 inches in cross-section were divided into two groups (n = 50 each) according to composition, either stainless steel or beta-titanium. The two groups were further divided into five subgroups, 10 loops each, corresponding to the five preactivations tested: preactivations with occlusal distribution (0°, 20°, and 40°), gingival distribution (20°), and occlusal-gingival distribution (40°). The loops were subjected to a total activation of 6-mm with 0.5-mm iterations. Statistical analysis was performed using comprised ANOVA and Bonferoni multiple comparison tests, with a significance level of 5%.
Results
The location and intensity of preactivation influenced the force intensity. For the M/F ratio, the highest value achieved without preactivation was lower than the height of the loop. Without preactivation, the M/F ratio increased with activation, while the opposite effect was observed with preactivation. The increase in the M/F ratio was greater when the preactivation distribution was partially or fully gingival.
"While the control mechanism of tooth movement is essentially biological, it is initiated by the action of a force. Until the movement can be triggered by a pharmacological action, the orthodontist will always be bound to the mechanical." This statement in 1959 by Weinstein and Haack1 remains true through the present day. Beginning in the 1940s, orthodontists such as Tweed and Strang have advocated dental extraction as a therapeutic alternative. This approach addressed certain mechanical needs, namely space closure.2 Spaces are closed using sliding mechanics. However, the effectiveness of the maneuver depends on the coefficient of friction of the wire relative to the bracket slot. Alternatively, movement can be achieved with orthodontic loops or frictionless systems.3
When an orthodontic loop is activated, the clinician has control over three variables that determine successful tooth movement: the moment-to-force ratio (M/F), the force and moment magnitudes, and the consistency of these forces.4 The M/F ratio determines how the tooth moves, that is, where the center of rotation is located. The quantitative clinical response is determined by the other two factors of the force system, namely the magnitude and consistency of the forces.5 The mean tooth dimensions and occlusal plane inclinations are correlated, and the bracket distance/center of resistance and the M/F ratio for translational movement in a single tooth or group of teeth varies between 7.1 and 10.2 mm.6 Loop activation, without preactivation bends, results in a low M/F ratio that is less than the vertical dimension of the loop itself.3
Braun and Garcia7 stressed that both the addition of preactivation bends and their occlusal and gingival distribution alters the neutral position of a loop. Neutral position is defined as the horizontal separation of the loop's uprights without applying horizontal force during bracket placement. In the absence of preactivation, activation can be easily quantified by measuring the space between the loop's uprights. This advantage was cited by Siatkowski8 for the Opus loop and confirmed with the finite element method by Techalertpaisarn and Versluis.9 However, to achieve a satisfactory M/F ratio, the loop must have a 10-mm vertical dimension, which is often not clinically feasible.
Burstone and Koenig3 stated that decreasing the horizontal length of the loop geometry occlusally and increasing it gingivally both significantly contributed to an increased M/F ratio. Given these observations, the T-loop with a 7-mm vertical dimension has been examined in several studies.710111213141516 When preactivation bends are combined, the loop's M/F ratio can increase to a vertical dimension compatible with clinical reality. However, when bends are added, activation cannot be quantified through direct measurement of the space between the uprights.78171819202122 Predictions obtained through computer software on the mechanical behavior of loops may differ from the clinical reality. This may occur because of errors in the computer simulation that are mainly due to various simplifications of the theoretical method applied. These simplifications are deemed necessary to produce results in a reasonable time period and because our current knowledge of the materials precludes adequate modeling of complex phenomena such as strain hardening, plastic deformation, and crystal imperfections, which all occur during the mechanical setup.23
The present work aims to apply an experimental method to measure the effects each activation has on the distribution and magnitude of the horizontal force, M/F ratio, and load to deflection ratio (L/D) in the alpha (α) position for different preactivations in a 7-mm high T-loop. Furthermore, we intend to interpret the neutral position by visualizing the different preactivation effects on the loop shape with computer software using the experimental data obtained. This was made to facilitate the perception of the amount of clinical activation, depending on the preactivation bends when using the orthodontic loops.
The sample population comprised 100 T-shaped loops manufactured from one of two different metal alloys, each T-loop measuring 7-mm high with a 10-mm horizontal gingival length (Figure 1A). The 100 loops were divided into two equal-sized groups according to the alloy composition. The groups were further subdivided into five subgroups containing 10 loops each in order to test the five preactivation types.
Stainless steel (Orminox®; Ormco Corp, Glendora, CA, USA) and beta-titanium (TMA®; Ormco Corp) metal alloys measuring 0.017 × 0.025 inches in cross-section were used.
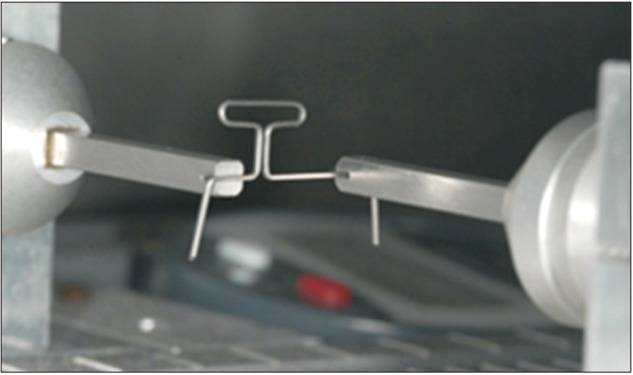
Mechanical testing was conducted using the OrthoMeasure Moment/Force measurement apparatus (Orthomeasurments®; Division of Young Research & Development, Avon, CT, USA), which is able to measure forces up to 500 gram-force (gf) and moments up to 3,000 gf·mm, with an 1% accuracy for both magnitudes, and sensitivities of 1 gf for force and 10 gf·mm for the moment. The apparatus includes a terminal connected by cable to a handpiece that is attached to a metal bar with a 0.018-slot (Figure 1B). The force and moment values of the wire, which is inserted into the slot at one end of the loop, are read on the terminal using two digital displays. The handpiece connected to the terminal is placed at the alpha end. A second handpiece attached to the metal bar with a 0.018 slot serves as the beta end for fixation to the opposite end of the loop.
The purpose-built test board (Figure 1B), which is used for mechanical testing, has two platforms with support systems for the handpieces. The board enables movement independent of the platforms with the direction of movement between them being specifically orthogonal.
A digital comparator (MarCator®; Mahr GmbH, Esslingen, Germany) coupled to the test board was used to quantify the movement recorded by the platform at the beta end of the handpiece. The apparatus registers movements from 0.01 mm to 12.7 mm, with a 0.01-mm sensitivity.
The loops were made manually by a single operator using Tweed (012-350-00 Dentaurum®; Dentaurum GmbH & Co. KG., Ispringen, Germany) and 139 (AEO 8010414 AEZ®; Ormco Corp., Glendora, CA, USA) pliers. The T-loops were manufactured from designs provided by the LOOP computer program (dHAL Orthodontic Software, Athens, Greece), which served as the standard reference models.
In the five preactivations tested, the preactivation bends can be inserted at four different locations, indicated in Figure 2A. Accuracy of the bends was calculated and plotted by the LOOP program, and the resulting geometries were used as standard reference models.
The 0° preactivation corresponds to the non-insertion of any preactivation (Figure 2A). The 20° preactivation was done by performing a 10° insertion at bends 1 and 2 (Figure 2B). The 40° preactivation was done by performing a 20° insertion at bends 1 and 2 (Figure 2C). Similarly, the 20°° preactivation was done by performing a 10° insertion at bends 3 and 4 (Figure 2D), and the 40°° preactivation was done by performing a 10° insertion at bends 1, 2, 3, and 4 (Figure 2E).
The test board platforms were then positioned with a 13-mm distance between the two handpieces of the OrthoMeasure apparatus and the 0.018-inches bracket slots oriented collinearly. In this state, the digital comparator was calibrated to 0 mm.
The mechanical testing comprised three phases.
Phase 1: Insertion of the loop into the slots, equivalent to a 0-mm activation in the table platforms (Figure 3).
Phase 2: Initial 1-mm activation, followed by activations at 0.5-mm iterations. The values of each activation were measured at the beta position by the digital comparator.
Phase 3: Force and moment calculations for each recorded activation.
The maximum activation was limited to values less than 6 mm in activations where the horizontal force or moment was higher than 300 gf or 3,000 gf·mm, respectively. Three activation cycles were repeated for every loop at different times and 24-hour intervals.
The data were analyzed with IBM® SPSS® Statistics ver. 22.0 (IBM Co., Armonk, NY, USA). Profile plots for the mean values (M) and respective 95% confidence intervals were drawn to illustrate the variation in the mean for the dependent variables. Given the scale measure of the involved variables, analysis of variance (ANOVA) was performed to measure the effects of various factors (preactivation, apparatus, and activation) on the dependent variables (force, M/F, and L/D). When significant differences were detected, the multiple comparison test (Bonferroni test) was performed for the different levels of preactivation. Statistical significance was defined as a probability value less than 0.05.
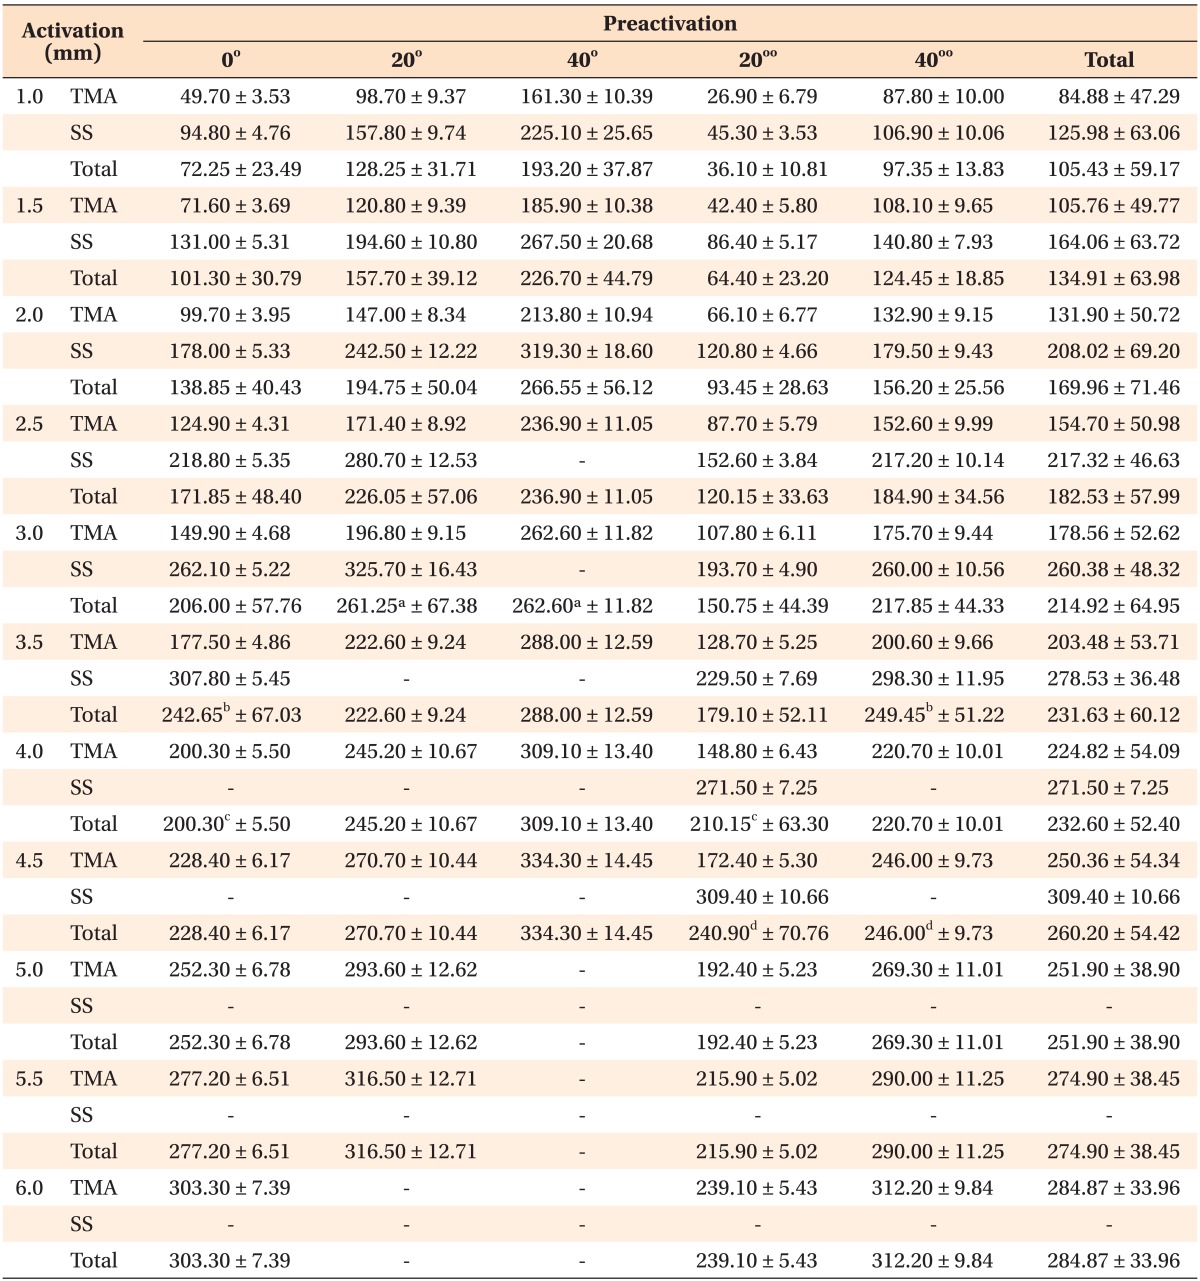
The mean and standard deviation of the force variable (gf) for activation and preactivation in both materials are presented in Table 1.
The analysis of the mean force in the various material and preactivation combinations showed that in all cases at a single level of activation, steel produced higher values than beta-titanium (TMA). For each activation iteration, the mean force showed a gradual increase. Consistent with these results, the lowest mean force was observed during the initial activation for TMA at 26.90 gf for the 20°° preactivation.
The preactivation with gingival distribution generated the lowest mean force, followed in ascending order by the loop with 0° preactivation. The mean force exhibited an increasing trend as the preactivation bends in the occlusal distribution increased from 20° to 40°. In the 40° preactivation, the force values were higher than those in the 0° preactivation but less than those in the 20° preactivation.
The highest recorded mean force value cannot be inferred in absolute terms due to the present study design. The first combination to reach the boundary conditions of the study was the 40° preactivation in steel at the third activation (2 mm), with 319.30 gf of force.
The mean force values and their respective 95% confidence intervals are illustrated in Figure 4. There was no statistically significant differences (Table 1) at the 3-mm activation between the 20° and 40° preactivations (a), at the 3.5-mm activation for the 0° and 40°° preactivations (b), at the 4-mm activation for the 0° and 20°° preactivations (c), and at the 4.5-mm activation for the 20°° and 40°° preactivations (d).
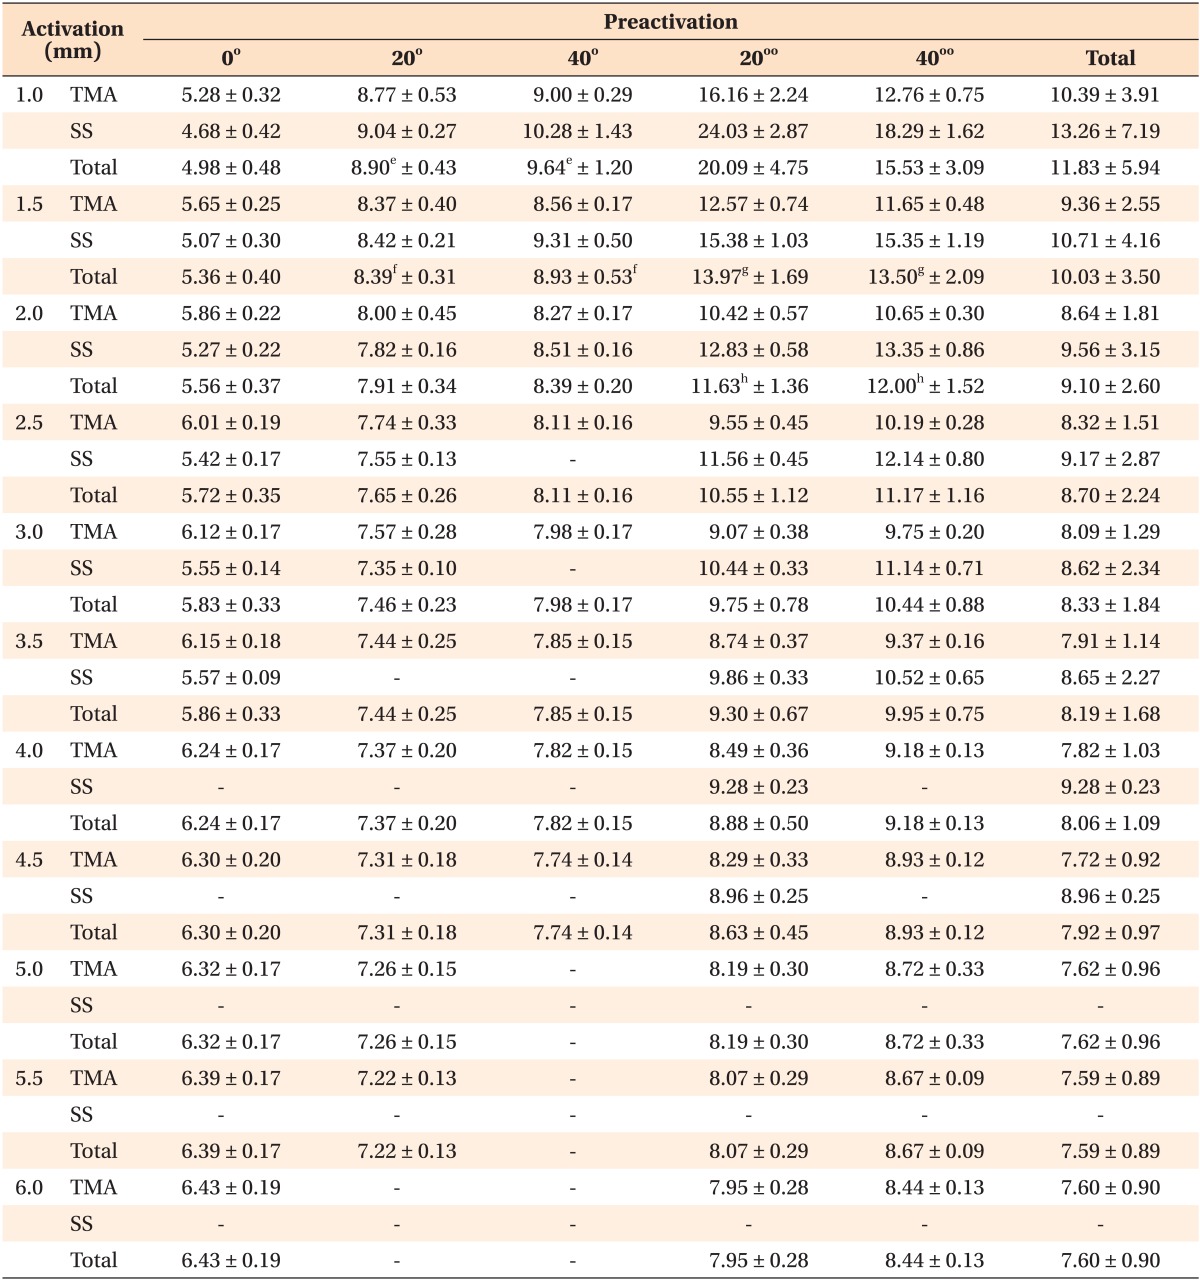
The mean and standard deviation of the M/F (mm) for the activations and preactivations in both materials are presented in Table 2.
The 0° preactivation showed an M/F ratio of less than 7 mm (vertical dimension). The highest M/F ratio was 6.43 mm for the TMA loop with a 6-mm activation, and the lowest value was 4.68 mm, recorded in the initial activation of the steel loop. The M/F ratio consistently increased as the activation increased.
When combined with preactivation, the M/F ratio decreased as the activation increased, and was higher for steel than for TMA. The highest M/F ratio values occurred in the 20°° preactivation, with a maximum of 24.03 mm for the steel loop at the 1-mm activation. At a 2-mm activation, the 40°° preactivation showed slightly higher values than the 20°° preactivation.
The M/F ratio values for the 20° and 40° preactivations were lower than those for the 20°° and 40°° preactivations. The additional 20° preactivation present in the 40° preactivation resulted in an increased M/F ratio. The minimum M/F ratio was 7.35 mm, which was higher than the vertical dimension, for the steel loop with a 20° preactivation and 3-mm activation.
The mean M/F ratio values and their respective 95% confidence intervals are illustrated in Figure 5.
As shown in Table 2, there were no statistically significant differences for the combined activations of 1 mm with 20° and 40° preactivations (e), 1.5-mm activation with 20° and 40° preactivations (f), and both 1.5 (g) and 2-mm (h) activations with 20°° and 40°° preactivations.
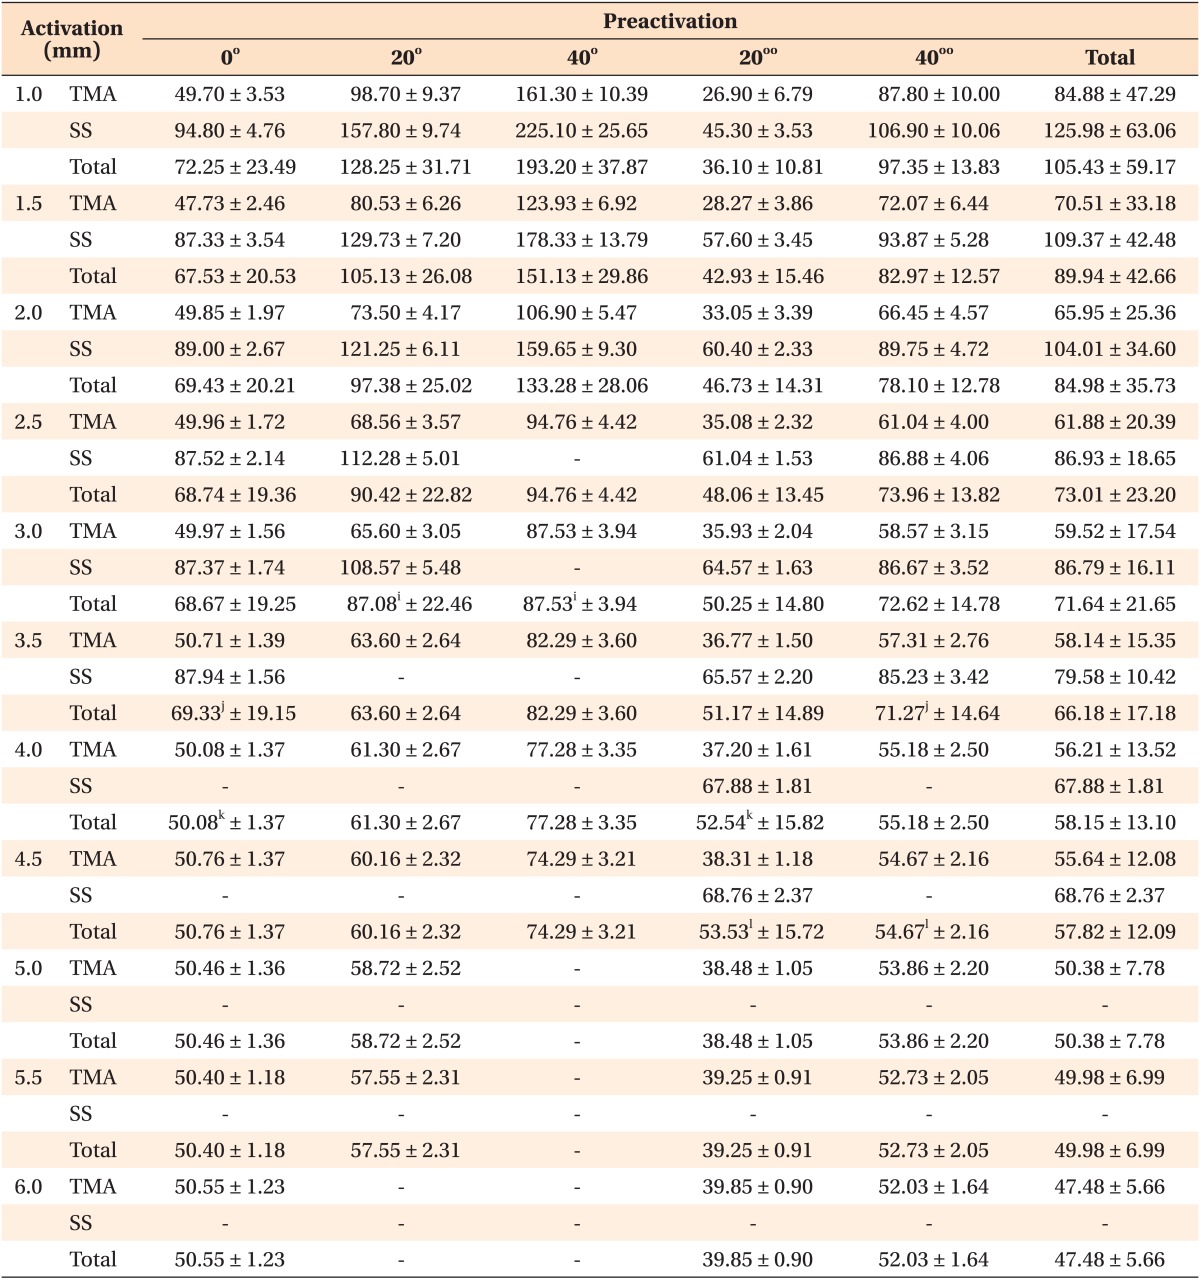
The mean and standard deviation of the L/D ratio (gf/mm) for the combined activations and preactivations in both materials are presented in Table 3.
Among the different material combinations with a fixed preactivation, steel always produced higher L/D values than TMA. The combinations with added preactivation bends in the occlusal distribution showed a corresponding rise in the L/D ratio. For each preactivation, the L/D ratio decreased as the activation increased. In each material, an increase in the preactivation from 20° to 40° resulted in a mean increase in the L/D ratio of 32% to 36%.
During activation, the L/D ratio decreased for preactivations with total or partial occlusal distribution. In the 20° preactivation with gingival distribution, the L/D ratio increased with activation, but the percent increase with each iteration was small. The mean L/D ratio values and their respective 95% confidence intervals are illustrated in Figure 6.
As shown in Table 3, no significant differences (p > 0.05) were observed for the 3-mm activation with 20° and 40° preactivations (i), 3.5-mm activation with 0° and 40°° preactivations (j), and the 4-mm activation with both the 0° and 20° preactivations (k) and with 20°° and 40°° preactivations (l).
The 13-mm interbracket distance is equivalent to the mean distance separating the two brackets contiguous to the extraction space of a premolar.8 The loop position in the present study, 2 mm from the anterior (alpha) bracket (also proposed by Viecilli21), is between the 1.5 mm proposed by Siatkowski8 and the 3 mm proposed by Ferreira et al.24
As stated by Burstone and Koenig,25 the asymmetric positioning of the loop in the inter-bracket distance closer to alpha defines the force system as an asymmetric V bend. For the moment, it is known that an inferior intensity moment is registered in beta rather than being verified in alpha. A moment with relatively high values in alpha is preferred for generating an M/F ratio compatible with the translation movement. Regarding the vertical force, the force developed in alpha is identical to the force verified in beta, but with opposite directions. Quantification of the vertical force in alpha (a limitation of the OrthoMeasure Moment/Force measurement apparatus) and the forces system developed in beta were beyond the scope of this study. However, the effect of both should be considered in clinical practice. Although outside of the scope of this study, if the loop position is altered in a manner allowing the moment to be measured in beta , then the resulting value will allow determination of all force systems by applying the equilibrium system as demonstrated by Siatkowski.6
The measured forces for the TMA loop without preactivation in the present study are comparable with the values reported by Manhartsberger et al.,13 differing only 4% at most. This comparison is possible because both loops shared identical dimensions, composition, and manufacturer, and a horizontal force was not produced in the neutral position. Differing properties between identical materials produced by different manufacturers has been reported by some investigators.2627
In theory, when a T-loop without a preactivation bend is activated below the elastic limit, the M/F ratio remains nearly unchanged. However, in the present study, consistent with findings by Rose et al.22 and Chen et al.,10 we verified that the M/F ratio does increase with activation. Shimizu et al.15 observed an increase in the M/F ratio initially during activation and a decrease in the final activations, though the values remained higher than those observed initially. Data collected by Chen et al.10 also showed a decrease in the M/F ratio with activation. The variation in the M/F ratio for loops without preactivation in the current findings contradicts previous reports. However, in all of the prior studies, the amplitude of the M/F values was less than 1 mm, and the values always remained below the vertical dimension of the tested loop. This variation may reflect complex phenomena such as strain hardening, plastic deformation, and crystal imperfections, which all occur in the mechanical setup.23
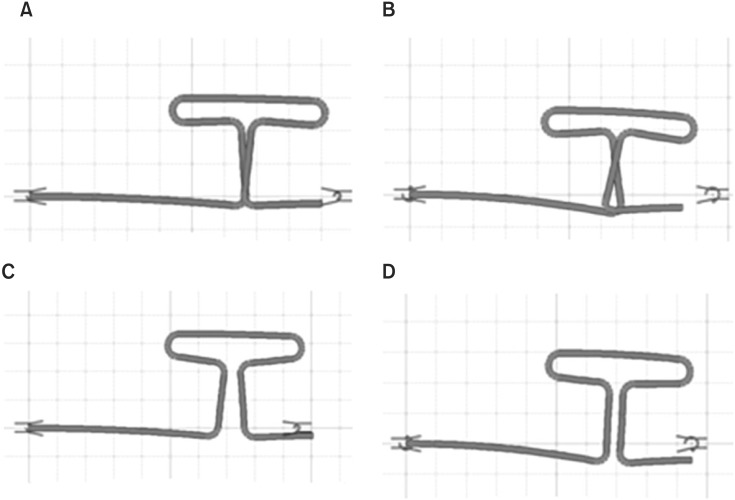
The variation in the distribution of preactivation bends has different effects on the shape of the loop in the neutral position, which has been indicated in previous reports.3781417192023 The simulated neutral position can be viewed using the "Apply Moment" function of the LOOP computer program, which is shown in Figure 7. This function enables one to verify the effect of preactivation on the loop shape when in the neutral position. The LOOP computer program also allows measurement of the moment and force variables. Although the force variable was not broken into its vertical and horizontal components, this does not affect the present results because the program was only used for its graphic potential in designing and simulating the loops.
In occlusal preactivation, the horizontal dimension of the loop was shortened, and this reduction led to an increase in the horizontal force (Figure 7A and 7B). In occlusal preactivations for the 1-mm activation, displacement of the uprights was always greater than 1 mm. The distance observed between the uprights was 1 mm, but in reality, during phase 1, displacement occurred due to prior uncrossing of the uprights, which is a factor to be considered clinically.
In gingival preactivation, the horizontal dimension increased, consistent with reports by Braun and Garcia7 and Halazonetis.20 In fact, when the force results were compared, the completely gingival preactivation (20°°) generated the lowest force values of all the combinations. In clinical practice, the use of preactivation without activation will tend to cause the gape to open, which can be inferred from Figure 7C. In the 40°° preactivation (gingival and occlusal preactivation) the effect was distributed, but with some shortening. When the forces were compared between loops with 40°° preactivation and those without preactivation, the values were higher for the 40°° preactivation.
The total distribution of the gingival preactivation results showed an increased moment and decreased horizontal force. By contrast, in the distribution for occlusal preactivation, both the moment and horizontal forces increased, consistent with previous data.38141721 The combination of 20° of gingival preactivation with 20° of occlusal preactivation resulted in a higher M/F ratio than the M/F ratio for the 20° occlusal preactivation alone. This trend was not observed when the M/F ratio was compared between the 20° (20°°) gingival preactivation and the summed preactivations lower than the gingival preactivation (20°°). This decrease resulted from the increased horizontal force within the ratio relative to the change in the moment.
For the L/D ratio during activation, the preactivations with partial or total occlusal distribution decreased as a result of the high force in initial activation. In the case of 20°° preactivation (gingival distribution), the L/D ratio increased because in the initial activation, the force displayed corresponds to a lower true activation. Thus, the numerator in the ratio is reduced.
The problem highlighted by Siatkowski8 concerning the difficulty of quantifying the force and moment due to the insertion of preactivation bends is solved by analysis of the T-loop conditions in the present study. When bends are added, activation cannot be quantified through direct measurement of the space between the uprights. The simulation with the LOOP computer program helps in understanding this effect as it occurs in clinical practice. Activations that simultaneously show an orthodontic force range of 150-300 gf18 and a M/F ratio between 7 and 11 mm6 correspond to biomechanical behavior. Activations within this range are clinically significant because they represent a good compromise between the force and M/F ratio.
The combination showing the best clinical compromise between the force and M/F ratio was the TMA T-loop with 40° preactivation for activation values between 1 mm and 4 mm. For this activation range, the force values are between 161.3 gf and 309.1 gf, and the M/F ratio is between 7.82 mm and 9 mm.
We confirmed that the preactivation location influences the force intensity. The highest value achieved without preactivation was lower than the vertical dimension of the loop. Without preactivation, the M/F ratio increased upon activation, while the opposite effect was observed when preactivation was present. In most activations, preactivation bend insertion resulted in higher values for steel compared with TMA. The increase in the M/F ratio observed with the insertion of preactivation bends was highest when the location of the bends was partially or fully gingival. For the L/D ratio, a small decrease or increase of the L/D ratio occurred as the level of activation increased, depending on the preactivation present, which confirms the elastic behavior of all the loops tested.
References
1. Weinstein S, Haack DC. Theoretical mechanics and practical orthodontics. Angle Orthod. 1959; 29:177–181.
2. Vaden JL, Dale JG, Klontz HA. Aparato arco de canto de Tweed-Merrifield: filosofia, diagnóstico y tratamiento. In : Restrepo GAU, editor. Ortodoncia principios generales y técnicas. 3rd ed. Buenos Aires: Editorial Médica Panamericana S.A;2003. p. 625–682.
3. Burstone CJ, Koenig HA. Optimizing anterior and canine retraction. Am J Orthod. 1976; 70:1–19. PMID: 1066042.

4. Burstone CJ. The mechanics of the segmented arch techniques. Angle Orthod. 1966; 36:99–120. PMID: 5218678.
5. Smith RJ, Burstone CJ. Mechanics of tooth movement. Am J Orthod. 1984; 85:294–307. PMID: 6585147.

6. Siatkowski RE. Force system analysis of V-bend sliding mechanics. J Clin Orthod. 1994; 28:539–546. PMID: 8617838.
7. Braun S, Garcia JL. The Gable bend revisited. Am J Orthod Dentofacial Orthop. 2002; 122:523–527. PMID: 12439481.

8. Siatkowski RE. Continuous arch wire closing loop design, optimization, and verification. Part II. Am J Orthod Dentofacial Orthop. 1997; 112:487–495. PMID: 9387834.

9. Techalertpaisarn P, Versluis A. Mechanical properties of Opus closing loops, L-loops, and T-loops investigated with finite element analysis. Am J Orthod Dentofacial Orthop. 2013; 143:675–683. PMID: 23631969.

10. Chen J, Markham DL, Katona TR. Effects of T-loop geometry on its forces and moments. Angle Orthod. 2000; 70:48–51. PMID: 10730675.
11. Kuhlberg AJ, Burstone CJ. T-loop position and anchorage control. Am J Orthod Dentofacial Orthop. 1997; 112:12–18. PMID: 9228836.

12. Maia LG, de Moraes Maia ML, da Costa Monini A, Vianna AP, Gandini LG Jr. Photoelastic analysis of forces generated by T-loop springs made with stainless steel or titanium-molybdenum alloy. Am J Orthod Dentofacial Orthop. 2011; 140:e123–e128. PMID: 21889060.

13. Manhartsberger C, Morton JY, Burstone CJ. Space closure in adult patients using the segmented arch technique. Angle Orthod. 1989; 59:205–210. PMID: 2774296.
14. Marcotte MR. Mecânica em Ortodontia. In : Marcotte MA, editor. Biomecânica em ortodontia. 2nd ed. São Paulo: Livraria Santos Editora;2003. p. 1–21.

15. Shimizu RH, Sakima T, Pinto AS, Shimizu IA. Desempenho biomecânico da alça "T", construída com fio de aço inoxidável, durante o fechamento de espaços no tratamento ortodôntico. R Dental Press Ortodon Ortop Facial. 2002; 7:49–61.
16. Souza RS, Pinto AS, Shimizu RH, Sakima MT, Gandini LG. Avaliação do sistema de forças gerado pela alça T de retração pré-ativada segundo o padrão UNESP-Araraquara. R Dental Press Ortodon Ortop Facial. 2003; 8:113–122.
17. Siatkowski RE. Continuous arch wire closing loop design, optimization, and verification. Part I. Am J Orthod Dentofacial Orthop. 1997; 112:393–402. PMID: 9345151.

18. Thiesen G, Shimizu RH, do Valle CV, do Valle-Corotti KM, Pereira JR, Conti PC. Determination of the force systems produced by different configurations of tear drop orthodontic loops. Dental Press J Orthod. 2013; 18:19.e1–19.e18. PMID: 23916447.

19. Braun S, Sjursen RC Jr, Legan HL. On the management of extraction sites. Am J Orthod Dentofacial Orthop. 1997; 112:645–655. PMID: 9423697.

20. Halazonetis DJ. Understanding orthodontic loop preactivation. Am J Orthod Dentofacial Orthop. 1998; 113:237–241. PMID: 9484213.

21. Viecilli RF. Self-corrective T-loop design for differential space closure. Am J Orthod Dentofacial Orthop. 2006; 129:48–53. PMID: 16443478.

22. Rose D, Quick A, Swain M, Herbison P. Moment-to-force characteristics of preactivated nickel-titanium and titanium-molybdenum alloy symmetrical T-loops. Am J Orthod Dentofacial Orthop. 2009; 135:757–763. PMID: 19524835.

23. Caldas SG, Martins RP, Galvão MR, Vieira CI, Martins LP. Force system evaluation of symmetrical beta-titanium T-loop springs preactivated by curvature and concentrated bends. Am J Orthod Dentofacial Orthop. 2011; 140:e53–e58. PMID: 21803234.

24. Ferreira Mdo A, de Oliveira FT, Ignácio SA, Borges PC. Experimental force definition system for a new orthodontic retraction spring. Angle Orthod. 2005; 75:368–377. PMID: 15898375.
25. Burstone CJ, Koenig HA. Force systems from an ideal arch. Am J Orthod. 1974; 65:270–289. PMID: 4521361.

26. Ingram SB Jr, Gipe DP, Smith RJ. Comparative range of orthodontic wires. Am J Orthod Dentofacial Orthop. 1986; 90:296–307. PMID: 3464191.

27. Odegaard J, Meling T, Meling E. The effects of loops on the torsional stiffnesses of rectangular wires: an in vitro study. Am J Orthod Dentofacial Orthop. 1996; 109:496–505. PMID: 8638594.
Figure 1
A, Schematic representation of the T-loop and respective dimensions (mm). The front end of the loop is indicated by alpha (α), while beta (β) indicates the rear end of the loop. B, Test board: The OrthoMeasure Moment/Force/digital comparator (Orthomeasurments®; Division of Young Research & Development, Avon, CT, USA) was used to quantify the horizontal forces.
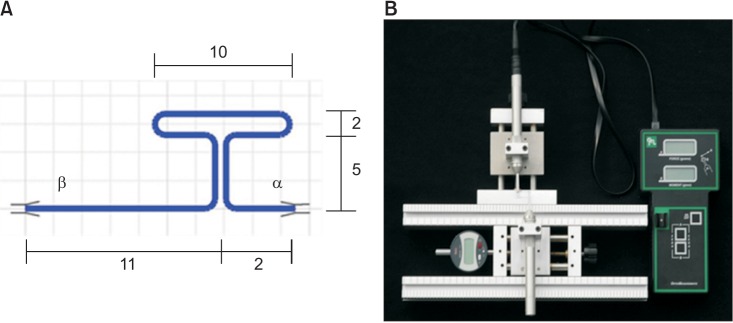
Figure 2
Schematic representation of the T-loop activation for each group. A, Numerical identification of the four bend locations; B, schematic representation of the T-loop with 20° preactivation (10° insertion in bends 1 and 2); C, 40° preactivation (20° insertion in bends 1 and 2); D, 20°° preactivation (10° insertion in bends 3 and 4) ; E, 40°° preactivation (10° insertion in bends 1, 2, 3, and 4).
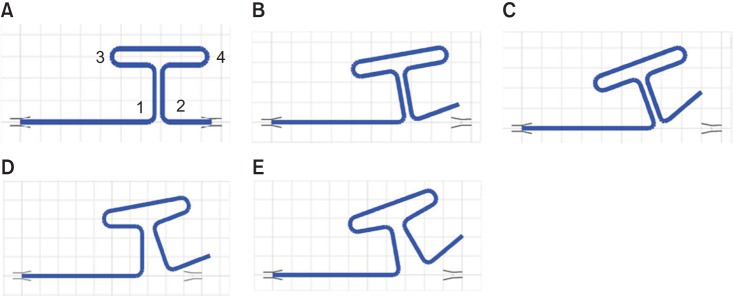
Figure 4
Mean force values and 95% confidence intervals (CI) for activation and preactivation in each material (beta-titanium [TMA] and stainless steel [SS]).
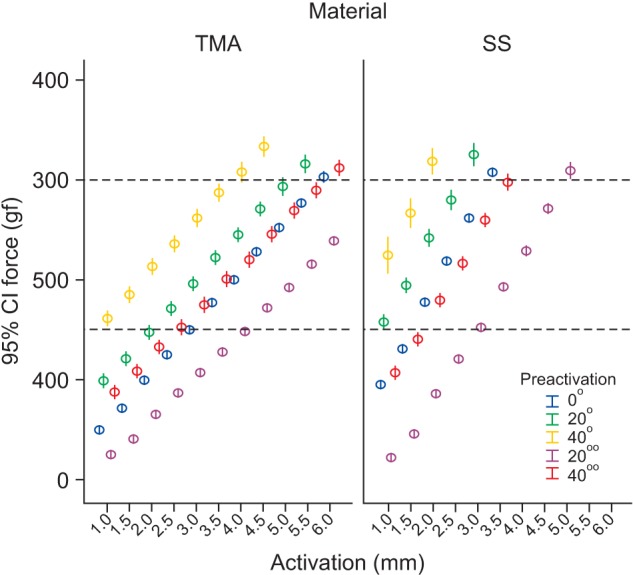
Figure 5
Mean moment to force (M/F) ratio values and 95% confidence intervals (CI) according to activation and preactivation in each material (beta-titanium [TMA] and stainless steel [SS]).
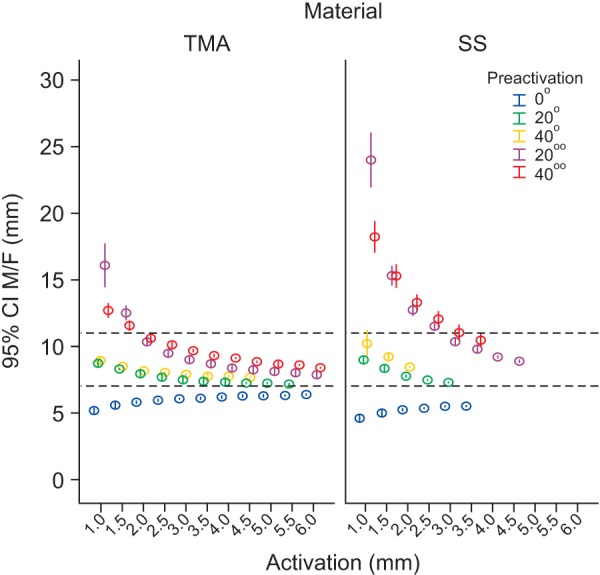
Figure 6
Mean load to deflection (L/D) ratio values and 95% CI by activation according to preactivation values for each material (beta-titanium [TMA] and stainless steel [SS]).
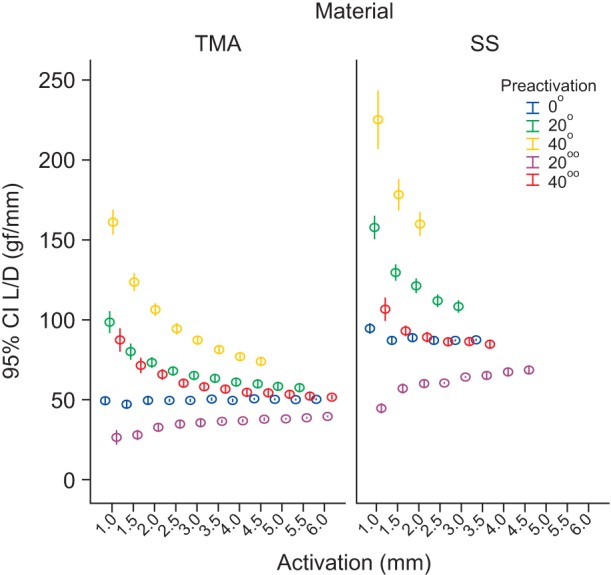
Figure 7
Schematic representation of the T-loop generated by the LOOP computer program (dHAL Orthodontic Software®, Athens, Greece). A, 20° activation/Apply Moment (neutral position); B, 40° activation/Apply Moment (neutral position); C, 20°° activation/Apply Moment (neutral position); D, 40°° activation/Apply Moment (neutral position).


 PDF
PDF ePub
ePub Citation
 Print
Print


 XML Download