

 PDF
PDF ePub
ePub Citation
 Print
Print


INTRODUCTION
Molar occlusal relationships are evaluated from the buccal aspect. However, this common practice becomes irrelevant when determining the lingual cusp sitting position of the maxillary molar on the mandibular molar.1,2 The importance of this goal is described by many researchers, including Wheeler,2 who emphasized the necessity of seating the lingual cusp of the maxillary molar in the central fossa of the mandibular first molar. In addition, the guidelines of the American Board of Orthodontics (ABO) highlight the role of molar and premolar lingual cusp occlusal contact on the opposing teeth.3 Furthermore, Fotis et al.4 speculated that good occlusal contact and intercuspation may be the keys to achieving stable results in orthodontic treatment.
The lingual cusp of the maxillary molar is seated on the central fossa of the mandibular molar in a class I molar relationship. In contrast, the lingual cusp of the maxillary molar is even with or anterior to the mandibular molar in a class II molar relationship. In general, class I molar relationships have improved posterior occlusal function than class II molar relationships. Jang et al.5 found that the half cusp class II relationship is more functional than the full cusp class II relationship from the lingual aspect because the palatal cusp in the half cusp class II relationship is seated on the central fossa of the lower molar, while the palatal cusp in the full cusp class II relationship is seated on the marginal ridge of the lower molar.
Occlusal force and contact areas are measured to ascertain occlusion function. For instance, Gibbs et al.6 measured the occlusal force by transmitting sound vibration to the chin, which transferred the vibration through the teeth, temporomandibular joint (TMJ), and muscle pathways. Additionally, Yoon et al.7 used the Dental Prescale System (Dental Prescale® 50H, typeR; Fuji Film Corp., Tokyo, Japan) to measure the occlusal force from the occlusal relationship, skeletal pattern, age, and sex in Koreans. In general, the occlusal area is measured by the number or surface area of contacts. By determining the occlusal contact area before and after orthodontic treatment, analysis of the functional aspect of a patient's occlusion can be supported. Yurkstas and Manly8 determined the occlusal contact area by passing light through the occlusal wax registration in a cylinder containing a light bulb and two photovoltaic cells. However, the brightness and amount of light passing through could lead to some measurement errors. Previously, maximal bite force was measured using metal materials, such as a transducer, biting fork, or bite force dynamometer of various sizes and thicknesses. The thickness (4-6 mm) could cause lack of stability, and the patient may be reluctant to bite with maximum strength due to fear of tooth damage or pain. Dental Prescale has been used to determine occlusal force and contact area in maximum intercuspation, while T-scan9 has been used to quantify the occlusal contact data by registering parameters such as bite length and the timing and force of tooth contact. However, measuring with Dental Prescale and T-scan can lead to errors because the maximum occlusion of each patient may differ each time the patient bites the films. Therefore, Jang et al.5 introduced a method for measuring the occlusal contact area by using three-dimensional (3D) digital models. However, the molar relationships and occlusal contact areas in class I and II cases have not yet been analyzed using the methods described by Jang et al.5
Therefore, in this study, we aimed to compare class I and II molar relationships by quantifying occlusal contact areas using 3D models as described by Jang et al.5 Our study provided an extension of the investigation by Jang et al.5 by observing the impact of including the occlusal contact area as a factor in creating ideal set-up models. We hypothesized that the occlusal contact area of the class I finishing would be greater than that of the class II finishing despite being equivalent in the ideal set-up model.
MATERIALS AND METHODS
Evaluations were performed for 41 post-orthodontic treatment cases, of which 22 were clinically diagnosed as class I cases, and the remainder were diagnosed as full cusp class II cases. Patients were between 18 and 50 years of age, and the majority of were women. The effects of sex on the cases in this study were not considered as a variable since the results relied heavily on the set-up models designed in preparation for indirect bonding (IDB). Age was also not a variable since only adults were included in the study. The records for 3,300 casts of consecutively screened patients, who attended the Department of Orthodontics, Ewha Womans University Mokdong Hospital (Seoul, Korea) from 1993 to 2012, treated under one supervisor, were collected. The 3,300 cases were narrowed down to 41 based on the following inclusion criteria: patients with complete permanent dentition except third molars; patients treated with the same kind of brackets (018 slot); cases with full model sets, i.e., initial, set-up, and final models; class I or full cusp class II finishing from the buccal view in ideal set-up and final models; for class I finishing, final models and ideal set-up models were class I molar relationships, which showed the same molar relationships at the initial visit and had all four first premolars extracted; for class II finishing, final and ideal set-up models were class II molar relationships, which showed the same molar relationships at the initial visit and had only the maxillary first premolars extracted. Patients with the following were excluded from the study: missing teeth; supernumerary teeth; fractured cusp; molar or premolars for which more than two-thirds of the occlusal surface had been reconstructed; ectopic teeth; anterior or posterior cross bite; TMJ problems; and surgery cases.
The set-up models were ideally fabricated according to the ABO standards to yield final molar relationships as class I or class II finishings. One experienced dental technician, who has been working in an orthodontics laboratory for 15 years, made the ideal set-up models, confirming the consistency of the models.
This study was approved by the Institutional Review Board of Ewha Womans University Mokdong Hospital (approval number ECT13-14A-44).
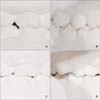
Classification according to final molar relationship (Figure 1)
Cases were classified as class I or II based on the following definitions. Class I finishing was defined as cases in which the mesiobuccal cusp of the upper first molar was in occlusion with the mesiobuccal groove of the lower first molar (initial molar relationship: class I). Class II finishing was defined as cases in which the mesiobuccal cusp tip of the upper first molar was located on the anterior aspect of the mesiobuccal cusp tip of the lower first molar (initial molar relationship: end-on or full cusp class II).
Analysis of the occlusal contact area
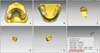
A 3D dental laser scanner (KOD-500; Orapix Co. Ltd., Seoul, Korea; accuracy: ± 20 µm, mode: high-resolution) was used to scan the initial, set-up, and final models. After scanning the models, the 3D images were imported into RapidForm 2004 software (INUS Technology Inc., Seoul, Korea) to measure the occlusal contact areas. This method was selected because it was found to be highly accurate and allow classification of the molar relationships from the lingual view.5
The intersection of the occlusal area of the upper and lower teeth was calculated using the Boolean function.5 The program automatically calculated the intersecting contact area in mm2 (Figures 2 and 3). The measurement of the occlusal contact area was calculated as follows: the occlusal contact area of the posterior segment, based on maxillary teeth, was calculated as the sum of right and left second molars, the sum of right and left first molars, and the sum of right and left second premolars, excluding the first premolar; the occlusal contact area of the individual teeth, based on maxillary teeth, was calculated as the sum of right and left second molars (no. 17 and 27), the sum of right and left first molars (no. 16 and 26), the sum of right and left second premolars (no. 15 and 25).
Statistical analysis
The collected data were processed by computerized statistical analysis using IBM SPSS Statistics software ver. 20.0 (IBM Co., Armonk, NY, USA). Independent t-tests were conducted to determine the differences between class I and II finishings. Repeated measures analysis of variance (ANOVA) was conducted to determine differences for initial, set-up, and final models. Bonferroni tests were used as post-hoc tests. Differences with p-values of less than 0.05 were considered significant.
RESULTS
Comparison of differences according to class I and II finishings
First, we examined differences in occlusal contact areas of the posterior segment according to class I and II finishings (Table 1). We observed a significant difference in the set-up models between class I and class II finishings (p < 0.05 by independent t-test). There were no differences between class I and II finishings in initial and final models.
Next, we analyzed differences in occlusal contact areas of right and left posterior teeth for initial, set-up, and final models according to molar relationships (Table 2). We observed significant differences in upper right and left second molars (no. 17 and 27) and upper right and left first molars (no. 16 and 26) for the set-up models (p < 0.05 by independent t-test). For the final models, there were significant differences in upper right and left second molars (no. 17 and 27; p < 0.05 by independent t-test). However, no differences were observed in the initial models or in the upper right and left second premolars (no. 15 and 25) for all models.
Comparison of differences according to initial, set-up, and final models
Class I finishing
The results of the repeated measures ANOVA according to the models in class I finishing are shown in Table 3. The analysis showed statistically significant differences in the posterior segment, upper right and left second molars (no. 17 and 27), upper right and left first molars (no. 16 and 26), and upper right and left second premolars (no. 15 and 25; p < 0.05 by repeated measures ANOVA). The occlusal contact areas of the initial models were greater than those of the set-up and final models according to the Bonferroni test.
Class II molar relationship
The results of repeated measures ANOVA according to the models in class II finishing are shown in Table 4. There were statistically significant differences in the posterior segment, upper right and left second molars (no. 17 and 27), upper right and left first molars (no. 16 and 26), and upper right and left second premolars (no. 15 and 25; p < 0.05 by repeated measures ANOVA). Occlusal contact areas of the posterior segment of the initial models were greater than those of the set-up and final models according to the Bonferroni test. No differences were observed between the set-up and final models.
DISCUSSION
This study compared the occlusal contact areas of class I and II finishings with initial, set-up, and final models assuming that the occlusal contact area would be higher in class I finishing. We were most interested in comparison of the ideally planned occlusion and the accomplished occlusion. A set-up model was mandatory in this study due to the utilization of IDB and was used for every patient during the planning of the orthodontic treatment for mandatory unified bracketing. The resulting set-up and final models showed similar outcomes in tooth movement. However, we also sought to determine whether the occlusions were similar for both models as an extension of the study by Jang et al.5 We anticipate that our findings from the set-up and final models will underscore the importance of including the patient's occlusal area when planning orthodontic treatment using the set-up model and IDB.
The posterior occlusal contact areas of the set-up models showed statistically significant differences between class I and II finishings. The molar relationship of the set-up model was ideally fabricated in the laboratory into molar class I or full cusp class II relationships. The widely used diagnostic criteria of occlusion classifies the proper class I molar relationship as cases in which the "mesio-buccal cusp of the upper first molar is received in the buccal groove of the lower first molar" and the proper class II molar relationship as cases in which the "lower molar is one-half cusp or more distal of the long axis of the upper cusp."10 Thus, it is reasonable that the posterior occlusal contact area of the class I finishing is larger than that of the class II finishing. Jang et al.5 stated that the mild buccal class II molar relationship, including the end-on class II relationship, can be clinically described as half cusp class II. Additionally, many cases were more similar to buccal class I relationships than severe buccal class II (or full cusp class II) relationships when analyzed from the lingual perspective. Given that the palatal cusp is the functional cusp of the maxillary molar, the functional properties of half cusp class II relationships are similar to those of buccal class I relationships because the maxillary palatal cusp seats into the central fossa of the lower first molars. Jang et al.5 also concluded that the mean occlusal contact area is significantly higher in class I cases than in full class II cases, which could be inferred as having a worse molar relationship from the lingual aspect.
The primary goal in orthodontic treatment is to attain a class I molar relationship. To achieve the ideal molar relationship, the role of the first molar is crucial because the first molar occupies a large portion of the total arch. Angle10 claims that the upper first molar is the key to occlusion, while Hellman11 suggested that it would be better to focus on the position of the upper first molar. In a study of Jang and Lee,12 the occlusal area of the first molar was shown to be the largest (44.1 mm2), while that of the central incisor (2.15 mm2) was shown to be the lowest. Moreover, the occlusal contact areas of the molars were shown to be 4-5 times higher than those of the premolars. Therefore, the higher total occlusal contact area in class I finishing, in which the upper first molars exhibit the ideal position and occlusal contact area, is optimal compared to that of class II finishing.
In our study, we divided the posterior segment into individual teeth based on the maxillary teeth to examine whether the occlusal contact area of individual teeth showed similar results. From this analysis, we found that the molars of the set-up and final models were significantly different in terms of occlusal contact areas for class I and II finishings. In contrast, no differences were observed for the second premolars. The first and second molars may be responsible for the major differences in class I and II finishings. The lingual cusp of the class I finishing showed a cusp-to-fossa relationship from the lingual aspect, and the lingual cusp of the class II finishing showed a cusp-to-marginal ridge relationship. The cusp-to-marginal ridge relationship in both lingual cusps of the class I and II finishings viewed from the lingual aspect may explain the lack of differences in the second premolars.
We also found that the initial occlusal contact area of the models was greater than those of the set-up and final models. The initial occlusal contact area can be influenced by many factors, such as erosion, attrition, TMJ, tooth age, habitual posture, location of the tooth, tooth type, chewing, and time of day.13 Thus, with time and natural attrition in occlusal function, greater initial occlusal contact areas can be formed. Each individual tooth after orthodontic treatment will need time to settle into the optimal occlusal state within its new location. Indeed, the occlusal contact area may increase after the removal of active appliances during the period of post-treatment "settling" or over time.14 This "settling" can be beneficial and can improve the interdigitation of the teeth. Thus, the final occlusal contact area may be only one-third of the initial occlusal contact area prior to settling. The occlusal contact area of the set-up model was also one-third of the initial occlusal contact area because time and occlusal function factors were not considered, as in the final model.
The final occlusal contact area is expected to increase over time. However, our results do not show retention of the occlusal contact area. Thus, the occlusal contact area needs to be assessed in the retention period long after orthodontic treatment. We have performed a pilot study to measure the occlusal contact area in a few retention models between 6 and 12 months after debonding. From this pilot study, we found that the area of the occlusal contacts during the retention period increased compared to that of the final model (data not shown). Further research using the same models to investigate the degree of occlusal contact recovery over time is needed.
The initial occlusal contact area did not differ between class I and II finishings. These results were similar to those of Yoon et al.,7 who also found no differences in a comparison of occlusal contact area before treatment among first molars with different Angle's classifications. 10 They had also compared occlusal force according to occlusal relationship, skeletal pattern, age, and sex and found that age, anteroposterior skeletal pattern, and molar classification did not affect occlusal force. However, unlike Yoon et al.,7 we also investigated the effects of mechanical contact while considering occlusal forces.
In previous studies, Prescale7 and T-scan have been used to determine occlusal contact area. However, the occlusal force on biting the film is dependent on the patient's oral condition, thereby limiting the accuracy of these measurement tools. Using Prescale,7 the occlusal contact area ranges from 10 to 20 mm2 for the class I molar relationship and 7 to 14 mm2 for the class II molar relationship. Thus, our results, which used 3D model scans and RapidForm 2004, showed greater occlusal areas than those measured by Prescale.7 Our method may be more accurate since it does not require patient cooperation and the clinician can adjust the occlusal pressure whenever the model has to be analyzed. However, some errors may influence the results, such as the possibility of deformation while taking the impression, error when scanning the model digitally, and model artifacts. The use of digital intra-oral scanners is increasing since it decreases measurement error while taking impressions with materials such as alginate.15 Further studies evaluating the differences between these methods and other commonly used methods are needed.
Functional occlusion data should be considered when diagnosing patients undergoing orthodontic treatment. Because our study was limited by the small sample size, further studies with larger sample sizes are needed to compare the occlusal contact area during the retention period to determine changes in the occlusal contact area over time.
CONCLUSION
In this study, the occlusal contact areas of class I and II finishings were analyzed. We obtained the following conclusions from our data. First, in the posterior occlusal contact area of set-up models, which represents the treatment goal, class I finishing exhibited a larger contact area than class II finishing. Second, in the initial models, the contact areas of class I and class II relationships did not differ, while class I finishing tended to have a larger occlusal contact area than class II finishing in the final model. Finally, the maxillary second premolar was not significantly different between class I and II finishings, in both set-up and final models.


 XML Download