

 PDF
PDF ePub
ePub Citation
 Print
Print


INTRODUCTION
Precise analysis and diagnosis are important for orthodontic treatment planning and require high-quality basal data. Lateral cephalograms provide the preliminary data for facial analysis, and facebow transfers provide other essential data for planning orthognathic surgery and fabricating interim stents. Because these records are obtained by using ear rods, the reliability of the derived data depends on the ability of the ear rods to locate the head in an appropriate position. The key structures in this process are the skeletal and soft-tissue poria.
In essence, the following three criteria should be satisfied to obtain suitable lateral cephalograms and facebow transfers:
The imaginary line passing through the bilateral poria should be perpendicular to the midsagittal plane of the skull.
The ear rods should locate the head accurately through the soft-tissue poria.
The location of the head through the soft-tissue poria should be identical to that through the skeletal poria.
With regard to the first criterion, numerous studies of the symmetry of the skeletal poria have been conducted. According to Kim et al.,1 the skeletal porion is the most appropriate reference point for evaluating craniofacial asymmetry. However, in a study by Katsumata et al.,2 who used a diagrammatic chart (i.e., skeletogram) of the mean asymmetry indices of modified cephalometric landmarks and their standard deviations in normal individuals to evaluate the degree of deformity in patients with facial asymmetry, the skeletal porion exhibited a stronger asymmetry index than the orbitale and menton in control subjects. Further, Park et al.3 indicated that the orbitale and porion are occasionally asymmetric and should not be used as compositional points in the horizontal reference plane. Nevertheless, in cone-beam computed tomography (CBCT), in which images are obtained in the natural head position, these limitations can be overcome by setting the horizontal plane parallel to the ground.
To date, only a few studies have focused on the symmetry of the soft-tissue poria. Kim et al.4 studied the asymmetry of the skeletal and soft-tissue poria but confined their analysis to the lower facial third. Ghom5 stated that ear rods during radiography should be used unilaterally because patients with facial asymmetry have asymmetric soft-tissue poria. Because the porion is an important element of the horizontal reference plane, its features should be reviewed; further, the parallelism of the skeletal and soft-tissue poria should be examined.
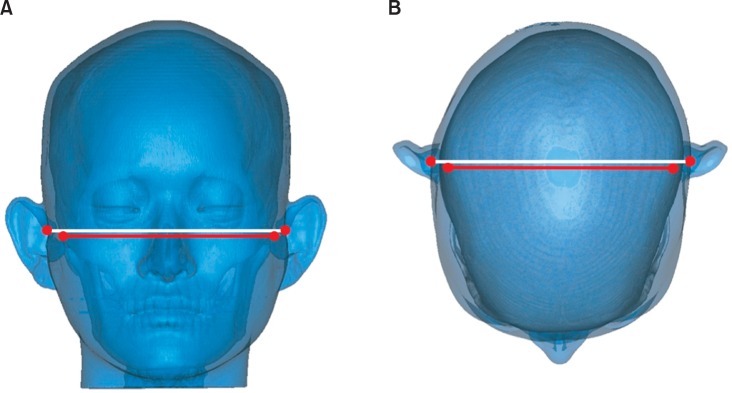
The purpose of this study was to examine the symmetry and parallelism of the skeletal and soft-tissue poria by three-dimensional (3D) computed tomographic (CT) imaging (Figure 1).
MATERIALS AND METHODS
Subjects
Fifty-eight patients at the Orthodontic Clinic of Dankook University Dental Hospital (Cheonan, Korea) participated in this study. They were classified into the symmetric (n = 29) and asymmetric (n = 29) groups on the basis of the extent of menton deviation (< 4 mm = symmetric; > 4 mm = asymmetric). Patients with a history of orthodontic treatment or maxillofacial surgery, maxillofacial anomalies (e.g., cleft palate or cleft lip), or syndromic diseases affecting the craniofacial structure were excluded.
CT imaging
CT scans were performed with the subject's Frankfurt horizontal plane perpendicular to the ground and the midsagittal plane aligned with the long axis of the machine (six channel, 400 V, 50 Hz; Somatom Emotion 6; Siemens AG, Erlangen, Germany). Both the maxilla and the mandible were included in the scans. The tomographic conditions were gantry angle of 0°, voltage of 120 kV, auto mA, slice thickness of 0.625 mm, slice pitch of 3, scanning time of 4 s, and field of view of 250 mm.
Image reconstruction
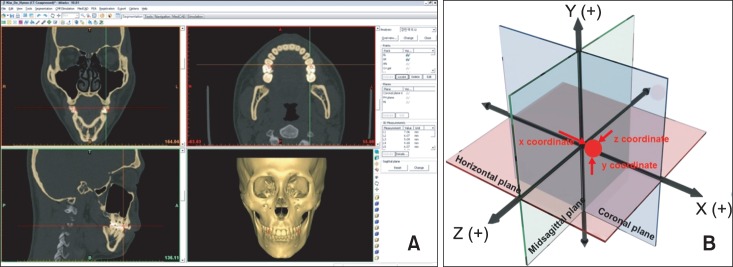
The CT images were saved in Digital Imaging and Communication in Medicine (DICOM) format and transferred to a personal computer for reconstruction by using a 3D imaging program (Mimics 10.01; Materialise, Leuven, Belgium). The Mimics program reads transverse images and produces longitudinal and frontal images for 3D modeling. The Hounsfield unit (HU), which expresses the gray scale in CT, was adjusted to 443 HU to represent the maxillary tuberosity with the lowest density. Volume rendering was performed by creating a surface using continuous triangular units for each pixel. The image quality in the program was adjusted to be optimal (Figure 2A).
Measurements
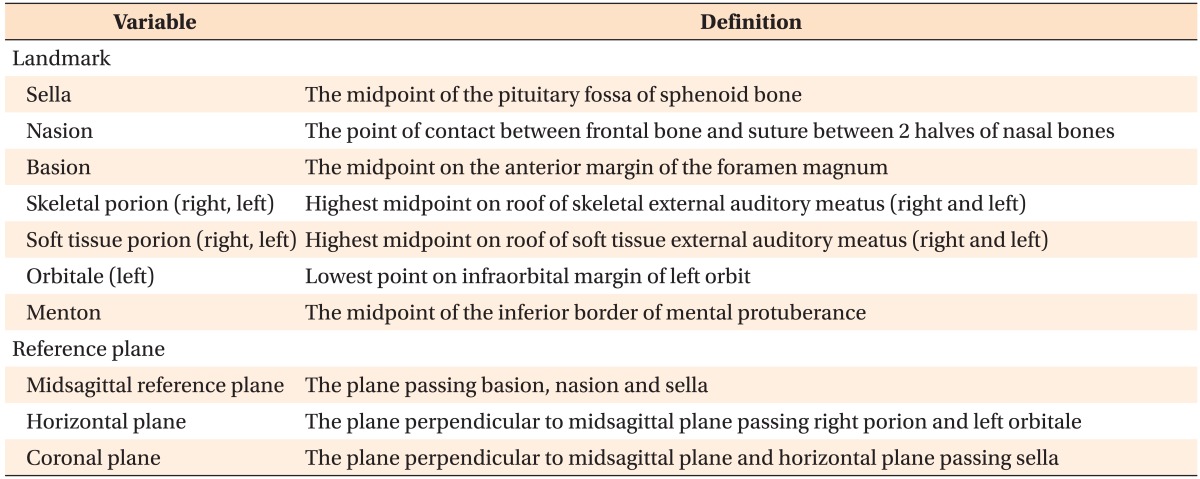
Table 1 lists the reference points and planes in the 3D reconstructed models.
The 3D coordinate system
The 3D coordinate system was created by using Mimics 10.01. The intersection of the three reference planes was the starting point (0, 0, 0). The distances from a selected point to the midsagittal, horizontal, and coronal planes represented the x-coordinate, y-coordinate, and z-coordinate of that point, respectively (Figure 2B). The coordinates of the bilateral skeletal and soft-tissue poria in each subject were determined by using this system.
Angular deviation
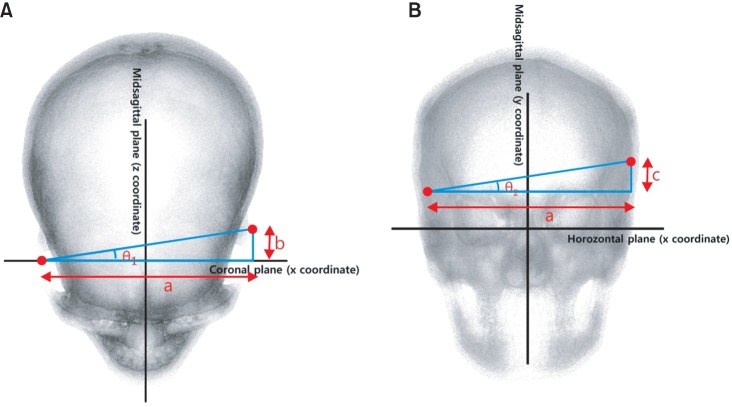
The anteroposterior (θ1) and vertical (θ2) differences in the bilateral skeletal and soft-tissue poria were calculated by determining the angles between the relevant reference planes and the lines passing through the left and right poria. The coordinate system of the coronal and midsagittal planes was used to calculate the θ1 value and lengths of a and b (Figure 3A) and that of the horizontal and midsagittal planes was used to calculate the θ2 value and lengths of a and c (Figure 3B). θsk and θsof represent the angular deviations of the skeletal and soft-tissue poria, respectively. The calculations yielded negative values for b and c. Because this study focused on the amount of difference rather than the relative position, the absolute values of b and c were used.
Statistical analyses
SPSS software 12.0 (SPSS Inc., Chicago, IL, USA) was used for statistical analyses. In the normality tests, only θsk1 exhibited a normal distribution. Therefore, the Wilcoxon signed-rank test was performed to analyze the anteroposterior parallelism of the poria on the basis of the significance of θsk1 and θsof1 and the vertical parallelism on the basis of the significance of θsk2 and θsof2. The Mann-Whitney U-test was performed to determine the significance of the intergroup differences in the angular deviations. Significant variations among the angular measurements were evaluated by using receiver operating characteristic (ROC) curves to determine the cutoff values for discriminating the groups.
To evaluate the reliability of the measurements, five random samples were chosen and remeasured one week later. Dahlberg's formula was used to evaluate method error, as follows:
Method error =  .
.
.
d: difference between the first and the second measure.
n: sample size which was re-measured.
RESULTS
Both the groups had 17 male and 12 female subjects. The mean ages of the patients in the symmetric and asymmetric groups were 22.51 ± 5.03 and 23.42 ± 2.64 years, respectively. The groups showed a significant difference in the mean menton deviation (1.57 ± 1.11 mm vs. 10.14 ± 4.13 mm; p = 0.000 by the independent t-test).
The paired t-test revealed no systemic error in the measurements. The minimum and maximum method error values of the reference points in the 3D reconstructed models were 0.23 and 0.33 mm, respectively.
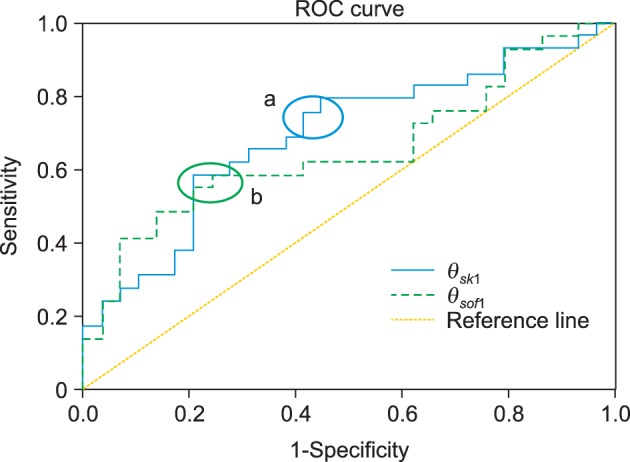
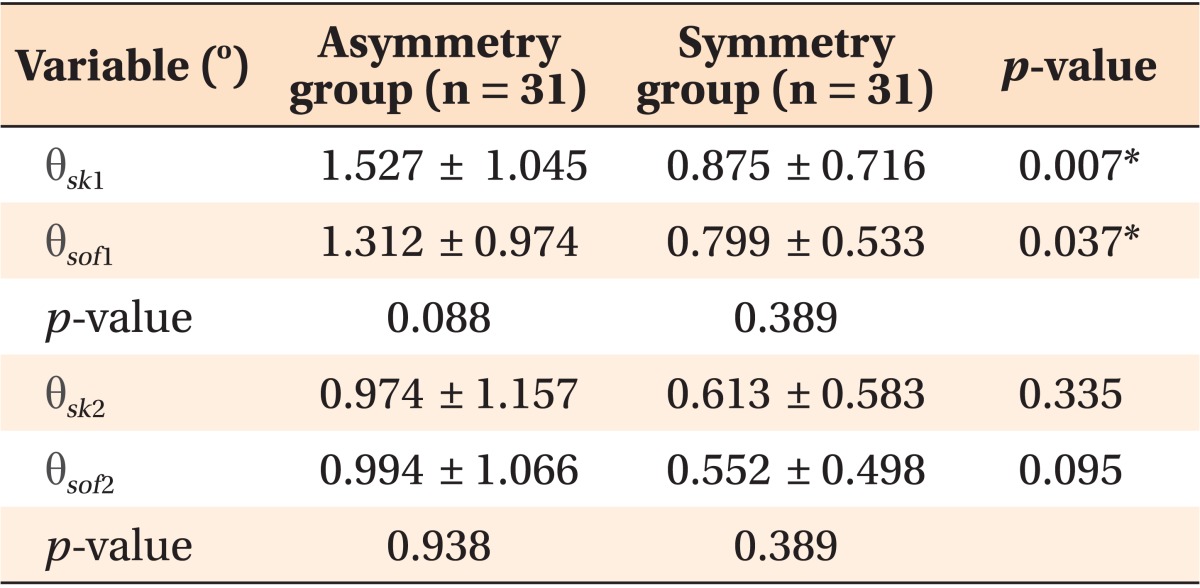
The Mann-Whitney U-test demonstrated significant differences in the values of θsk1 and θsof1 between the groups (Table 2). However, the Wilcoxon signed-rank test revealed no significant differences in anteroposterior and vertical parallelism of the poria in both the groups. The ROC curves of θsk1 and θsof1 are presented in Figure 4.
DISCUSSION
The present study focused on collecting reliable data for the preliminary diagnostic stage of orthognathic surgery. Patients were divided into the symmetric and asymmetric groups to investigate the average deviation of the bilateral poria in the hard and soft tissues. Furthermore, the parallelism of these structures was examined.
The symmetric and asymmetric groups were classified on the basis of a cutoff menton deviation of 4 mm and the statistical difference in the group means was validated by using the independent t-test (p = 0.000). Facial asymmetry is best predicted by the menton deviation.6,7 According to Kim et al.,8 the smallest menton deviation that can identify facial asymmetry is 3 mm, and a deviation greater than 4 mm is clearly discernable. The published research on facial asymmetry has set the standard for menton deviation at 4 - 5 mm.
A 3D coordinate system is essential for studying symmetry and parallelism in 3D reconstructed models. Previous studies used different coordinate systems and the standard plane first selected by the researcher determined the remaining reference planes. In some studies, the horizontal plane was established as the standard plane and the midsagittal and coronal planes were used as the other planes.9,10 Studies in which the midsagittal plane was used as the standard plane and the horizontal and coronal planes followed have also been conducted.2,11 When the horizontal plane is determined first, it is set by using the bilateral poria and the left orbitale or nasion. However, because the present study investigated the symmetry and parallelism of the poria, this method was not suitable. Therefore, the midsagittal plane was established first, by using the basion, nasion, and sella as in the Cho and Moon12 study. Structures closer to the cranial base are more symmetric and stable in size; therefore, they can be used as points to compose a standard plane.2,13,14 Furthermore, the use of three points to determine the midsagittal plane seems to be a reliable method.
As shown on Table 2, the mean values of the anteroposterior (θ1) and vertical (θ2) angular deviations were higher in the asymmetric group than in the symmetric group, although the difference was only 0.5° - 1.5°. Therefore, patients with facial asymmetry tend to show greater positional deviations of the skeletal and soft-tissue poria. Furthermore, for both the hard and the soft tissues, the average anteroposterior deviation is greater than the average vertical deviation regardless of facial asymmetry.
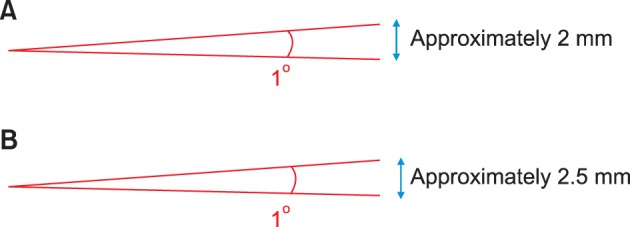
In the 3D reconstructed models, the average distance between the bilateral hard-tissue poria was 110 mm; therefore, a 1° angular difference equates to a linear deviation of approximately 2 mm in the hard tissue (Figure 5A). Moreover, the average distance between the bilateral soft-tissue poria was 135 mm, indicating that a 1° angular difference converts to a 2.5-mm deviation in the soft tissue (Figure 5B). The angular differences in the skeletal and soft-tissue poria were only 0.652° and 0.513°, respectively, between the asymmetric and the symmetric groups. Therefore, the respective linear differences were only 1.28 and 1.27 mm, which can be considered clinically negligible. However, the asymmetric group exhibited an average anteroposterior angular deviation of 1.5° in the hard tissue, indicating an anteroposterior linear deviation of 3 mm, which is not clinically negligible. The average anteroposterior angular deviation of the soft tissue in this group was 1.312°; therefore, the anteroposterior linear deviation was 3.25 mm. This deviation appears more remarkable in a cephalogram with 110% enlargement. These results are in accordance with the results of Kim et al.1 In their study, the average angle between the hard-tissue "external acoustic meatus" and the facial axis (foramen caecum-subspinale) was 88.28° in the symmetric group and 87.89° in the asymmetric group. Although the difference is more than 2°, the angle is close to 90° and should be a suitable reference. This difference in interpretation was also found in the current study, which has similar results. There are numerous studies that have used various methods to calculate the asymmetry of the poria. Katsumata et al.2 and Maeda et al.15 used a left and right asymmetry index for their symmetric and asymmetric groups in order to create a diagrammatic chart (i.e., a skeletogram); according to their study, the hard tissue porion exhibited a larger asymmetry index value than the orbitale and menton in the symmetric group. According to Park et al.,3 the orbitale and porion are sometimes asymmetric and should not be used as compositional points in the horizontal reference plane. Furthermore, in CBCTs which are obtained using the natural head position, regardless of the asymmetry of poria and orbitale, these limitations can be overcome by setting the horizontal plane as that which is parallel to the ground.
Only the anteroposterior angular differences (θsk1 and θsof1) of the skeletal and soft-tissue poria were significant, with the asymmetric group exhibiting greater angular deviations. The cutoff values that anteroposteriorly discriminate an asymmetric porion from a symmetric porion can be inferred from the ROC curves in Figure 4. An ROC curve plots the relationship between the false positive rate (specificity) and the true positive rate (sensitivity) for different cutoff points. The more toward the upper left side that the curve is located and the closer to the reference line, the more accurately does it discriminate the cutoff value. The area between the curve and the reference line indicates accuracy. A value of 1 indicates perfect accuracy and that of 0.5 indicates inaccuracy and unsuitability for use. In this study, the area of θsk1 was 0.70 and that of θsof1 was 0.66. Therefore, the cutoff value must be determined with high sensitivity and low specificity, if possible. In Figure 4, the appropriate sections are "a" and "b." The angular values corresponding to these areas are 0.7° - 0.8°. Therefore, the cutoff value of both θsk1 and θsof1 for anteroposteriorly discriminating symmetric and asymmetric poria is in the 0.7° - 0.8° range (1.34 - 1.53 mm in the skeletal poria and 1.65 - 1.89 mm in the soft-tissue poria).
According to these results, patients with facial asymmetry can exhibit an average linear deviation of 3 mm in the skeletal or soft-tissue poria. In patients with a menton deviation greater than 4 mm, the deviation of the soft-tissue poria should be corrected by moving the ear rods anteroposteriorly on the articulator. In general, as CT scans are obtained before surgery, this alignment process does not require additional CT imaging. Furthermore, when obtaining a lateral cephalogram, only one ear rod should be used.
Mandibular symmetry and the porion position seem to be associated. Some studies have explained this association through plagiocephaly. Unilateral flattening of the posterior head causes rotation of the cranial base,16,17,18,19 which can affect not only the anteroposterior location of the auricle but also mandibular symmetry.20,21 However, other studies have indicated that mandibular asymmetry is independent of cranial asymmetry and is less correlated with cranial deformation. Therefore, mandibular asymmetry may not be a result of the anterior transition of the auricle.
The published literature includes one comparative study of the skeletal and soft-tissue poria.4 However, this study was undertaken two-dimensionally and focused on menton deviation rather than the porion position. In the present study, in both the symmetric and the asymmetric groups, the skeletal poria were parallel to the soft-tissue poria. Regardless of whether the skeletal poria are asymmetric or not, the soft-tissue poria are aligned with them.
CONCLUSION
The key conclusions that can be drawn from this study are as follows:
Patients with facial asymmetry show greater anteroposterior deviations of the skeletal and soft-tissue poria than those without facial asymmetry.
The skeletal poria are parallel to the soft-tissue poria regardless of facial asymmetry.
In patients with facial asymmetry, the average porion deviation is 3 mm; this should be corrected during facebow transfer.
Only one ear rod should be used when obtaining lateral cephalograms.
 XML Download