

 PDF
PDF ePub
ePub Citation
 Print
Print


INTRODUCTION
Orthodontic mini-implant anchorage is a valuable alternative to extraoral anchorage and has eliminated most patient-compliance issues encountered during treatment.1 Mini-implants are simple, easy to use, cost-effective, and convenient for achieving absolute skeletal anchorage with an estimated success rate of 80-90%, which means that the mini-implant is lost in 10-20% of absolute anchorage cases.2
The success of orthodontic mini-implants is affected by the quality and density of the alveolar cortical bone. If the bone is not sufficiently thick or dense, the mini-implant may be lost because of lack of initial stability; on the other hand, if the bone is too thick or dense, the mini-implant placement method may cause overheating of the bone structure or breakage of the device.3,4 Therefore, at-risk anatomic areas and patients should be clearly identified for appropriate treatment planning.5
A recent investigation using cone-beam computed tomography (CBCT) revealed that vertical facial type may be related to cortical bone thickness of the alveolar process and, therefore, to initial mini-implant stability.6 Cortical bone density is reportedly a predictor for the initial stability of mini-implants.7,8 Although the thickness of the alveolar cortical bone has already been mapped, the variability in cortical bone density according to vertical facial type has not been studied yet.
The purpose of this study was to quantitatively evaluate the cortical bone densities of the maxillary and mandibular alveolar processes in adults with different vertical facial types using CBCT images.
MATERIALS AND METHODS
The study sample was selected by a retrospective screening of CBCT images archived at the Department of Oral Radiology, Yeditepe University Dental School (Istanbul, Turkey). The inclusion criteria were as follows: no periodontal disease with alveolar bone loss, age between 20 and 45 years, no excessive facial asymmetries, no cleft lip and/or palate, no missing teeth in the measurement areas, no diagnosed systemic diseases, and no severe craniofacial dysmorphology. Patient data were handled according to the requirements and recommendations of the Declaration of Helsinki. The institutional review board of Yeditepe University approved this study (approval number 207).
The CBCT images were obtained using ILUMA™ (IMTEC Imaging, Ardmore, OK, USA) unit with an amorphous silicon flat-panel image detector and were saved as ILUMA™ Vision viewer files. The imaging parameters were as follows: 120 kVp, 3.8 mA, scan time of 40 s, focal spot of 3.3 mm, and voxel size of 0.093 mm.
Angular and linear measurements of S-N/Go-Me made on the images were used to group the patients according to the following different vertical facial types: hypodivergent, normodivergent, and hyperdivergent groups. With regards to the linear measurement of S-Go/N-Me, ratios of < 61%, 61% to 69%, and > 69% indicated increased, normal, and decreased facial heights, respectively. S-N/Go-Me angles of < 27°, 27° and 37°, and > 37° indicated decreased, normal, and increased facial heights, respectively. If the two measurements did not indicate the same group, the corresponding images were excluded. Finally, 142 CBCT images were analyzed in this study.
The densities of the maxillary and mandibular buccal cortical plates and maxillary palatal cortical plate were measured at 4 interdental sites: between the canine and the first premolar (3-4), between the first and second premolars (4-5), between the second premolar and the first molar (5-6), and between the first and second molars (6-7). The lingual cortical plate in the mandible was not measured because of its limited use for mini-implant placement.
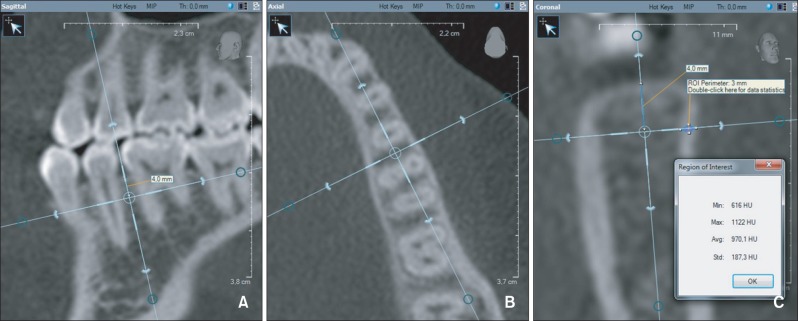
The positions of the measurement sites were located on the sagittal slices. The slices were oriented so that the vertical reference line bisected the interdental space and was parallel to the long axes of the roots. The axial slices were used to ensure that the vertical reference line bisected the interdental areas. Then, points 4 mm apical to the alveolar crest were determined on the coronal slices; this distance generally represents the mucogingival junction (Figure 1). Finally, cortical bone density was measured in Hounsfield units (HU) between points, one at the outer surface and the other at the border of the cortical and cancellous bone, on a line perpendicular to the bone surface in the coronal slices.
One orthodontist performed all the measurements and recorded the data in a Microsoft Excel file (Microsoft, Redmond, WA, USA). Thirty images (10 randomly selected images from each group) were remeasured to check intra-observer reliability and the intraclass correlation coefficients were calculated.
Statistical calculations were carried out with NCSS 2007 software (NCSS LLC, Kaysville, UT, USA) for Windows. Besides descriptive statistics (mean and standard deviation) in the groups showing normal distribution, one-way ANOVA and Tukey multiple comparison tests were used for intergroup and subgroup comparisons, respectively. For comparison of the independent data, paired t-test was used; for analyzing the qualitative data, the chi-square test was used. The results were evaluated at the significance level of p < 0.05, with a 95% confidence interval.
RESULTS
The repeated measurements were consistent and indicated very good intra-observer reliability, as the intraclass correlation coefficients were above 0.85.
The mean ages of the hypodivergent, normodivergent, and hyperdivergent groups were 33.23 ± 7.26, 32.50 ± 7.92, and 34.62 ± 6.63 years, respectively. The hypodivergent group included 41 male (51.3%) and 39 female (48.8%) subjects, the normodivergent group included 44 male (44.0%) and 56 female (56.0%) subjects, and the hyperdivergent group included 36 male (34.6%) and 68 female (65.4%) subjects. No significant differences in mean age (p = 0.111) and gender (p = 0.073) were noted among the groups.
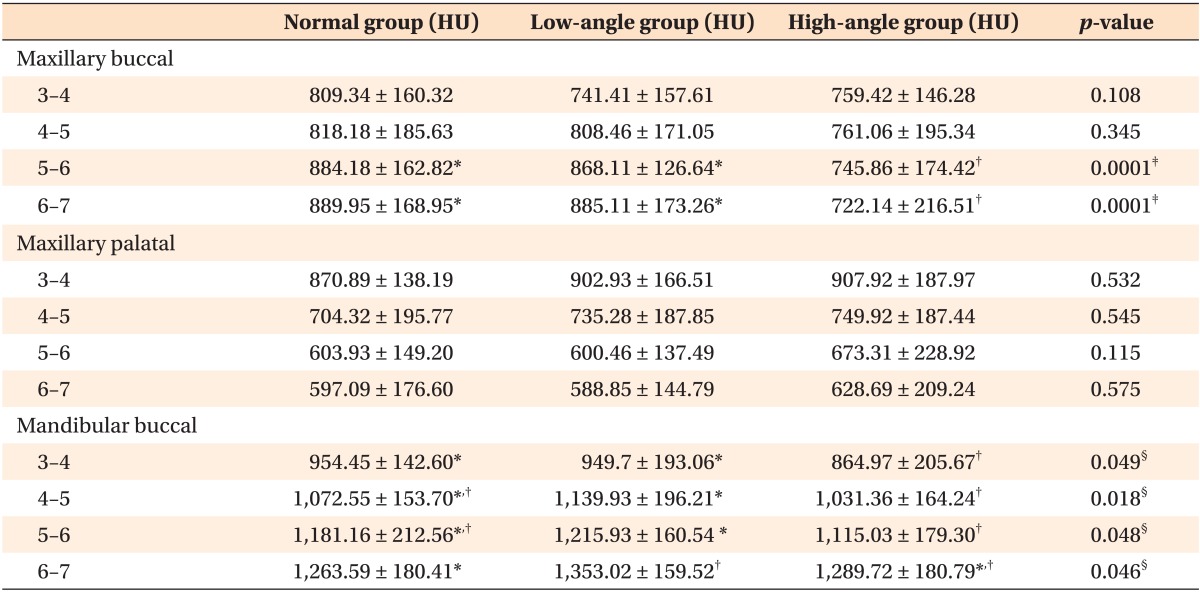
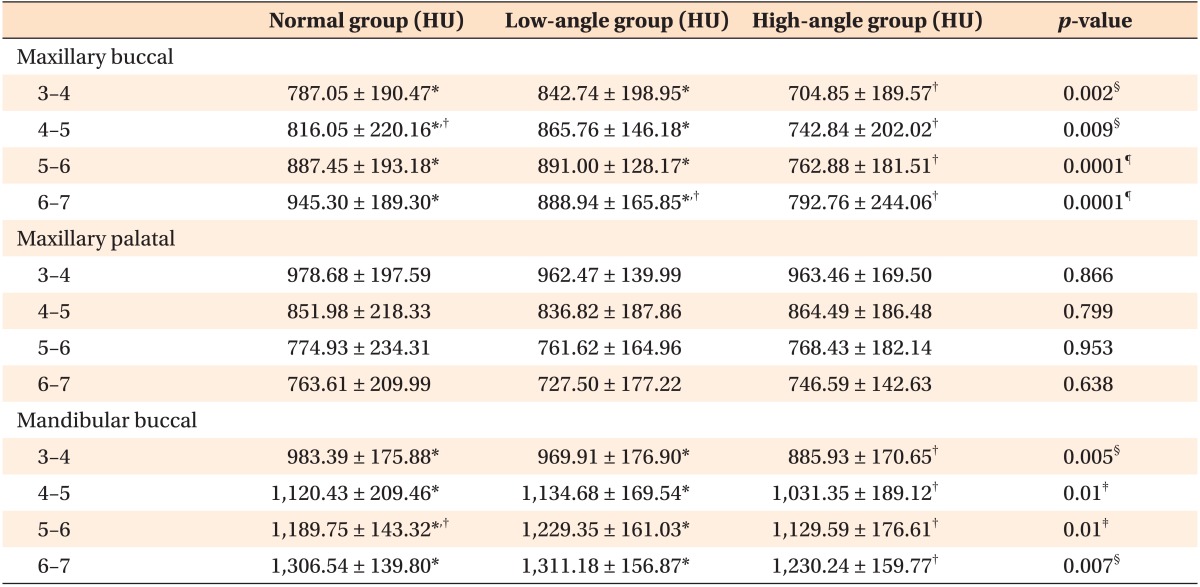
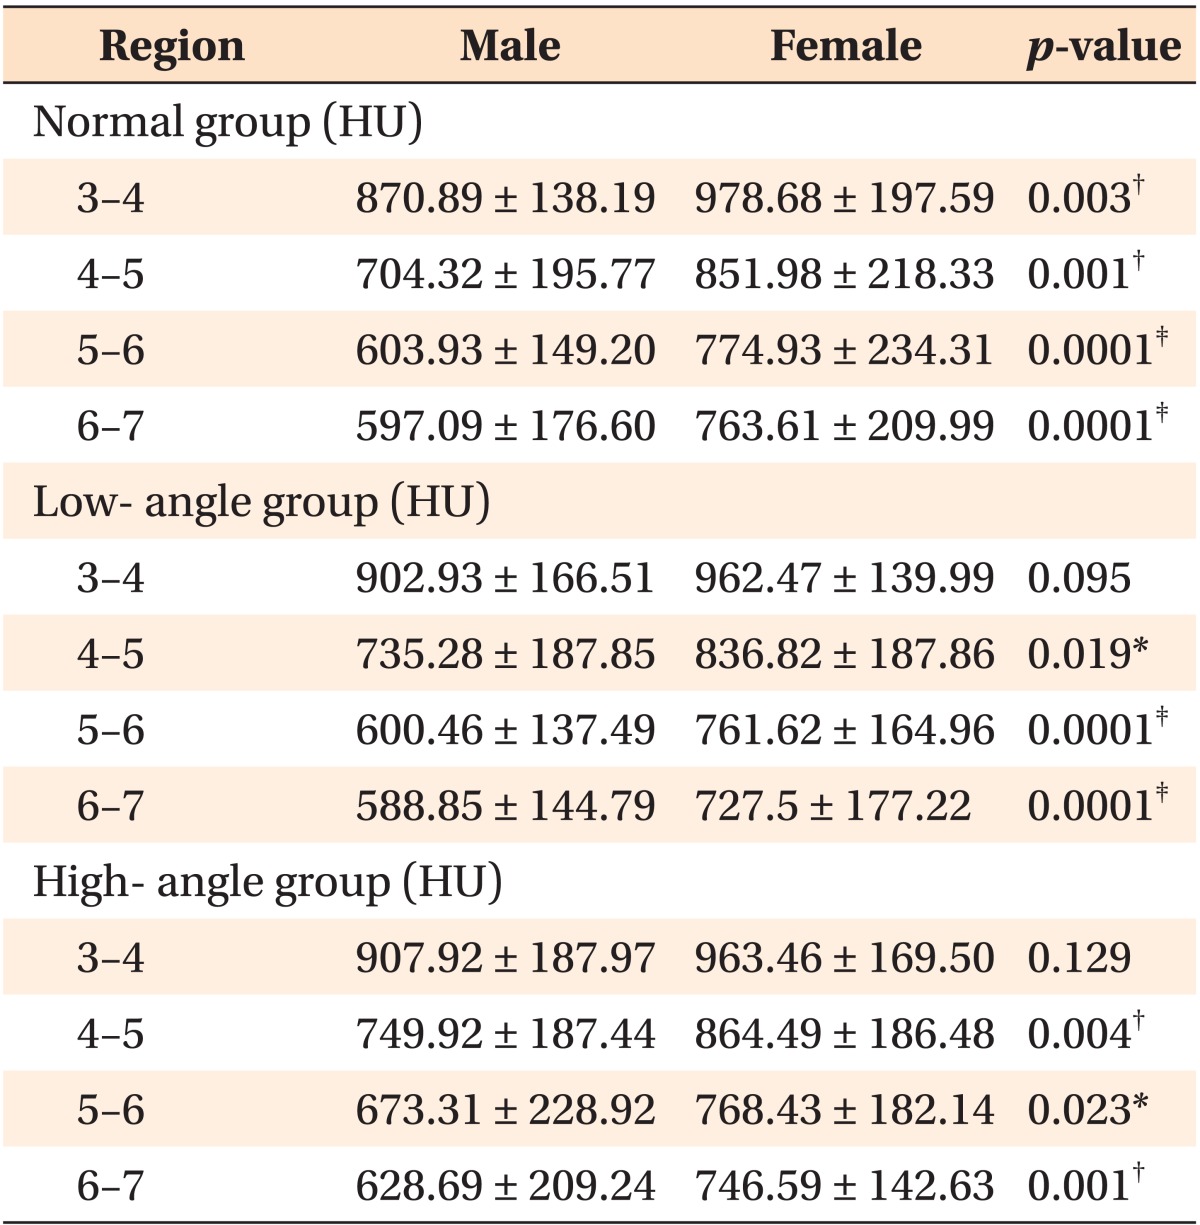
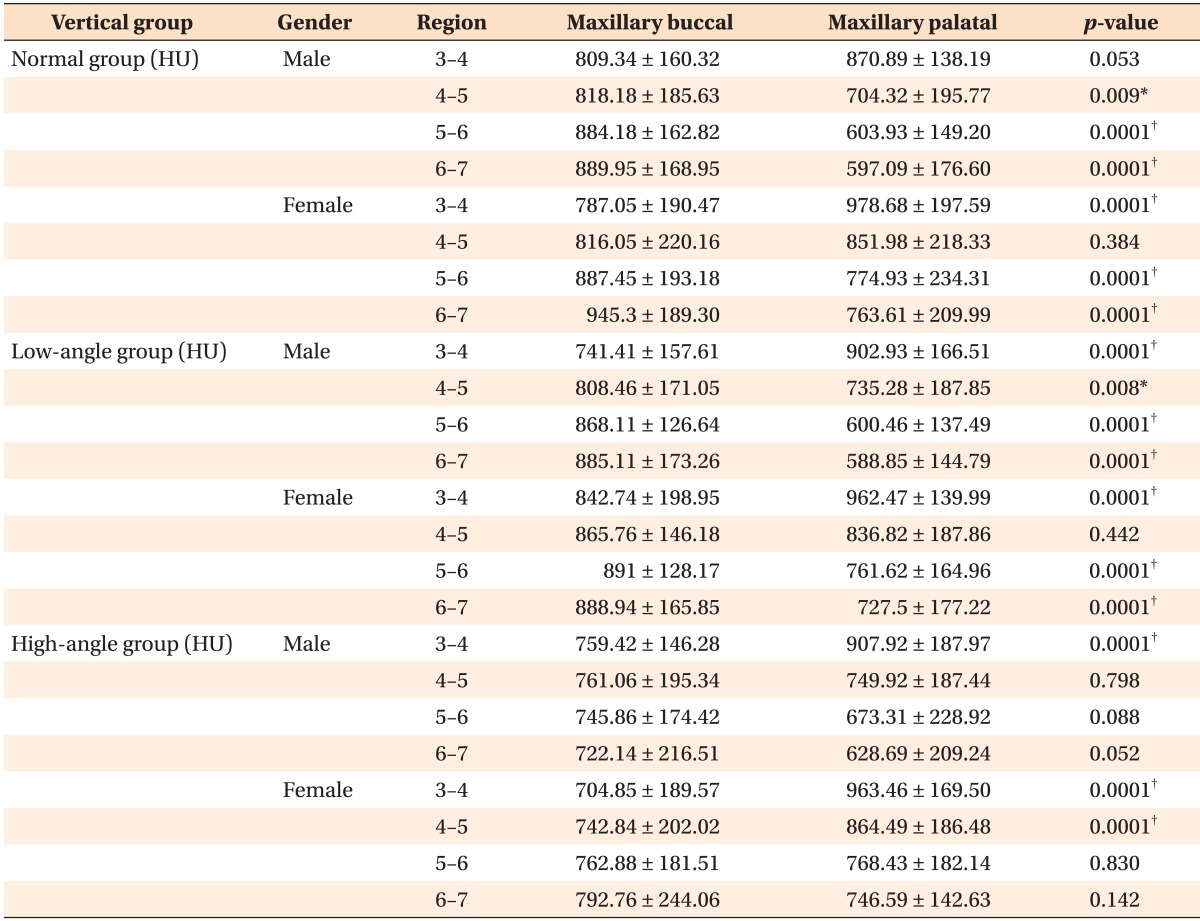
The cortical bone density was not significantly different between the right and left sides at any of the measurement sites (p > 0.05). In the hyperdivergent group, the female subjects had decreased cortical bone density at all of the maxillary buccal measurement sites, whereas the male subjects had decreased bone density only in the maxillary buccal 5-6 and 6-7 regions, when compared with the corresponding subjects of the other groups (Tables 1 and 2). In the mandible, this group had lower buccal cortical bone density at all of the measurements sites when compared to the hypodivergent group. No significant differences in the palatal cortical bone density were observed among the groups (Tables 1 and 2). However, the female subjects generally had denser palatal cortical bone than the male subjects (Table 3).
Mostly, all of the groups showed no significant differences in cortical bone density between the palatal and buccal sides of the maxillary premolar region (Table 4). Nevertheless, the palatal cortical bone was denser anteriorly, whereas the buccal cortical bone was denser posteriorly. In the normodivergent group, the difference between the buccal and palatal cortical bone densities increased from the premolar region onward. No significant differences between the buccal and palatal cortical bone densities in the posterior region were found in the hyperdivergent group.
DISCUSSION
Given that the initial stability of mini-implants is derived from the tight contact with bone and not from osseointegration, the properties of the surrounding bone are very important. The characteristics and quality of facial bones are controlled by genetics and affected by function.9 Besides studies that show different facial cortical bone thicknesses with various vertical dimensions,6 reports indicate that the vertical dimension of the face is a parameter relevant to the success of mini-implants.3,10 In this regard, the aim of the present study was to determine the relationship between vertical facial dimensions and cortical bone density in the areas of mini-implant placement.
In this study, CBCT images were used for evaluating the cortical bone density due to the availability of the images. HU-based density measurements help to estimate bone quality and implant prognosis.11 This measurement unit is directly associated with the tissue attenuation coefficient and is standardized according to the attenuation coefficient of water: water, 0 HU; air, -1,000 HU; and enamel, 13,000 HU. Although the possibility of large errors when using quantitative gray values from CBCT is a concern, a study measuring bone density at dental implant sites showed that the correlation between CBCT- and medical CT-derived HU values is very high, despite standardized HU calibrations being available only for medical CT.12,13 Moreover, other studies indicated the feasibility of deriving HUs from CBCT14 and correlating CBCT-derived HUs and density data from alternative sources.15-18 In particular, a recent study examining bone mineral density and its influence on mini-implant stability showed a strong positive correlation between dual-energy X-ray absorptiometry and CBCT for bone density measurements.18 Another recent study regarding CT and CBCT indicated that a conversion can be used to define bone density by CBCT.19 The present study focused on comparing the cortical bone density among various maxillary and mandibular areas rather than defining the density in a certain anatomic region, for which CT images are preferable to CBCT images.
CBCT-derived density measurements are influenced by the scanning device, cone angle, imaging parameters, and position of the evaluated area.20,21 Density measurements are reportedly not consistent within one CBCT image, and the discrepancy could be related to the mass of the object within and outside the field of view or the content of the mass.20,22 Although pseudo-HUs can be derived by CBCT, further investigations should be performed for alternative methods of assessing bone tissue.23 As assessing bone density on CBCT images in a clinical situation is problematic, the results of the present study should be interpreted with caution. However, given that CBCT for routine planning of orthodontic mini-implant placement is not clinically justifiable because of high radiation exposure, the results of this retrospective study can serve as a useful guide to predict bone mineral density in areas of mini-implant placement.
No marked gender differences except in the maxillary palatal measurements were noted; the female subjects had denser cortical bone on the maxillary palatal side (Table 4). This interesting finding is consistent with the results of other studies on the bone densities at midpalatal mini-implant placement sites.24-26 On the other hand, Choi et al.,27 who investigated the bone densities at interdental areas with simulated placement of mini-implants, found no difference between the genders. The authors propose that these results are due to the young ages of the participating subjects (24.7 ± 3.3 years), at which age-related bone resorption would not yet have occurred.
Comparison of the bone density in the maxillary palatal region according to the vertical facial type revealed no significant differences (Tables 1 and 2). The palatal bone density was significantly higher than the buccal done density in the canine-first premolar area of all the groups (Table 4). However, no significant differences were found between the palatal and buccal cortical bone densities in the premolar area of the hypodivergent group and in the second premolar to second molar area of the hyperdivergent group, although the buccal cortical bone was denser than the palatal cortical bone in the hypodivergent and normodivergent groups. Park et al.,25 without stating the vertical facial type of their patients, concluded that the palatal and buccal cortical bone densities in the maxillary posterior region do not differ significantly, as was noted in the hyperdivergent group in the present study. Furthermore, Choi et al.,27 without any vertical facial classification of their subjects, also reported no significant density difference between the buccal and palatal sides of the maxillary alveolar process. The authors state that only the mandibular lingual side had higher values anteriorly, and lower values posteriorly. The present study shows that patients with the hyperdivergent facial type have unfavorable cortical bone density for mini-implant placement on the maxillary buccal side. All the evaluated maxillary buccal sites showed less cortical bone density in women with the hyperdivergent facial type; however, the region mesial to the second premolar did not reveal any difference among the vertical facial types in men. Although studies examining cortical bone density with respect to vertical facial type are lacking, recent investigations on alveolar cortical bone thickness have revealed that the cortical bone tends to be thinner in subjects with the hyperdivergent facial type.6 Reportedly, adult patients with this facial type may encounter problems because of thin cortical bone in the maxillary buccal and mandibular anterior (canine-first premolar) buccal regions, which is consistent with the results of the present study.
Subjects with the hyperdivergent facial type had lower density values on the mandibular buccal side. The bone density in this region was still much higher than that in the maxilla in the hyperdivergent group, which is noteworthy. The differences in the structure and characteristics of the cortical bone among the groups may be attributed to functional differences such as variations in muscle position and forces.28 Considering that the posterior mandible is generally a problematic area, because the heat generated while passing through thick cortical bone or overcondensation of thick cortical bone in the area affects mini-implant stability, the lower bone density in these patients may be advantageous for mini-implant placement.29
Although a 1 mm threshold of cortical bone thickness is required to ensure stability,3,4 no study has suggested the threshold bone density at mini-implant placement sites. Reportedly, the thickness and not the density of the cortical bone is important for mini-implant stability.30 The difference in the previous results may have arisen mainly from the multifactorial nature of the mini-implant procedure. Nevertheless, the results of the present study showed similarities in the cortical bone thickness and density when compared with the results of researches evaluating cortical thickness in various vertical facial types.
On the basis of the present study, we recommend the following guidelines. The risk of losing mini-implants in the palatal posterior region when intruding molars is high. In this situation, the use of midline palatal screws or screws between the canine and the first premolar on the palatal side is more appropriate. Furthermore, patients with the hyperdivergent facial type have unfavorable cortical bone density on the maxillary buccal side; however, because they show no significant difference on the maxillary palatal side, the palatal midline may be chosen for mini-implant placement or auxiliaries may be used in these patients.5 Next, in patients with the normodivergent or hypodivergent facial type, the area between the second premolar and the second molar should be chosen for mini-implant placement on the buccal side. Finally, clinicians should remember that the reported data are only guides, each patient is unique, and the density variability among patients is high. In high-risk cases, such as patients with systemic or severe craniofacial problems, each site should be evaluated before mini-implant placement.
CONCLUSION
Patients with the hyperdivergent facial type tend to have less-dense buccal cortical bone in the maxillary and mandibular alveolar processes than those patients with other facial types.
Women tend to have denser palatal cortical bone in the alveolar process than men.
Clinicians should be aware of the variability in the cortical bone density at mini-implant placement sites and take this into consideration to avoid loss of mini-implants due to insufficient initial stability or breakage during placement.
 XML Download