

 PDF
PDF ePub
ePub Citation
 Print
Print


INTRODUCTION
The objective of orthodontic treatment is not only tooth alignment and functional restoration but also improvement of facial esthetics, particularly through achieving spatial symmetry between the oral cavity and the lower third of the face.1 Many individuals seek to enhance labial and surrounding soft-tissue appearance orthodontically. Esthetics of this region is highly dependent on harmony of anatomic structures such as the nose, mouth, and chin.2
Tweed3 observed that the mouth plays a pivotal role in characterizing facial beauty. Burcal et al.4 illustrated that people have greater substantive interest in changing aspects of their lips than of other facial structures. Therefore, precise diagnosis of soft-tissue positional relationships is required to establish the optimal treatment plan for achieving the best facial symmetry.
Two important changes have emerged in the diagnostic paradigm. First, Angle's paradigm-the concept that an ideal hard-tissue relationship makes an ideal soft-tissue relationship-has changed into the soft-tissue paradigm. Despite the interrelationship between hard and soft tissues, the maxilla, mandible, and occlusal relationship often do not reflect the soft-tissue form directly.5 Therefore, the soft-tissue ratio is now used to determine the hard-tissue ratio. The second change is that two-dimensional analysis is being replaced by three-dimensional (3D) methods. In many previous studies, two-dimensional analysis using lateral cephalograms was the major diagnostic tool, describing the ratio of the amount of movement of the anterior teeth to that of the lips. This method has a key limitation: the amount of movement is measured two-dimensionally along the sagittal plane, so assessment of a positional change of the lips, a 3D structure, is difficult.
Many methods have been developed to analyze soft tissues three-dimensionally, including conebeam computed tomography (CBCT).6,7,8 Although it can significantly reduce radiation dose compared with volume computed tomography (VCT) or multidetector computed tomography (MDCT), CBCT cannot be used over the long term because it does not delineate color and texture of soft tissues and increased radiation exposure from repeated use is unjustified.
In white light scanning, images can be obtained with the patient's eyes open and the scan time is shorter than that of laser scanning because of the use of many pattern lights. The method also has higher accuracy, because it is not affected by the thickness of the light source,9 and minimal safety risks. It allows rapid 3D analysis of not only craniofacial but also soft-tissue images on a computer. Images can be rotated to the desired positions and modified for easy observation. To date, few studies have used white light scanning to explore positional changes of soft tissues and none have used this method to analyze such changes of the lips depending on tooth positions. The objective of this study was to three-dimensionally assess positional changes of the adult upper lip according to simulated maxillary anterior tooth movements by white light scanning.
MATERIALS AND METHODS
Subjects
The subjects were 15 healthy adult volunteers (eight men, seven women); their average age (range) was 26.0 (24-31) years.
The inclusion criteria were as follows:
The exclusion criteria were as follows:
This study was approved by the institutional review board (IRB) of Dankook University Dental Hospital (IRB No. H-1311/011/001). Written informed consent was obtained from the subjects on an IRB-approved form.
Methods
Film fabrication
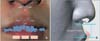
Tooth impressions were taken to fabricate plaster models. Films of five thicknesses (1-5 mm) were made by cutting Bioplast (Scheu Dental GmbH, Iserlohn, Germany) and adapted so that they would cover the whole labial surface of the maxillary incisors (Figure 1). These films enabled simulation of tooth movement.
White light scanning
Device
A Breuckmann smartScan 3D scanner (AICON 3D Systems GmbH, Braunschweig, Germany) was used for white light scanning. The field of view (FOV), resolution limit, feature accuracy, and scan range were 450 mm, 8 µm, ± 45 µm, and 318 × 318 mm2, respectively.
Scanning method
All the subjects were asked to relax their lips and muscle hyperactivity surrounding the lips was prevented through instruction. The subjects were informed that they could move their lips without moving their teeth. They were advised to take a stroll and look at a mirror frontally to determine their natural head position.10
The white light scanner is sensitive to surrounding light, so all other light sources were blocked in the scanning room. By using a dolly, the scanner could be moved without changing the scanning height. Movement of the subjects was minimized by using a fixed chair whose height could be controlled electrically.
The scans were performed in the frontal view, 45° to the right, and 45° to the left. Data from these scans were aligned and merged by the iterative closest point algorithm in Optocat 2010 R2 software (AICON 3D Systems GmbH). The soft-tissue landmarks used for merging were the exocanthion, endocanthion, pronasale, and cheilion.
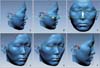
In total, six scans were performed: three in the normal occlusal position and three after attaching the films. The scan data were transferred to a personal computer and reconstructed by using Geomagic Design X 2014 reverse-engineering software (3D Systems, Seoul, Korea). Overlap errors were minimized by removing error-causing parts except in the studied facial region.
Establishment of the 3D coordinate system
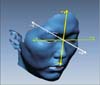
New reference coordinate axes were established by using the Design X software. In brief, Camper's plane, including the tragus and nasal alar point, was rotated 7.5° upward on the axis connecting both the tragi. The rotated plane was translated to include the soft-tissue nasion and set as the axial reference plane (Figure 2). The plane perpendicular to the axial reference plane that included the soft-tissue nasion and midpoint of the tragi was set as the sagittal reference plane. The plane including the soft-tissue nasion and perpendicular to the other reference planes was set as the coronal reference plane (Figure 2). Therefore, the origin of the new 3D coordinate system was the soft-tissue nasion and the sagittal, axial, and coronal reference planes were the x-, y-, and z-axes, respectively. The left, superior, and anterior directions were considered positive for the respective axes (Figure 3).
Alignment of data
The initial scan data and scan data obtained after film attachment were aligned by using Geomagic Verify 2014 software (3D Systems). Data overlap was primarily auto-aligned by the program algorithm and fine registration was performed by using the eye, nose, and brow region (Figure 4).
Measurements
Curves
Three curves were formed by using the Verify data and the changing aspects of the curves were traced to determine changes in labial morphology. The curves are defined in Table 1 and depicted in Figure 6. Ten equidistant points were added on each curve so that the curves were divided into 11 sections.
Statistical analysis
All measurements were performed by a single investigator (HHK). To assess intraexaminer reliability, data obtained from five subjects were chosen randomly and the points were remeasured one month after the original measurement. The two sets of coordinates were compared with paired t-test and method error was calculated with Dahlberg formula. No significant systematic error was found between the measurement sessions (p > 0.05), and the Dahlberg error ranged from 0.134 mm (z-coordinate) to 0.254 mm (x-coordinate). The coordinates of the landmarks were extracted and transferred to Excel 2013 program (Microsoft, Redmond, WA, USA). The difference in distance between each set of coordinates was calculated. SPSS software ver. 12.0 (SPSS Inc., Chicago, IL, USA) was used for statistical analyses. The averages and standard deviations of the differences in coordinates were calculated. Kolmogorov-Smirnov test was used as the normality test; all the measured values followed a normal distribution. Landmark coordinates after film attachment were analyzed by simple linear regression. Twelve points on each curve were projected on the scan data based on the baseline data and the distances between the points were calculated in Geomagic Verifiy 2014 software.
RESULTS
Changes in labial landmarks
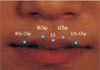
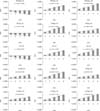
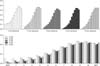
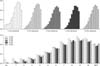
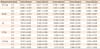
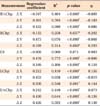
The descriptive statistics of the coordinate changes of the lips depending on film thickness are shown in Table 2. At all the landmarks, the y-coordinates had increased positive values and the degree of change was similar (regression coefficient: 0.391-0.476, R2 > 0.644) (Table 3 and Figure 7). The z-coordinates also showed increased positive values. The degree of change was in the following ascending order: ½ christa philtri (Chp), labrale superius (LS), and Chp. Along the x-axis, the right and left coordinates showed increasing negative and positive values, respectively.
DISCUSSION
Most previous studies of lip positional changes focused on anteroposterior relationships in the sagittal plane based on Angle's classification and used cephalometric analysis. In one such study,11 1 mm of protraction resulted in 0.1 mm of labial protrusion and 0.8-mm reduction in labial thickness; however, the report does not mention the lip position during radiography. In the present study, we observed greater labial protrusion. Indeed, the finding reflects positional change rather than a change in thickness due to the relaxed lip position.
Patients are likely to be interested not only in their lateral facial view but also in their frontal facial view, because they and others observe the face frontally. Ramos et al.12 observed that the lips move at a similar rate to the maxillary teeth. Jacobs13 observed that the interlabial gap decreases as a result of premolar extraction treatment. However, these studies did not have precise landmarks, because they tried to interpret the soft tissue, a 3D structure, in a two-dimensional way. They had another notable disadvantage: the horizontal movement aspect cannot be recognized. An inherent methodological difficulty is that two-dimensional projection of a 3D structure leads to overlap of the examined structures and distortion of their dimensions. Three-dimensional data offer a higher degree of accuracy because there is less distortion in the projection of lengths, angles, and shapes and less overlap of structures.
According to Gwilliam et al.,14 3D reproducibility of soft tissue varies depending on the landmark and landmarks with well-defined borders or edges showed higher degrees of reproducibility than those on gently curved slopes. The Dahlberg error range in the present study was 0.134-0.254 mm. The high reproducibility can be attributed to the selected landmarks. A line was drawn between the cheilion and Chp on the right ½Chp and left ½Chp to determine the point where the perpendicular line of the midline and the vermillion border met.
Every assessed point tended to move anterosuperiorly when the teeth were positioned anteriorly. On the x-axis, the right points moved rightward and the left points moved leftward. They all showed significant changes in the simple linear regression, except the x-coordinates of LS (Table 3). This point is located on the midsagittal plane and does not accompany anterior crowding; as subjects without asymmetry were used, bilateral movements hardly existed. Because ½Chp showed greater changes in the x-coordinates than Chp on both the sides, we consider that the farther the point is placed from the midsagittal plane, the greater will be the x-coordinate change.
Both the amount of y-coordinate change and the regression coefficient were greater if the landmarks were closer to the midsagittal plane. This is because the perioral muscles meet in the commissural region and have low operability due to the fixed soft tissue. However, the z-coordinates increased in the following order: ½Chp, LS, and Chp. This is the vertical positional order and is affected directly by the teeth. Chp, located at the topmost position, showed the smallest amount of movement on the z-axis.
The difference in movement between the z-axis and the y-axis seems to be the effect of muscles. The muscles working on the upper lip are the levator labii superioris, levator labii superioris alaeque nasi, zygomaticus minor, zygomaticus major, levator anguli oris, and orbicularis oris. Among them, the orbicularis oris, which forms the major part of the upper lip, presses the lips against the teeth. It is a muscle fiber bundle that runs horizontally from the commissures and may be more resistant in the z-axis direction. Therefore, ½Chp showed a similar amount of movement along these axes, Chp moved markedly along the y-axis and LS showed further movement in this direction. A relatively higher coefficient of determination (R2) was noted for the y-axis than for the other axes.
The changing aspects of the soft tissues were measured following the curve of the soft tissues. When obtaining 3D data with a white light scanner, a structure seen as a black area prevents data retrieval. The shade in the stomion region made accurate data collection difficult. Therefore, when setting the curves, the data of the region under the most prominent point of the upper lip were removed and changing aspects of the other parts were measured. Accordingly, the change was concentrated on the lower three-fourth of the curve, rather than the most protrusive point. The upper part of the curve showed smaller changes because it is a fixed region, connected to the nose. The changing aspect of the lower three-fourth of the curve was greater than that of the most protrusive point, and the lower three-fourth of the curve was mostly located in the depression at the upper vermilion border.
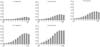
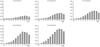
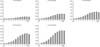
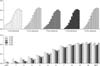
According to Lee et al.,15 after bonding 1.6-2.5 mm brackets, lateral landmarks showed significant lateral changes and the anterior change amount was the greatest for every landmark. We also observed that the lateral landmarks had similar aspects and changes along the z-axis were greater with movement less than 3 mm. However, in the case of movement longer than 3 mm, the lips moved upward and the amount of change in the y-axis was greater. Therefore, in patients with anterior teeth that are positioned anteriorly by over 3 mm, lip incompetency may occur, such as in the Class II division 1 pattern. Wisth16 stated that the lips are decreasingly influenced by retraction of the incisors after a certain point. Rather than the absolute amount of movement of the teeth, the result of measuring the soft-tissue movement ratio in proportion (Figures 10,11,12) is that there is a small difference, but the movement of the lips decreases, followed by an increase starting at 3-mm movement of the teeth. Therefore, for movement within 3 mm, soft-tissue thickness change occurs and positional changes decrease. However, if movement exceeds 3 mm, the positional changes will increase.
A laser scanner obtains 3D image data by projecting the laser slit beam on a 3D object and receiving a distorted image according to the object's surface morphology with a charge-coupled device camera camera. In comparison, a white light scanner scans by projecting white light structuralized using binary film. The white light scanner enables rapid capture and is photorealistic and noninvasive, compared with the laser scanner. However, its resolution quality varies depending on the surrounding situation, so scanning must be performed in a dark room without light distortion.
A limitation of this study is the lack of consideration of the thickness and tension of the lips. The thickness of the lips is difficult to measure in mesh data of a soft-tissue surface. The thickness of the lips and labial surface angles of the teeth could not be measured because additional radiographs were not taken. Talass et al.,17 reported that when the upper lip is thicker preoperatively, retraction of the upper lip increases.
In this study, the coefficient of determination (R2) showed a moderate value of 0.40 to 0.77, except for the amounts of movement of Chp on the z-axis and LS on the x-axis. The reason for this result seems to be that too many factors affect morphologic changes of the lips and individual soft-tissue reactions vary widely. Many previous researchers18,19 reported that the reactions of the teeth and alveolar bone are difficult to predict accurately and individual differences may be factors including facial shape and overjet. However, by controlling several variables, such as lip force, and using the white light scanner with good reproducibility and high accuracy, we obtained some significant results.
CONCLUSION
As teeth move anteriorly, the overlying soft tissues move forward and significantly upward. The amount of movement above the vermilion border is slightly less than half the amount of tooth movement, showing a strong correlation. Most labial movement is concentrated in the depression above the upper vermilion border. The proposed 3D assessment method would be clinically useful to predict soft-tissue positional changes according to tooth movement.


 XML Download