This article has been
cited by other articles in ScienceCentral.
Abstract
Objective
To determine Korean facial profile preferences based on lip position as assessed by Hispanic-Americans of varying western adaptation levels and to determine whether the age and sex of the rater had any influence.
Methods
For this study, 132 Hispanic-Americans and 68 Caucasians of varying age, sex and western adaptation levels volunteered to rate their preference of Korean male and female facial silhouettes having lips ranging from retruding to protruding. The Hispanic-Americans were also asked to complete a Bidimensional Acculturation Scale questionnaire to determine their western adaptation status: low-acculturated Hispanics (LAH; lesser western-adapted Hispanic participants) or high-acculturated Hispanics (HAH; higher western-adapted Hispanic participants).
Results
The LAHs preferred significantly more retruded lip positions (p < 0.05) while HAHs showed some similarities with Caucasian participants in the results for the Korean male profile, even though HAHs preferred more retruded lip positions for the Korean female profile than Caucasians did (p < 0.05). The age and sex of raters did not influence the preference of facial profiles (p > 0.05).
Conclusions
The results of this study suggest that Hispanic-Americans prefer a flatter Korean lip profile. It would be prudent for orthodontists to offer patients the option of altering lip profile through orthodontic and/or orthognathic surgery treatments.
Keywords: Hispanic-American, Western adaptation, Korean facial profile, Orthodontics
INTRODUCTION
Great strides in communication and transportation technologies have contributed to the rapid pace of globalization over the past few decades. As a consequence, the movement of people across the globe and immigration has increased significantly. In 2001, the vast majority of new immigrants in the United States were Latin-Americans and Koreans.
1 In addition, in 2010, the US Census Bureau reported that 53% of all foreign-born US residents were from Latin America, while 28% were from Asia, with the majority coming from East Asia.
2
The public's desire for facial esthetics is increasing, with more patients seeking orthodontic treatment for esthetic reasons.
3 Because the purpose of orthodontic treatment is to achieve functional occlusion, as well as a harmonized and esthetic profile, many studies on the ideal relationship between the soft and hard tissues have been conducted.
4-
7
Studies on facial esthetics have been performed using several methods, and various results have been obtained, depending on region, culture, gender, age, ethnic background, and orthodontic knowledge.
8-
23 Farrow et al.
11 reported a study in which facial profile preference was surveyed among Caucasians, African Americans, general dentists, and orthodontists. When lip protrusion was graphically altered on computer images of some African American facial profiles, there were no differences in the facial profile preferences based on ethnic background, gender, or age. Mantzikos
15 reported that when Japanese facial profile preference was surveyed among Japanese-Americans, there were no differences in the facial profile preference according to age or gender. In contrast, Park et al.
24 evaluated the esthetic preferences of Korean profiles according to age and found a significant difference between the age groups, with the older age groups preferring a more retruded lip profile than the younger age group.
Several facial profile preference studies have been conducted to date
9,
12,
17-
20,
25; however, few have studied the preferences of Hispanic-Americans. When Mejia-Maidl et al.
17 and Nomura et al.
18 studied Mexican-American and Hispanic-American facial profile preferences, respectively, they found that these differed from those of Caucasian-Americans.
In western countries, intercultural interactions, especially between Hispanics and East Asians, are rising and becoming increasingly important. We hypothesized that westernization of Hispanic-Americans has an effect on their facial profile preferences toward east Asians, and therefore on their preferences for Korean facial profiles. The objective of this study was to compare differences in preference of facial profiles based on lip position between low-acculturated Hispanics (LAH; Hispanics with a lower degree of western adaptation), high-acculturated Hispanics (HAH; Hispanics with higher degree of western adaptation), and Caucasians, and to determine whether the age and sex of raters had any influence on their preferences for facial profile types. The results of this study would give orthodontists and their patients' insights into other ethnic groups' preferences for east Asian, specifically Korean, facial profiles and may influence orthodontic treatment decisions.
MATERIALS AND METHODS
Approval to conduct this study was obtained from the institutional review board of A.T. Still University (ATSU), Mesa, AZ, USA. Subjects with normal occlusion (10 men, 10 women with average age of 25.3 years and 23.3 years, respectively) were recruited from Department of Hygiene, Wonkwang University School of Dentistry and Wonkwang Health Science University (Iksan, Korea). Normal occlusion was defined as the presence of Class I canine and molar relationship, no skeletal discrepancy of the maxilla and mandible, no or slight crowding, all permanent teeth except for the third molars, no extensively restored teeth, and no history of orthodontic treatment. Lateral cephalometric radiography and soft tissue tracings were done with the subjects' heads in a natural position, with the lips relaxed in their maximum intercuspal position. V-Ceph™ (Ver. 5.5; Cybermed, Seoul, Korea) cephalometric tracing software was used to measure 4 lines (upper lip to E-line [the esthetic line drawn from the tip of nose to soft tissue pogonion]; lower lip to E-line; upper lip to Sn-Pg' [subnasale-soft tissue pogonion]; lower lip to Sn-Pg') and 2 angles (nasolabial angle [formed by the intersection of a columella tangent and an upper lip tangent] and Z-angle [formed by the intersection of Frankfort horizontal (FH) plane and a line connecting the soft tissue pogonion and the most protrusive lip point of either the lower or upper lip]).
The construction of the silhouettes used in this study is based on Park et al.'s
24 method and is briefly described below. All soft tissue tracings and measurements were conducted by a single investigator (NS Park). A grade was assigned to each of the 6 measured values for each subject: 5 points were assigned if they were within the range of 1 standard deviation (SD); 4 points if within the range of 2 SD; 3 points if within the range of 3 SD; 2 points if within the range of 4 SD; and 1 point if within the range of 5 SD. Three male and three female subjects with the highest scores were then identified. Subsequently, 1 male and 1 female subject who were judged as having the most esthetically pleasing profiles were selected by 3 Korean orthodontists for the construction of the average profile for each sex.
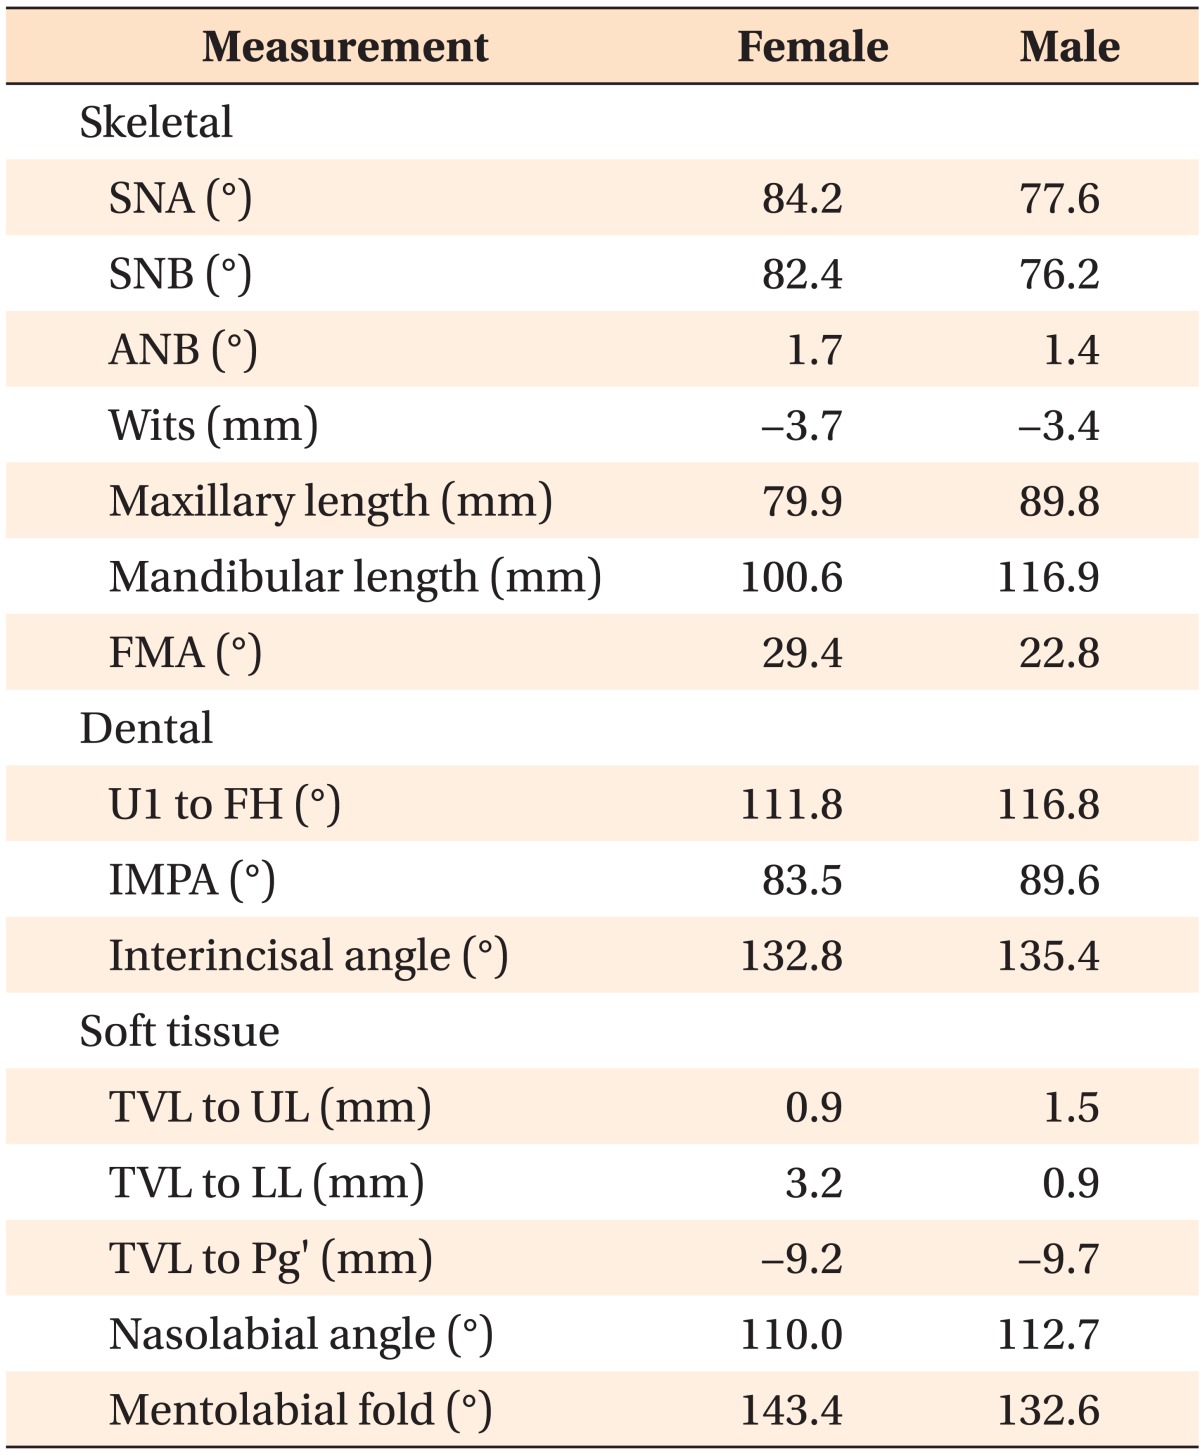
Table 1 shows the cephalometric measurements of the selected male and female profiles.
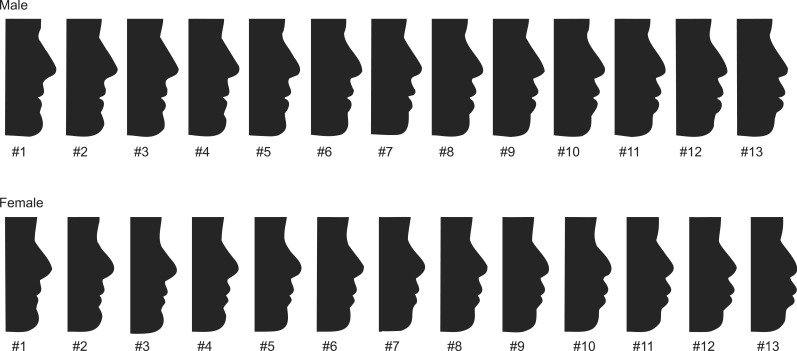
Two sets of silhouettes were produced (male and female), and a total of 13 average silhouettes per set were manufactured by moving the upper lip and lower lip 1 mm anteriorly and posteriorly parallel to the FH plane. For each sex, silhouette #7 was the average, #1 the most retruded lip position, and #13 the most protruded position (
Figure 1).
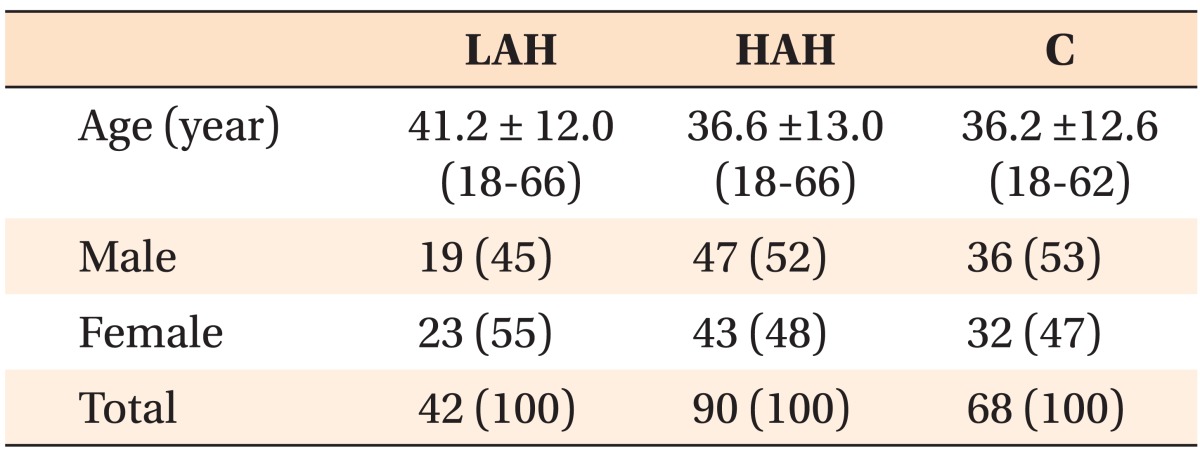
The profile raters were 200 random volunteers aged 18 or older recruited from the waiting rooms of the Arizona School of Dentistry & Oral Health (Mesa, AZ, USA;
Table 2). Dental and allied professionals were excluded from this survey. The respondents were given the option of an English or Spanish language questionnaire form and were asked to rate the 3 most pleasing (most favored, 2nd favored, and 3rd favored) and the least pleasing profiles (least favored) for each sex; respondents were not informed of the ethnic origin of the facial profile silhouettes. They also reported their age, sex, and ethnicity. Respondents of Hispanic origin were also asked to complete a 24 question Bi-dimensional Acculturation Scale (BAS) questionnaire used to decipher their acculturation status. The BAS by Marin and Gamba
26 was used due to its high reliability and validity indexes in determining acculturation status among several Hispanic-American groups including Mexican-Americans and those from Central-American countries. The BAS questionnaire measures Hispanic and non-Hispanic (US culture) domains. A high BAS score on the Hispanic domain suggests a low-acculturation status while a high score on the non-Hispanic domain suggests a high-acculturation status. High scores for both domains suggest biculturalism and was considered to indicate a high-acculturation status for this study. The Caucasian preferences for Korean profiles were used as a reference point due to their majority status and their historical influence on the US culture.
Statistical analysis
The data were analyzed using IBM SPSS Statistics software (version 19.0; IBM Co., Armonk, NY, USA). As already mentioned, the silhouettes were produced by moving the upper lip and lower lip 1 mm anteriorly and posteriorly parallel to the FH plane. Because the intervals between each silhouette represented equal, incremental, and unidirectional changes, the ratings were treated as continuous data and parametric methods were used.
27
Mean values for the most favored, second most favored, third most favored, and least favored male and female lip positions were calculated for each ethnicity/acculturation status separately. Two-way analyses of variance (ANOVAs) were used to check for the presence of interactions between ethnicity/acculturation, age, and profile preference; and ethnicity/acculturation, sex of the reviewers, and their profile preferences. One-way ANOVAs were then used to test for any differences in profile preference between each ethnicity/acculturation group for the first, second, third most favored, and least favored Korean male and female profiles. For all statistical analyses, significance was indicated at p < 0.05.
RESULTS
Response differences by ethnicity or acculturation status
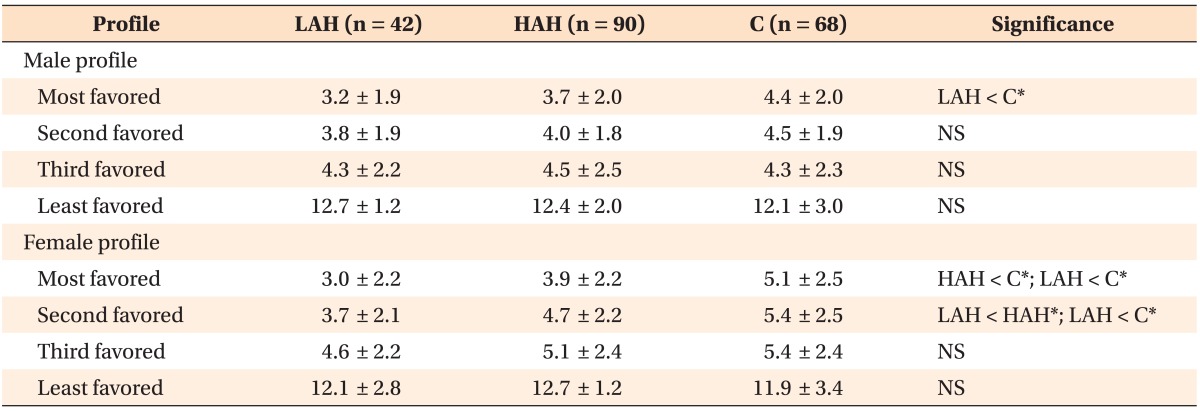
In general, subjects preferred less protruded lips for both male and female profiles. The mean most-favored lip position silhouette for males was 3.7 for HAHs, 3.2 for LAHs, and 4.4 for Caucasians. The mean most-favored male lip silhouette for LAHs was significantly more retruded than was reported for Caucasians (
p < 0.05) (
Table 3 and
Figure 2).
The mean most-favored lip position silhouette for females was 3.9 for HAHs, 3.0 for LAHs, and 5.1 for Caucasians. The mean most-favored female silhouette for both LAH and HAH subjects had significantly more retruded lips than that reported for Caucasians (
p < 0.05) (
Table 3 and
Figure 2).
The mean second-most favored lip position silhouette for females was 4.7 for HAHs, 3.7 for LAHs, and 5.4 for Caucasians. The mean second-most favored female silhouette for LAHs had significantly more retruded lips than that reported for Caucasians (
p < 0.05). Furthermore, the mean second-most favored female silhouette for LAHs was significantly more retruded than that reported for HAHs (
p < 0.05). The least-favored male and female Korean facial profiles were skewed heavily toward profile #13, the most protruded, for all ethnic/acculturation groups (
Table 3 and
Figure 2).
Tables 4 and
5 display the most and least favored lip positions to E-line and Sn-Pg', and nasolabial and Z-angles for each ethnic/acculturation group for male and female Korean profiles, respectively.
Response differences by age, gender, and acculturation
A two-way ANOVA was used to investigate the relationship between facial preference and ethnicity/acculturation and age. It revealed a significant relationship for ethnicity/acculturation with the most-favored male and female profiles and second-most favored female profile (
p < 0.05) but not for age (
p > 0.05). Furthermore, there were no significant interactions (
Table 6). Similarly, another two-way ANOVA found no significant interactions between ethnicity/acculturation and the sex of the respondents for each of the ethnicity/acculturation categories for facial profile preferences (
p > 0.05) (
Table 7).
DISCUSSION
Hispanic-Americans as a group are the largest minority in the United States, accounting for 16.3% of the US population, or 50.5 million residents.
28 However, a review of literature revealed a scant number of studies on the facial profile preferences of Hispanic-Americans. The main purpose of this study was to analyze the effect of westernization of the Hispanic-American preferences for east-Asian lip profiles, especially Korean lip profiles. Previous inter-ethnic studies of African-Americans suggested that, whereas they prefer a less bimaxillary protrusive profile than their own norm, they also preferred a more protrusive profile than the Caucasian norm.
11 The Hispanic norm was also found to be bimaxillary protrusive.
29 By the same line of reasoning as in the Farrow et al.
11 study on African-Americans, our hypothesis was that Hispanic-Americans would prefer a less protrusive profile than their own norm but not as retrusive as the Caucasian norm. However, 2 previous studies
17,
18 found that the preferred lip positions for Hispanic-Americans differ significantly from those of Caucasians in that Hispanic-Americans preferred more retruded lip positions, suggesting that they may be more inclined to change their profile when seeking orthodontic care. Similarly, the present study revealed that Hispanic-Americans preferred a more retruded lip position in male and female Koreans than did Caucasian raters.
In general, although not to a statistically significant degree (except for the second-most favored Korean female profile), LAHs preferred a more retruded lip position than HAHs. Perhaps a larger sample size of the LAH group may elucidate the discrepancy between the higher- and lower-adapted groups.
It seems intuitive that people would prefer faces of people of their own background more than those of other ethnic groups. Yet, this and other studies
11,
17,
18,
21 suggest that the dominant western culture influences people throughout the world toward a flatter profile than the norm of their own racial/ethnic group. Hispanic-Americans have been reported to prefer a flatter profile than the average of their own kind,
17 this study revealed that they also preferred a more retruded Korean lip profile and possibly would prefer the same for other ethnic groups as well. It is interesting to note the choice of the least desirable facial profile by all ethnic and western-adapted groups was that having the most protrusive lip positions for both male and female silhouettes. It appears to be strong evidence that people of different cultures find bimaxillary protrusive profiles to be most unaesthetic. Taken together, this study and the literature suggest that Hispanic-Americans prefer a much more retruded lip position than the usual found among Koreans.
Orthodontists should investigate carefully during the orthodontic screening appointment what the expectations of each patient are as to their desire for a facial profile alteration as well as for an esthetically pleasing and functional smile. Orthodontists may explore the options of facial profile alteration through a number of treatment modalities, including tooth extractions, temporary skeletal anchorage devices, or orthognathic surgery. The present study did not evaluate the socioeconomic status of the raters. Future studies could validate the hypothesis of an increasing trend among Hispanic-Americans, in association with increasing socioeconomic status, to seek orthodontic care because they want to change their facial profile.
In contrast to the findings obtained by Park et al.,
24 we found age was not a significant factor in the preference of Korean lip profiles by all the ethnicity/acculturation groups in our study, which supports the hypothesis that Hispanic-Americans of any age prefer a much more retruded lip position than their own norm. In order to validate our finding that age is not a factor for lip profile preferences, future studies of Hispanic-Americans should include age analysis to verify the influence of age on facial preference. In addition, Park et al.
24 showed that middle-aged and older Koreans prefer a flatter lip profile as compared with the young adult groups. Perhaps the younger Koreans are influenced by western culture similar to the HAHs in our study. Interestingly, all Korean age groups in the Park et al.'s
24 study do not prefer the most protrusive profiles, similar to our study's conclusions.
This study utilized black and white silhouettes without the influence of hairstyles, skin complexion, eye color, and make-up, because such factors might have been distracting. However, future studies could include black and white photographs of models of different ethnicities so a comparison with the silhouette studies could be made. In addition, future studies should include Asian and Asian-American raters for Caucasian, Hispanic-American, and African-American profiles with the hypothesis that there is a difference of facial profile preference between the rater groups, possibly due to westernization.
CONCLUSION
The LAH participants prefer more retruded lip positions of Korean profiles than do Caucasians, whereas the age and sex of raters do not significantly influence lip profile preferences. There is some supportive evidence that western adaptation has influenced the Korean facial profile preference of the HAH, although HAH prefer significantly more retruded profiles as compared with Caucasians. In addition, there is strong consensus that all ethnic groups we studied chose the most bimaxillary protrusive lip positions for both male and female Koreans to be the least esthetically pleasant. Ultimately, it would be prudent for orthodontists to ask their patients if they wish to change their facial profile and their esthetic smile.
ACKNOWLEDGEMENTS
We thank Dr. Na Sun Park for her assistance with manuscript preparation.
References
2. Grieco EM, Revelyan EN. Place of Birth of the Foreign-Born Population: 2009 [Internet]. U.S. Department of Commerce Economics and Statistics Administration, US Census Bureau;2010. 2. cited 2011 Nov. Available at:
www.census.gov/prod/2010pubs/acsbr09-15.pdf.
3. Sarver DM. The esthetic impact of orthodontics: planning treatment to meet patients' needs. J Am Dent Assoc. 1993; 124:99–102. PMID:
8227778.

4. Holdaway RA. A soft-tissue cephalometric analysis and its use in orthodontic treatment planning. Part I. Am J Orthod. 1983; 84:1–28. PMID:
6575614.

5. Holdaway RA. A soft-tissue cephalometric analysis and its use in orthodontic treatment planning. Part II. Am J Orthod. 1984; 85:279–293. PMID:
6585146.

6. Merrifield LL. The profile line as an aid in critically evaluating facial esthetics. Am J Orthod. 1966; 52:804–822. PMID:
5223046.

7. Burstone CJ. Lip posture and its significance in treatment planning. Am J Orthod. 1967; 53:262–284. PMID:
5227460.

8. Chan EK, Soh J, Petocz P, Darendeliler MA. Esthetic evaluation of Asian-Chinese profiles from a white perspective. Am J Orthod Dentofacial Orthop. 2008; 133:532–538. PMID:
18405817.

9. Czarnecki ST, Nanda RS, Currier GF. Perceptions of a balanced facial profile. Am J Orthod Dentofacial Orthop. 1993; 104:180–187. PMID:
8338071.

10. De Smit A, Dermaut L. Soft-tissue profile preference. Am J Orthod. 1984; 86:67–73. PMID:
6588762.

11. Farrow AL, Zarrinnia K, Azizi K. Bimaxillary protrusion in black Americans-an esthetic evaluation and the treatment considerations. Am J Orthod Dentofacial Orthop. 1993; 104:240–250. PMID:
8362785.

12. Foster EJ. Profile preferences among diversified groups. Angle Orthod. 1973; 43:34–40. PMID:
4509525.
13. Ioi H, Shimomura T, Nakata S, Nakasima A, Counts AL. Comparison of anteroposterior lip positions of the most-favored facial profiles of Korean and Japanese people. Am J Orthod Dentofacial Orthop. 2008; 134:490–495. PMID:
18929266.

14. Kuroda S, Sugahara T, Takabatake S, Taketa H, Ando R, Takano-Yamamoto T. Influence of anteroposterior mandibular positions on facial attractiveness in Japanese adults. Am J Orthod Dentofacial Orthop. 2009; 135:73–78. PMID:
19121504.

15. Mantzikos T. Esthetic soft tissue profile preferences among the Japanese population. Am J Orthod Dentofacial Orthop. 1998; 114:1–7. PMID:
9674673.

16. McKoy-White J, Evans CA, Viana G, Anderson NK, Giddon DB. Facial profile preferences of black women before and after orthodontic treatment. Am J Orthod Dentofacial Orthop. 2006; 129:17–23. PMID:
16443473.

17. Mejia-Maidl M, Evans CA, Viana G, Anderson NK, Giddon DB. Preferences for facial profiles between Mexican Americans and Caucasians. Angle Orthod. 2005; 75:953–958. PMID:
16448237.
18. Nomura M, Motegi E, Hatch JP, Gakunga PT, N'gang'a PM, Rugh JD, et al. Esthetic preferences of European American, Hispanic American, Japanese, and African judges for soft-tissue profiles. Am J Orthod Dentofacial Orthop. 2009; 135(4 Suppl):S87–S95. PMID:
19362272.

19. Park YS, Evans CA, Viana G, Anderson NK, Giddon DB. Profile preferences of Korean American orthodontic patients and orthodontists. World J Orthod. 2006; 7:286–292. PMID:
17009479.
20. Polk MS Jr, Farman AG, Yancey JA, Gholston LR, Johnson BE, Regennitter FJ. Soft tissue profile: a survey of African-American preference. Am J Orthod Dentofacial Orthop. 1995; 108:90–101. PMID:
7598111.

21. Shimomura T, Ioi H, Nakata S, Counts AL. Evaluation of well-balanced lip position by Japanese orthodontic patients. Am J Orthod Dentofacial Orthop. 2011; 139:e291–e297. PMID:
21457834.

22. Tufekci E, Jahangiri A, Lindauer SJ. Perception of profile among laypeople, dental students and orthodontic patients. Angle Orthod. 2008; 78:983–987. PMID:
18947285.

23. Türkkahraman H, Gökalp H. Facial profile preferences among various layers of Turkish population. Angle Orthod. 2004; 74:640–647. PMID:
15529499.
24. Park NS, Park JH, Bayome M, Mo SS, Kim Y, Kook YA. An evaluation of preferred lip positions according to different age groups. Int J Oral Maxillofac Surg. 2013; 42:637–642. PMID:
23141151.

25. Giddon DB, Sconzo R, Kinchen JA, Evans CA. Quantitative comparison of computerized discrete and animated profile preferences. Angle Orthod. 1996; 66:441–448. PMID:
8974180.
26. Marin G, Gamba RJ. A new measurement of acculturation for Hispanics: The Bidimensional Acculturation Scale for Hispanics (BAS). Hisp J Behav Sci. 1996; 18:297–316.

27. Snedecor G, Cochran W. Statistical methods. 8th ed. Ames: Iowa State University Press;1989.
29. Garcia CJ. Cephalometric evaluation of Mexican Americans using the Downs and Steiner analyses. Am J Orthod. 1975; 68:67–74. PMID:
1056145.


 PDF
PDF ePub
ePub Citation
 Print
Print


 XML Download