

 PDF
PDF ePub
ePub Citation
 Print
Print


INTRODUCTION
Cephalometric analysis has been a key element in diagnosis and treatment planning for orthodontic and orthognathic surgery patients. However, errors in identification of landmarks, their projection in two dimensions, superimposition of anatomical structures, and implications relative to head orientation have raised questions about the reliability of the analyses.1,2 Therefore, several methods have been attempted to achieve a three-dimensional (3D) evaluation from the two-dimensional (2D) cephalographs.3-5
Recently, several advantages of cone-beam computed tomography (CBCT) have been reported, including the ability to assess an image from the three planes, the ability to obtain life-sized 3D images, and the lack of distortion or overlapping structures.6 Moreover, it is not essential to make a fine adjustment of head position during imaging and analysis, because the points maintain their spatial relationships.7 Some authors have reported ease of landmark identification and high precision of superimposing images with CBCT.8,9
van Vlijmen et al.10,11 have reported clinically relevant differences between angular measurements taken from 2D postero-anterior cephalographs and those from radiographs or 3D models constructed from CBCT scans. Gribel et al.12 concluded that measurements taken from a conventional lateral cephalogram were significantly different than those taken from a CBCT scan of the same person. Therefore, they presented a mathematical formula to enable the correction of 2D into 3D CBCT measurements.
Several investigators have attempted to develop 3D analyses to cope with the huge amount of information provided by the 3D technologies. Farronato et al.13 proposed a 10-point 3D analysis of CBCT images directly digitized on the rendered view. They evaluated the reliability and reproducibility of their method and compared their results to 2D data. However, norms of the variables were not reported in their study, probably because of the small sample size and wide range in age. Cheung et al.14 reported 3D cephalometric norms on the basis of CBCT scans from a Chinese population. However, there was no assessment of the relationships among the cephalometric variables and no attempt to evaluate the curved nature of the mandible and maxilla. The aims of this study were to assess new 3D cephalometric variables from a normal occlusion sample and to evaluate the relationships among skeletal and dentoalveolar variables through a 3D cephalometric analysis.
MATERIALS AND METHODS
Thirty-eight Korean young adults (18 men and 20 women; 22.6 ± 3.2 years) with normal occlusion were recruited from the College of Dentistry, Wonkwang University (Iksan, Korea), and the Nursing School, The Catholic University of Korea (Seoul, Korea). Approval for this study was obtained from the Institutional Review Board of The Catholic University of Korea, Catholic Clinical Research Coordinating Center (IRB No. KC11EASE0182), and informed consent was obtained according to the Declaration of Helsinki.
The inclusion criteria were as follows: 1. Balanced facial appearance decided by agreement of 2 independent orthodontists; 2. Class I skeletal relationship; 3. Class I molar and canine relationship; 4. Full permanent dentition with the exception of the 3rd molars; 5. 1- to 3-mm arch length discrepancy in each jaw; 6. Normal curve of Spee of 0 to 2 mm; 7. Absence of dental rotation; 8. Coincidental facial and dental midlines; 9. Absence of extensive restorations involving the proximal areas or the labial surfaces; 10. No previous orthodontic treatment; and 11. No acute or previous temporomandibular disorder.
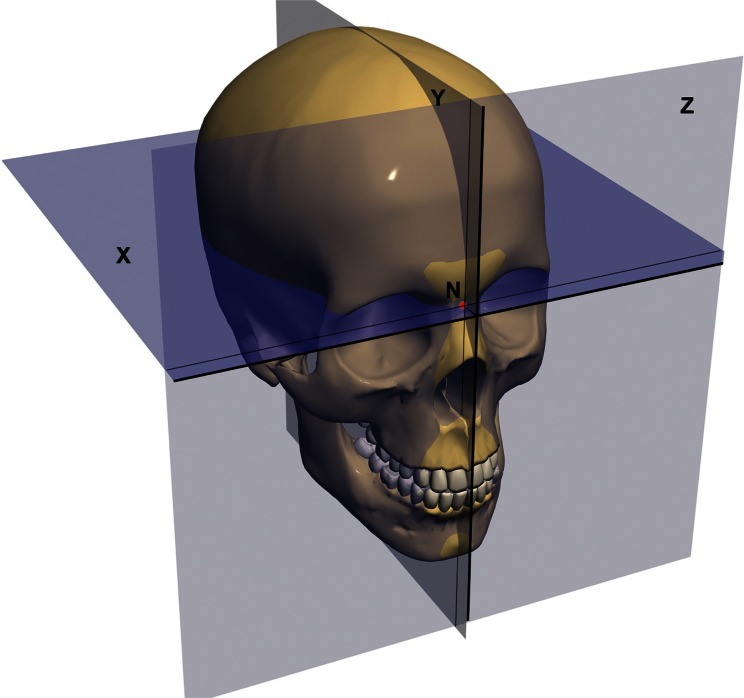
The CBCT scans were acquired with an Alphard 3030 (Asahi Roentgen Ind. Co. Ltd., Kyoto, Japan) machine. Subjects were positioned such that the soft-tissue contours of their faces were included in the scan. The following settings were applied: 80 kV; 5.00 mA; field of view, 200 × 179 mm; exposure time, 17 s; and voxel size, 0.39 mm. The voxels were exported in the digital imaging and communications in medicine (DICOM) format. Invivo 5.1 (Anatomage, San Jose, CA, USA) software was used to reconstruct the voxels, view, digitize, and measure the CBCT scans. First, reorientation of the head position of each scan was performed. Nasion (N) was selected as the origin of the X, Y, and Z coordinates. The horizontal plane (X) was the plane passing through N and parallel to the plane defined through the right and left orbitales (Or) and the left porion (Po), while the midsagittal plane (Y) was defined as the perpendicular plane passing through the origin N and anterior nasal spines (ANS). The vertical plane (Z) was perpendicular to both X and Y passing through N (Figure 1).
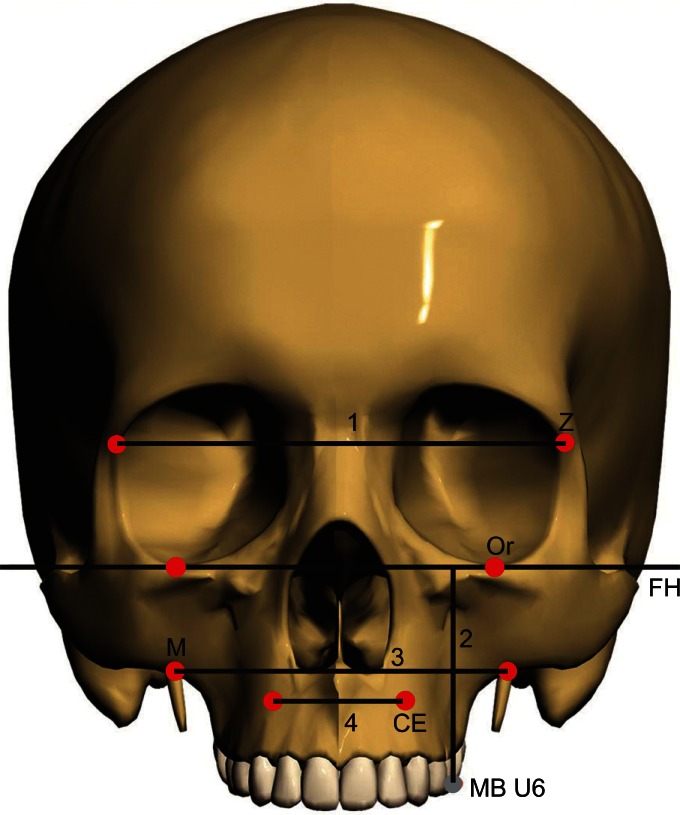
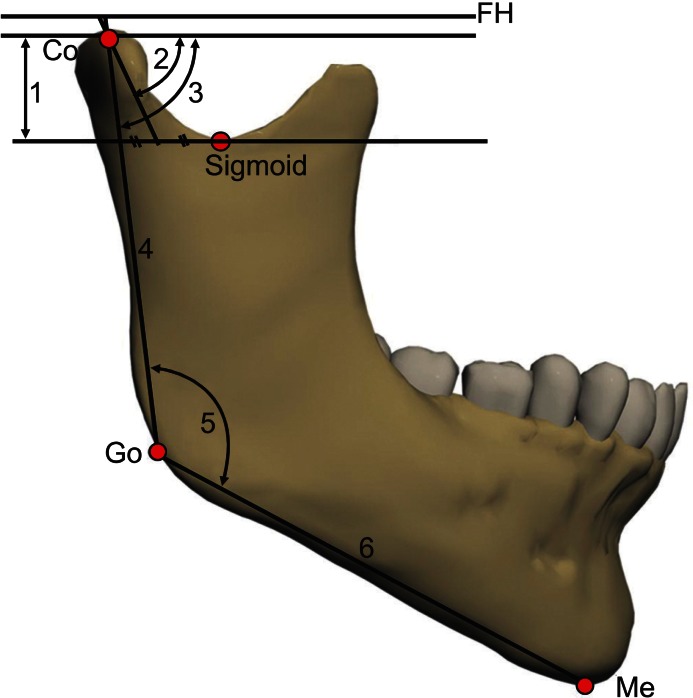
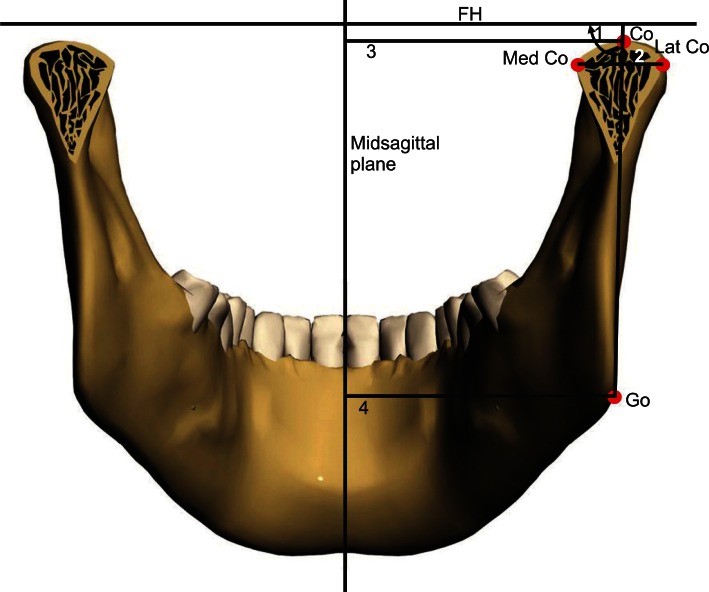
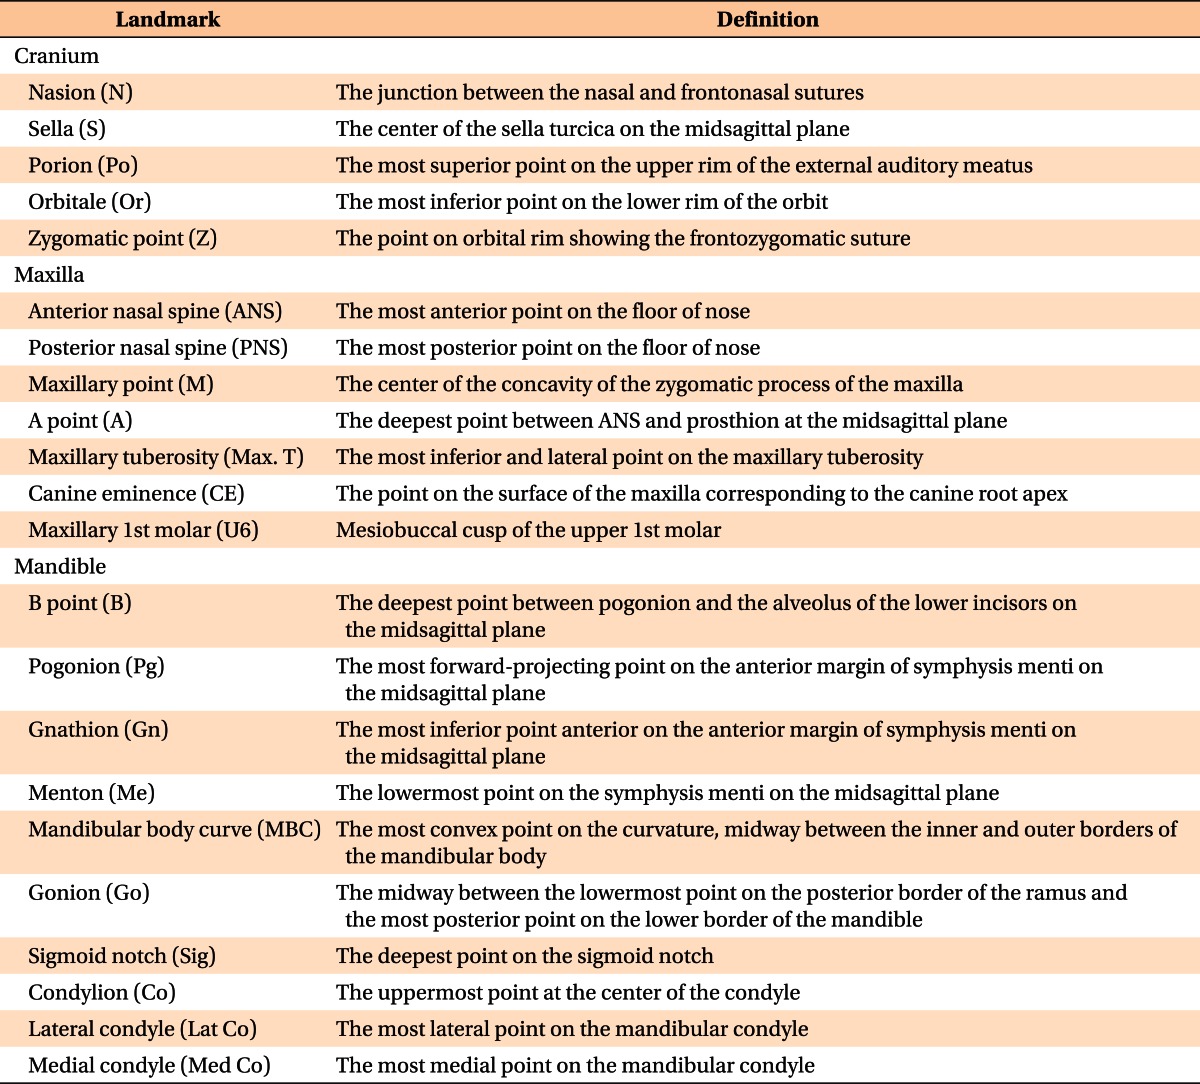
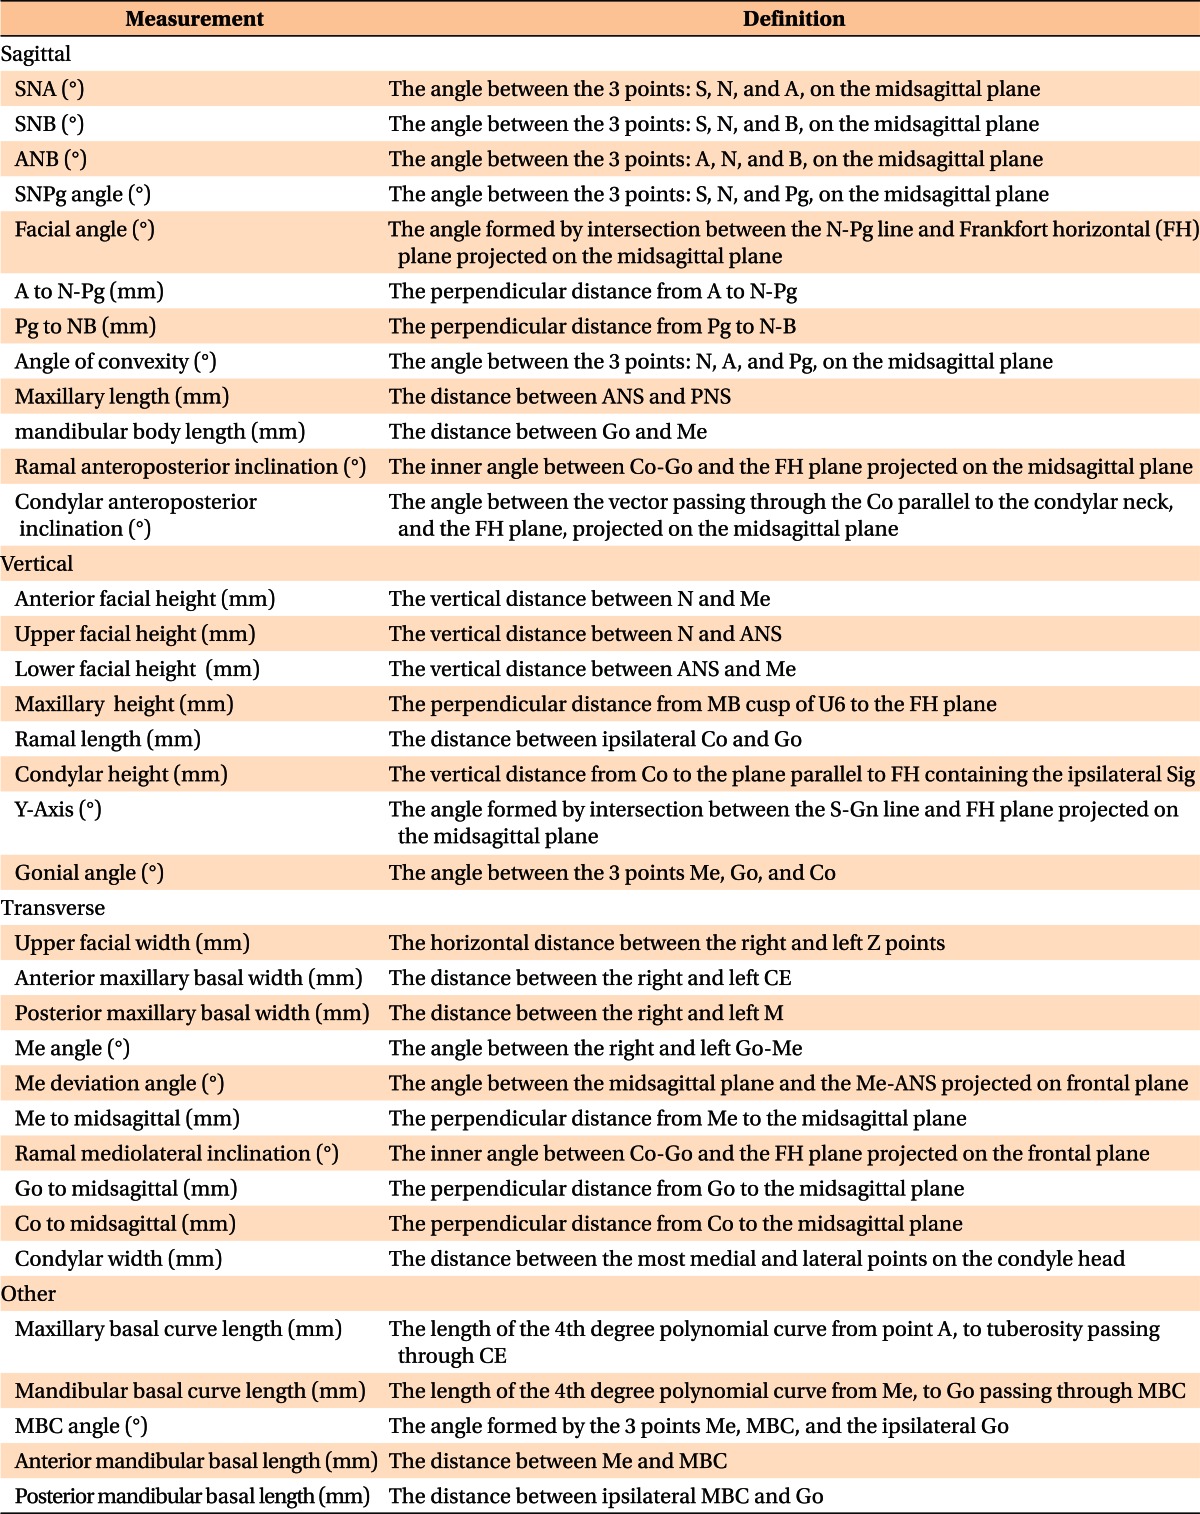
Table 1 shows the definition of the hard- and soft-tissue landmarks digitized on the 3D-rendered view of the images. The software calculated the linear and angular dimensions between certain landmarks, according to the definitions given in Figures 2 - 5 and Table 2.
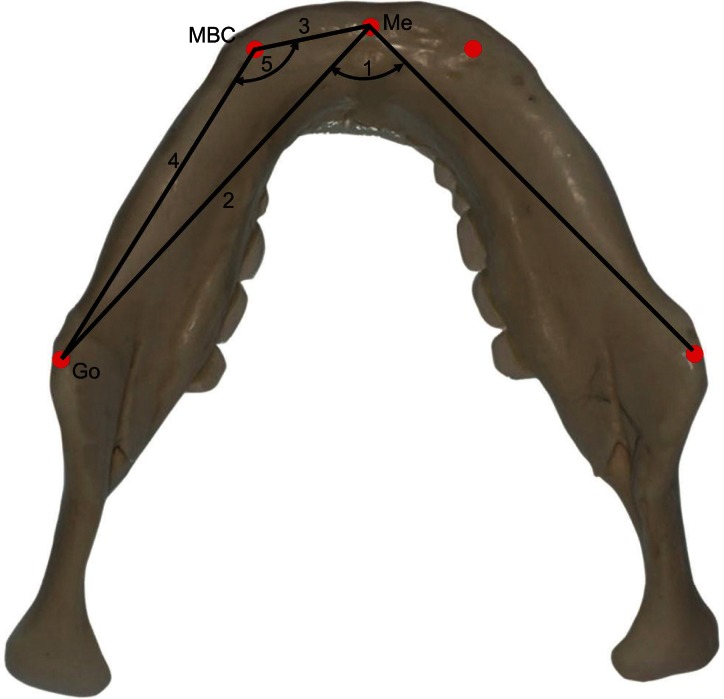
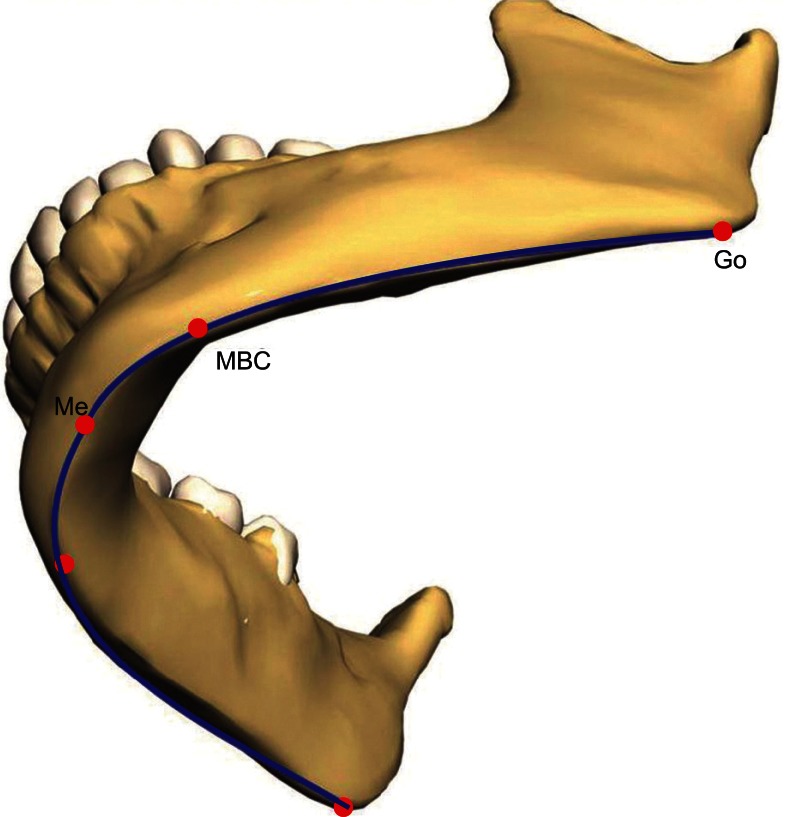
To calculate the mandibular body curve (MBC) length, the coordinates of the menton (Me) and the right and left gonion (Go) and MBC points, which lie on the most convex point on the curvature of the mandibular body midway between the inner and outer borders (Figure 5), were entered into a mathematical software (MATLAB® 7.5 [R2007b]; The MathWorks Inc., Natick, MA, USA). Each set of data was translated to position the Me in the origin point. Then, the set was rotated around the X-axis until the Z coordinate of the Go was nullified. The 4th-degree polynomial equation f(x) of the best fitting curve that passed through the 5 points was generated as an approximation of the curvature of the mandibular body.
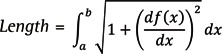
It was found that the polynomial of the 4th order approximated the curvature of the mandibular body with tolerable, or even negligible, mean square error. Mathematically, the length of a path from point a to point b on a curve represented by the function f(x) is given as follows:
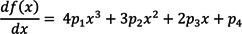
Then, the equation was entered into Maple™ 11.0 (Waterloo Maple Inc., Waterloo, ON, Canada) software to calculate the differentiation of the function f(x):
Then, the length of the curve from Go to Me was found by solving the integration:
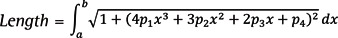
Where a and b are the values of X coordinates of Me and Go, respectively (Figure 6).
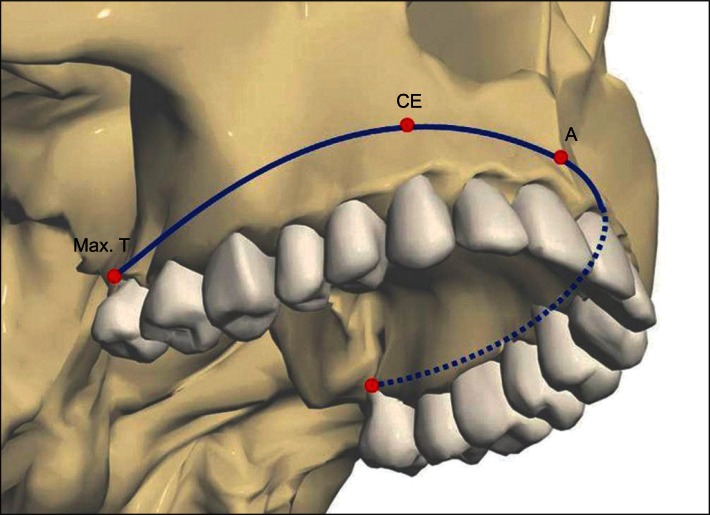
The same procedures were followed to calculate the length of the curve of the basal arch of the maxilla by incorporating the A point, right and left canine eminence, and maxillary tuberosity, where a and b in the equation are the values of X coordinates of A point and maxillary tuberosity, respectively (Figure 7).
Statistical analysis
Statistical evaluation was performed using SPSS software ver. 16.0 (SPSS Inc., Chicago, IL, USA). Normal distribution of the parameters was assessed by the Kolmogorov-Smirnov test. Right and left variables were compared by a paired t-test. Gender dimorphism was evaluated by an independent samples t-test. Correlations among skeletal and dentoalveolar measurements were calculated by means of Pearson's correlation coefficient. To assess the reliability of the digitizing process, 10 CBCT scans were redigitized by the same operator, 2 weeks later. The intraclass correlation coefficient (ICC) between the duplicate measurements showed high reliability (ICC ranged between 0.997 and 0.931).
RESULTS
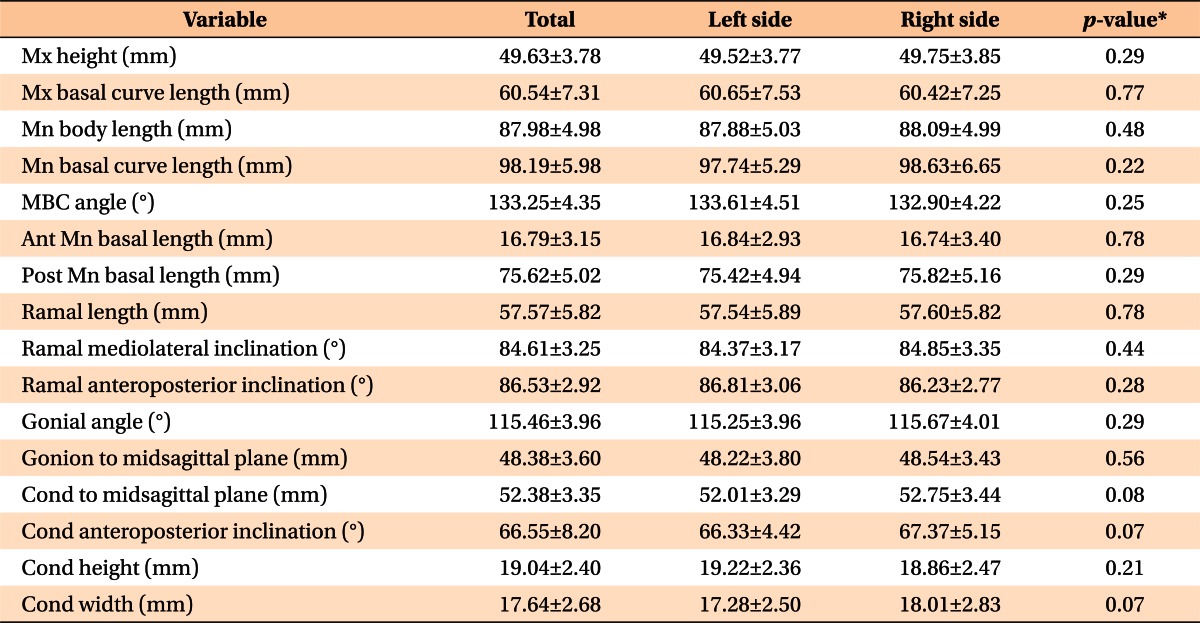
There were no significant differences in skeletal and dentoalveolar variables between right and left sides. Therefore, the values of both sides were combined before further analysis (Table 3).
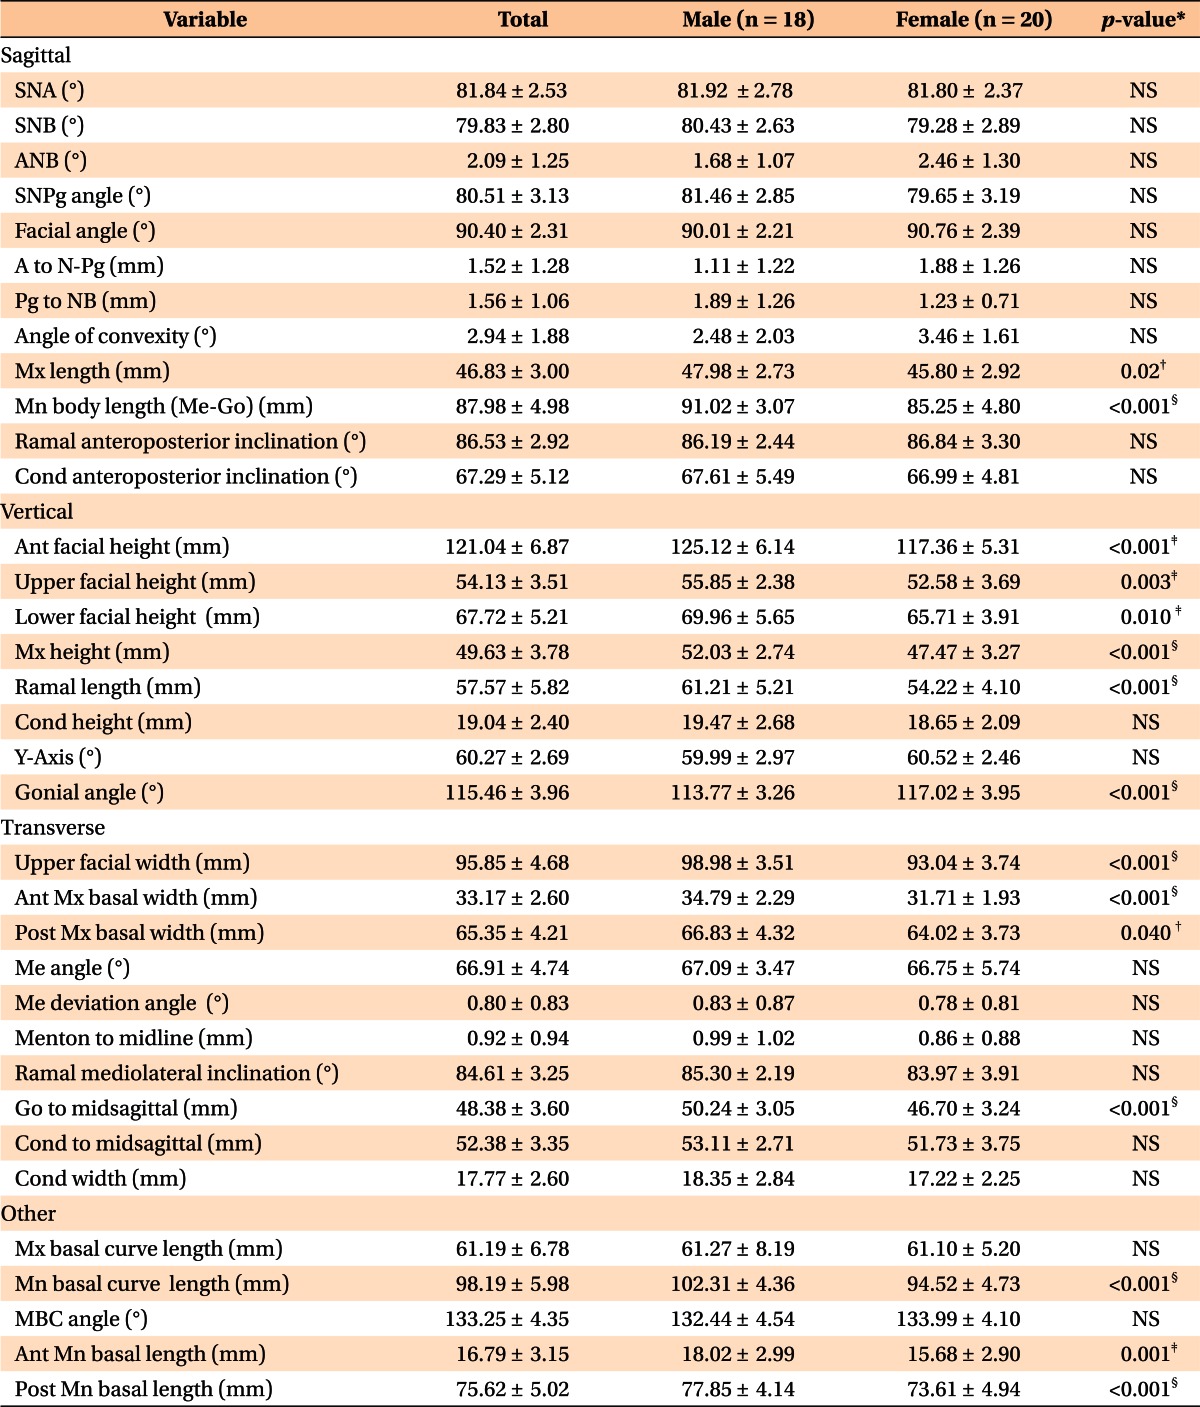
There were no significant differences in the variables that assess the sagittal relationship between the cranial base, maxilla, and mandible between male and female subjects. However, all vertical dimension variables and some transverse variables - upper facial width (p < 0.001), anterior and posterior maxillary basal width (p < 0.001, p = 0.04, respectively), and Go-to-midsagittal (p < 0.001) - were significantly different according to gender. Nevertheless, such differences were absent in both condylar width and the condyle-to-midsagittal dimensions.
The basal curve of the mandible showed a longer curve length in male subjects (102.31 mm) than in female subjects (94.52 mm) (p < 0.001), but there was no significant difference in the maxillary basal curve length (61.19 mm) (Table 4).
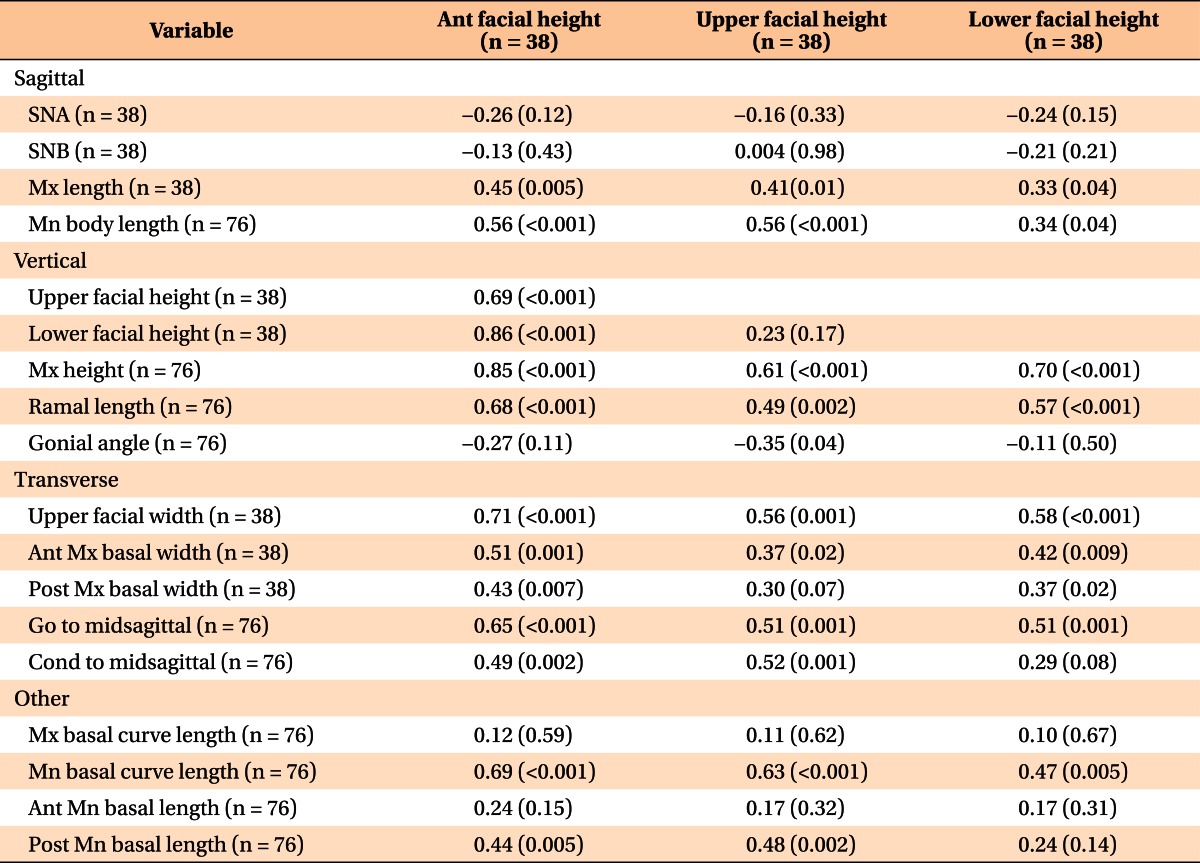
Table 5 shows the correlations among facial heights and several skeletal and dentoalveolar variables. The anterior, upper, and lower facial heights had strong to moderate correlations15 with upper facial width (r = 0.71, 0.56, and 0.58, respectively), the Go-to-midsagittal measurement (r = 0.65, 0.51, and 0.51, respectively), and MBC length (r = 0.69, 0.63, and 0.47, respectively). Moreover, the 3 facial heights showed moderate-to-weak correlations with maxillary length (r = 0.45, 0.41, and 0.33, respectively) and anterior maxillary basal width (r = 0.51, 0.37, and 0.42, respectively), but there were no significant correlations with the maxillary basal curve length or the anterior mandibular body length.
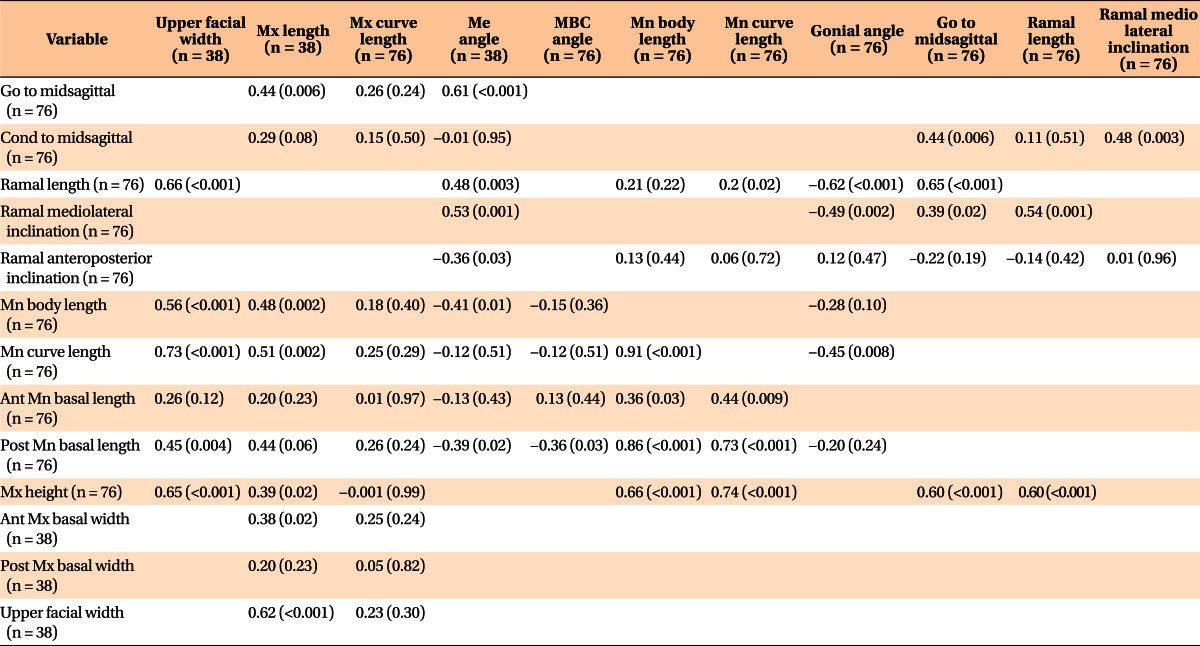
Regarding the correlations among other skeletal variables, the upper facial width had significant moderate correlations with ramal length, mandibular basal curve length, and maxillary height and length (r = 0.66, 0.73, 0.65, and 0.62, respectively). The maxillary length had moderate correlations with mandibular basal curve length and Go-to-midsagittal measurement (r = 0.51, and 0.44, respectively). In addition, the ramal length demonstrated a significant moderate correlation with the Me angle and a negative correlation with the gonial angle (r = 0.48 and -0.62, respectively) (Table 6).
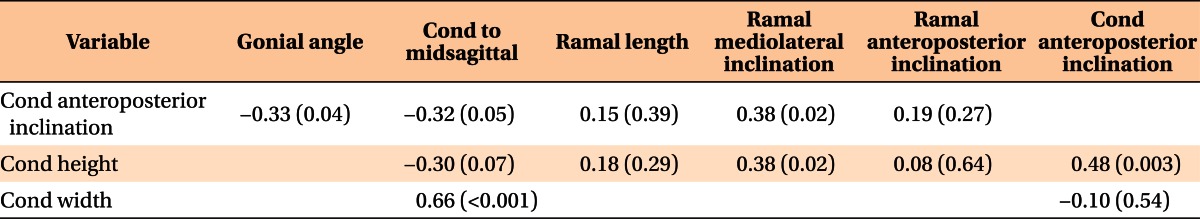
The relationship between the condylar and ramal variables is shown in Table 7. The condylar height was correlated with the ramal mediolateral (r = 0.38), but not with the anteroposterior, inclination. However, it correlated with the condylar anteroposterior inclination (r = 0.48), and the condylar inclination had a weak negative correlation with the gonial angle (r = -0.33).
DISCUSSION
The 3D evaluation of cephalometric variables assists clinicians in obtaining enhanced diagnosis and in treatment planning. Traditionally, 2D cephalometric analyses suffer from inherent drawbacks related to the 2D technique, which may have led to errors in their norms. Therefore, 3D analysis may represent the key to overcoming these weaknesses.
Cheung et al.14 evaluated the mandibular body length from Me to Antegonion and from Me to Go. However, they overlooked the assessment of the curved nature of the mandible and maxilla. Lee et al.16 proposed the MBC point and reported a significant difference between the asymmetric and normal occlusion groups in the posterior mandibular body length, but this difference was not significant in the mandibular body length (Me-Go).
In our study, a new approach was applied to evaluate the curve length of the mandibular body by calculating the length of the curve passing through Me, MBC, and Go to achieve a more accurate representation of the length of the mandibular body instead of using an approximation of the curve with a line. The maxillary and mandibular curve lengths might guide clinicians in treatment planning by shedding light on the limits of the basal arches that enclose the teeth. In addition, it might be useful to use the 2 equations of the curves for arch coordination. Therefore, the 3D analysis of CBCT images requires deeper understanding of mathematics, spatial geometry, trigonometry, and algebra.
Previous 2D evaluations of the Korean cephalometric norms have been conducted.17 Although the angular values in those evaluations were close to ours, the linear measurements were different. The mandibular body length was 78.5 mm in male subjects in that 2D study, but 91 mm in ours. This difference was because the previous definition of the mandibular body length (Me-Go) became deficient when applied in 3D. In addition, the ramal height of male subjects in the Lee's17 study was 56.8 mm, whereas in ours, it was 61.2 mm. This might be because it was measured from the articulare in the 2D study, but in ours it was measured from the condylion. This was due to the nature of the 3D image, in which there is no intersection between the cranial base and the ramus.
A previous study using 3D analysis reported normal values of selected cephalometric variables, but no attempt was made to evaluate the relationships among these variables.14 In our study, significant strong-to-moderate correlations of facial heights were noticed with several transverse variables, such as upper facial width and Go-to-midsagittal measurement as shown in Table 5. Moreover, the upper facial width had strong-to-moderate correlations with the maxillary height and length and MBC length. These findings may suggest the existence of relationships among facial dimensions in the normal-occlusion sample.
Regarding the condyle, You et al.18 suggested that the condylar unit, consisting of condyle, condylar neck, and part of the ramus, plays a central role in mandibular asymmetry, whereas Huntjens et al.19 found condylar asymmetries did not correlate well with facial asymmetry. In our study, the reported correlation between the condylar and mandibular variables might be attributed to the adaptive capacity of the condyle, as suggested by Enlow and Hans.20 For example, in Table 7, the negative correlation between the condylar anteroposterior inclination and the gonial angle tends to preserve the proportion between the height of the mandible and its sagittal position in the normal occlusion population.
Recently, the difference in ramal length from one side to the other was reported as a characteristic of both mandibular-retrusion and prognathism groups.21 In Table 6, the ramal length demonstrated a significant moderate negative correlation with the gonial angle (r = -0.62). This means that the longer the ramus, the smaller its angle with the mandibular body. This configuration can be a way to prevent elongation of facial height, but a deviation on one side from this relationship may result in facial asymmetry.
In our results, there was no significant difference between the right and left sides. However, Shah and Joshi22 reported asymmetry in the normal occlusion population with pleasing facial features. This discrepancy might be the result of difficulties in landmark identification in their study, due to superimposition of anatomical structures.
In our study, the comparison between male and female subjects showed significant differences in several vertical and transverse measurements, but there were no significant differences in the sagittal dimensions. These results were in agreement with Thilander et al.,23 who reported that the linear craniofacial measurements were larger in male subjects than in female subjects, while angular measurements showed no statistical differences. This might suggest that the dimensions of the face played a major role in the gender dimorphism.
In a comparison of our data with the data obtained by Cheung et al.14 study, facial height and lower facial height were larger in the Korean group than in the Chinese, whereas the upper facial height was smaller in Koreans. This can be attributed to ethnic differences and the different landmarks. In addition, the facial angle (Frankfort to nasion-pogonion angle) in Koreans was larger than that of the southern Chinese population (90° vs. 86.7°, respectively), implying a more protrusive chin in our sample. Meanwhile, SNA (sella-nasion-A point) and SNB (sella-nasion-B point) were more protrusive in the Chinese population (84.9° vs. 81.4°, respectively).
We limited our subject base to young adults to eliminate the effect of growth, because changes in facial features by age have been reported.23,24 In addition, our method used for digitization of the CBCT images might be technique sensitive. Further studies are recommended to evaluate the operator learning curve, the reliability of the measurements, the predictors of the correlated variables, and the norms for different ethnic groups.
CONCLUSION
This study has assessed new measurements and evaluated the relationships among skeletal and dentoalveolar variables obtained through 3D cephalometric analysis in a normal occlusion sample. The normative values of new 3D cephalometric parameters, including the maxillary and mandibular curve length, were obtained. Strong-to-moderate correlation values were shown between several vertical and transverse measurements, indicating the existence of relationships between different facial dimensions in a normal occlusion group. This result can be useful for accurate diagnosis and treatment planning and for evaluation of treatment outcomes of orthodontics or orthognathic surgery.
 XML Download