

 PDF
PDF ePub
ePub Citation
 Print
Print


INTRODUCTION
The nasopharyngeal airway includes the adenoids, which are a complex network of lymphatic tissues located in the posterior portion. In growing children, predisposing factors such as repeated infections or inflammation can lead to adenoid hypertrophy and constriction of the posterior airway.1 Children with narrowed nasopharyngeal airways tend to exhibit mouth breathing due to a partially impaired nasal respiratory function. In these children, long-term changes in respiratory patterns could cause disruptions in the balance of muscular activities, contribute to dental malocclusions, and affect craniofacial development.2,3
In this context, assessment of the respiratory system is required to detect respiratory function impairment. However, there is little agreement on the most ideal method for evaluating adenoid size and the degree of nasopharyngeal airway obstruction. Nasopharyngoscopy and lateral cephalometric radiographs are the most valuable modalities to assess the nasopharyngeal airway.4 Nasopharyngoscopy enables direct visualization of the nasopharyngeal airway and is considered to be an accurate diagnostic tool; however, it is invasive and difficult to perform in children who may not tolerate the procedure.5
In contrast, lateral cephalometric radiography is an easily applicable, noninvasive, and objective method for detecting nasopharyngeal airway obstruction.6,7 Therefore, it has been frequently used to briefly assess adenoid size and determine the necessity for adenoidectomy. Several studies have reported that the adenoid-to-nasopharyngeal (AN) ratio obtained through lateral cephalometric radiographs is reliable for assessing the nasopharyngeal airways and correlates with the findings obtained in other modalities of direct visualization of the nasopharyngeal airway, such as endoscopic examination.4,8
However, the primary limitation of these imaging methods is that the three-dimensional (3D) structure of the airway is represented as a two-dimensional (2D) image. On lateral films alone, the exact soft tissue structures are undetectable, and volumetric assessment is impossible because the overlap of numerous structures can lead to great variations in the airway on the 2D images.9 In addition, it is difficult to evaluate the airway from various angles, such as frontal and sagittal views.
Therefore, 3D analysis of the airway shape and possible airway obstruction is important. Cone-beam computed tomography (CBCT), which has been commonly used in dentistry, can provide high-quality images for analyzing the oral and maxillofacial regions with lower costs and a 76.2% to 98.5% lower radiation dose (29 - 477 µSv) than that of conventional CT (approximately 2,000 µSv).10 CBCT can visualize the various internal anatomic structures and help in calculating the cross-sectional measurements on the sagittal, frontal, and axial slices as well as the total volumes.
It is important to use a method that is accurate, noninvasive, and easily applicable for assessing the nasopharyngeal airway. Therefore, in this study, we aimed to (1) assess the shape and size of the nasopharyngeal airway in cross-sectional images and (2) evaluate the correlation between the nasopharyngeal airway shape and the degree of adenoidal hypertrophy as determined by the AN ratio.
MATERIALS AND METHODS
Patients
This study protocol was approved by the Ethics Review Committee at Hallym University Kangdong Sacred Heart Hospital (IRB 09-111), and informed consent was obtained from the parents of the enrolled subjects. The sample group consisted of 64 healthy children (29 boys and 35 girls; age, 8 to 13 years; mean age, 11.03 ± 1.78 years) who visited the Department of Orthodontics, Hallym University Kangdong Sacred Heart Hospital (Seoul, Korea) from December 2008 to November 2009. Children with congenital anomalies, such as cleft lip and palate or abnormal nasopharyngeal shape, were excluded. Subjects who had undergone surgeries previously, including adenoidectomies, tonsillectomies, or both, were also excluded.
CBCT assessment
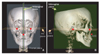
CBCT scans were taken with maximum intercuspation. The subject was seated on a chair; positioned in a natural head position (mirror position); and was asked not to swallow, breathe, or move the head or tongue. Children were instructed to wear a thyroid collar while the CBCT was performed. All CBCT images were obtained with the Master 3D dental imaging system (Vatech Inc., Seoul, Korea) with the following parameters: 90 kV, 3.6 mAs, 15-second scan time, and 20 × 19 cm field of view. The slice thickness was set at 0.3 mm, and the voxel size was 0.3 × 0.3 × 0.3 mm. The 3D images were transformed to the DICOM (Digital Imaging and Communications in Medicine) format and reconstructed with the InVivoDental software (Anatomage Inc., San Jose, CA, USA). Then, on multiple planar reconstruction (MPR) images, they were reoriented using the Frankfurt (FH) plane as the horizontal reference plane. The FH plane was constructed from the midpoint between the right and left porions and both right and left orbitales. The frontal plane was set to be perpendicular to the horizontal plane, including both orbitale points. In addition, the midsagittal plane was constructed through the anterior nasal spine (ANS) and perpendicular to the horizontal plane (Figure 1).
The cross-sectional measurements of the nasopharyngeal airway on the adenoid plane were defined and calculated. We also measured the nasopharyngeal airway volume (Vol) by using the InVivoDental software. Because the airway is a void space surrounded by hard and soft tissues, an inversion of the 3D rendered image was taken to convert negative values to positive values, and vice versa. A targeted airway section was isolated by removing any unnecessary structures. The threshold value was established in a range from -1,024 to -300 Hounsfield units to isolate the nasopharyngeal airway space.
Statistical analysis
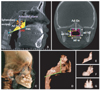
The same investigator (O.K.M.) obtained 4 nasopharyngeal airway measurements (width, ad-w; height, ad-h1 and ad-h2; and cross-sectional area, ad-CSA; Table 1) in the frontal section and 3 (distance between the outermost point of convexity of the adenoid shadow and the sphenobasiocciput, A; distance between the sphenobasiocciput and the posterior end of the hard palate, N; and convex adenoid distance, CAD) in the sagittal section, as well as the nasopharyngeal airway Vol. This procedure was repeated twice (Table 1). To assess the errors, all 3D images were remeasured 1 week after the first evaluation.
The mean values and standard deviations were calculated. Using PASW Statistics 17.0 for Windows (IBM Co., Armonk, NY, USA), we tested for the normality of the distributions by setting the alpha value at a 0.05 level of significance for all continuous variables.
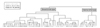
A group average method for cluster analysis was performed with the measurements of the nasopharyngeal airway (ad-w, ad-h1, and ad-h2) on the adenoid plane, which excluded multicollinearity. On the basis of the resulting dendrogram, we divided the nasopharyngeal airway shapes into the following types: broad and thick (BT) and narrow and flat (NF). All measurements of the nasopharyngeal airway were compared between the BT and NF groups by using independent t-tests to determine the intergroup similarities and the characteristics of the different nasopharyngeal airway shapes. In addition, Pearson's correlation coefficients were calculated to assess interrelationships among the variables of the nasopharyngeal airway.
The χ2 test was performed to evaluate the relationship between the nasopharyngeal airway shapes in the frontal plane and the degree of adenoid hypertrophy, as determined by the AN ratio.
RESULTS
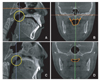
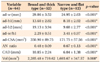
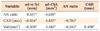
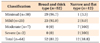
The subjects were divided into the BT airway group and the NF airway group based on the nasopharyngeal airway shapes in the adenoid plane by using a cluster analysis (Figure 3). The group differences for each measurement of the nasopharyngeal airway in the adenoid plane were significant between the BT and NF types. In comparison with the BT group, the NF group had a greater width to height ratio (ad-w/h1) and a greater AN ratio. In addition, the NF group had a smaller width (ad-w), a shorter height (ad-h1, ad-h2), a smaller cross-sectional area (ad-CSA), a shorter convex adenoid distance (CAD), and a smaller volume (Vol) (p < 0.01; Table 2). The AN ratio was negatively correlated with ad-CSA, CAD, and Vol but positively correlated with ad-w/h1 (Table 3). Most (81.2%) of the subjects belonged to the BT group. Based on the χ2 test, the nasopharyngeal airway shapes in the adenoid plane were correlated with the severity of adenoid hypertrophy. All the children with moderate to severe AN ratios belonged to the NF group (p < 0.05; Table 4).
All measurements, including nasopharyngeal volumes, were obtained twice (Table 1). To assess the errors, all 3D images were remeasured 1 week after the first evaluation. No systemic errors were found based on the paired t-tests. Correlations between the first and second measurements ranged from 0.969 to 0.998 (p < 0.001; degree of freedom = 8).
DISCUSSION
Adenoids in children are twice the size of those in adults. The airway adjacent to the adenoids is the most frequently constricted part, and the resistance to airflow is influenced by airway shape and size. If the airway has a bent passage despite a large volume, airway resistance can greatly affect respiratory function, e.g., by causing nasal obstruction.12 Objective findings are necessary to decide if adenoidectomy is necessary in these children, and CBCT has been especially beneficial to understand and diagnose obstructed airways.13 As children have a high sensitivity to radiation, the radiation dose should be minimized when children are exposed. However, the radiation dose is reduced by up to 43% when patients wear protection, such as a thyroid collar.14 In this study, all patients wore a thyroid collar during the CBCT imaging.
In the 3D evaluation of the children's airways on the sagittal or axial planes, the airway volumes or shapes showed correlations with the craniofacial morphologies.15,16 Solow and Sandham17 hypothesized that a change in head posture could rotate the mandible, and this modification of the jaw posture would lead to a change in the musculature, as well as induce malocclusions. Oh et al.18 showed that the inclination of the oropharyngeal airway was related to head posture and was affected by anteroposterior dysplasia in children. Therefore, in this study, the CBCT images were taken with a natural head position and in an upright position to examine the relationship among the frontal plane shape, the nasopharyngeal airway volume, and the craniofacial morphologies.
Previous studies have reported the airway sizes in children with mandibular prognathism16 or the shape of only the oropharyngeal airway in children with mandibular retrognathism.15 As there is no universal standard form and size of the nasopharyngeal airway in children, we attempted to measure the dimension of the airway in the sagittal and frontal planes to evaluate the nasopharyngeal airway size and form related to adenoid hypertrophy.
The subjects were divided into a BT shaped airway group and an NF shaped airway group based on the cross-sectional shape of the nasopharyngeal airway on the adenoid plane (Figure 3). The NF type of the nasopharyngeal airway showed smaller linear and volumetric measurements than the BT type. The NF type also had a greater ad-w to h1 ratio, which represented a significantly greater left-to-right enlargement of the adenoids in the frontal section view (p < 0.01; Table 2). The Pearson's correlation coefficient test showed that a small Vol of the nasopharyngeal airway is related to a small airway passage on both frontal and sagittal cross-sections (p < 0.01; Table 3). These findings may suggest that the NF type of nasopharyngeal airway in the adenoid plane has a relatively smaller nasopharyngeal airway space and a relatively shorter distance between the superior and inferior borders (CAD in the sagittal plane), as compared to the BT type, as well as a flat superior border (Figure 4).
Conventionally, the AN ratio from the lateral cephalometric analysis has been a valid method to assess the nasopharyngeal airway in children with adenoid hypertrophy,8,11,19 and it has been proven to be a reliable diagnostic tool that was correlated with endoscopic examination.4 However, the AN ratio has a disadvantage, as during 2D analysis, objects that we would like to see are superimposed by other anatomic structures. Lertsburapa et al.8 believed that the AN ratio calculated from lateral radiographs had a tendency to overestimate or underestimate the adenoid size in comparison with nasal endoscopy. Therefore, the AN ratio should be assessed with a 3D analysis that considers the varying aspects of the nasopharyngeal airway shape and volume while taking just a single CBCT image.
The majority of the subjects had BT type nasopharyngeal airways (81.2%), indicating that a small number of children had small NF type nasopharyngeal airways and that the NF type was correlated with adenoid enlargement, especially in moderate and severe conditions (p < 0.001; Table 4). Lertsburapa et al.8 and Kolo et al.11 reported that children with high AN ratios presented with obstructive adenoids, which was in accordance with our results. In addition, Brodsky et al.20 showed that a reduced oropharyngeal airway size was related with adenoid hypertrophy in children. Thus, the results in this study indicated that the specific NF type and a small nasopharyngeal airway volume may be determined by the degree of adenoid hypertrophy.
Previous studies have evaluated the clinical symptoms, such as obstructive sleep apnea, that are associated with the pharyngeal airway and adenoid hypertrophy in children. Hibbert and Stell21 reported that nasopharyngeal airways were much smaller in children with obstructive symptoms. Aboudara et al.9 showed that airway size and shape are associated with resistance of pharyngeal airway flow. In addition, Tagaya et al.22 explained that the severity of airway obstruction was correlated to adenoid size and adenoid hypertrophy, which could be major factors contributing to obstructive sleep apnea syndrome in children. If adenoid hypertrophy persists, patients may develop obstructive sleep apnea syndrome and aberrant facial growth.23,24 Thus, children with relatively small NF type nasopharyngeal airways may have potential airway problems, which necessitate intensive observation to prevent undesirable facial growth during adolescence. Furthermore, a careful approach of an airway should be performed in association with clinical airway symptoms and an unfavorable facial growth pattern.
CBCT may be a reliable diagnostic imaging tool to provide accurate data regarding airway morphology and size to allow clinicians to determine the appropriate treatment for adenoids that are associated with respiratory problems. In addition, by incorporating CBCT images into daily practice, clinicians could promptly assess and screen the airway structures that have a significant impact on normal breathing.24,25 While clinicians are assessing the nasopharyngeal airway with CBCT, observation of the specific NF type and a small nasopharyngeal airway volume might be useful to evaluate the degree of adenoid hypertrophy.
CONCLUSION
Through this 3D analysis, cross-sectional shapes of the nasopharyngeal airway on the adenoid plane could be classified into BT and NF types. The NF type of nasopharyngeal airway was characterized by smaller widths, shorter heights, and smaller cross-sectional areas, with reference to the BT type, which might be associated with adenoidal hypertrophy. These results indicate that assessment of the nasopharyngeal airway using CBCT could be useful to predict the predisposing factors of undesirable facial growth, especially while treating children with constricted and NF shaped airways.

 XML Download