

 PDF
PDF ePub
ePub Citation
 Print
Print


INTRODUCTION
Cleft lip, palate, or both are the most frequently occurring congenital facial deformities, having an incidence rate of 0.65% among newborns, with ethnic and geographic variations.1,2 The typical manifestations of cleft lip and/or palate include midfacial deficiency related to retruded maxilla, contralaterally deviated anterior nasal spine, distorted nasal septum, collapsed piriform rim, and subsided nasal base.3,4 In the unilateral cleft, asymmetrical maxillary bone defects and distortions are common.3,5-11 Even after primary corrective surgery to improve the appearance, patients with unilateral cleft lip and palate (UCLP) show a distinct facial asymmetry.12,13
Numerous studies of the asymmetry of the cranial base, nasolabial region, and mandible of patients with UCLP have been conducted.6,8-11,14-16 In the nasolabial region, nasal septum distortion and deviation toward the affected side have been reported.6,8-11 However, the mandibular asymmetry is controversial.8,14-16 Some authors reported significant differences in the lower face, especially in the mandible,14,15 whereas others offered contradictory data.8,16 Nevertheless, midfacial analysis to distinguish areas of obvious asymmetry has rarely been conducted.
This lacuna of research is attributable to the serious limitations of lateral cephalometric radiographs: specifically, their two-dimensional nature, superimposition of bony structures in the craniofacial and midfacial regions, and incomplete assessment of soft tissue.17 Kim et al.18 suggested grid-based cone-beam computed tomography (CBCT) analysis of hard- and soft-tissue changes, and Meyer-Marcotty et al.7 recommended registration of the original and mirrored data by using three-dimensional surface scans to analyze facial asymmetry. CBCT is a good tool for quantitative analysis of hard and soft tissues in the midface.19,20 Nonetheless, only a few reports on the use of CBCT for measuring superficial midfacial asymmetry in UCLP exist.
The aims of this study were to compare three-dimensionally the midfacial hard- and soft-tissue asymmetries between the affected and the unaffected sides and determine the relationship between the hard tissue and the overlying soft tissue in patients with complete UCLP by CBCT analysis. The null hypothesis was that no significant midfacial hard- and soft-tissue differences would exist between the affected and the unaffected sides in complete UCLP.
MATERIALS AND METHODS
Subjects
Twenty-six adults (18 men, 8 women; mean age, 22.79 ± 6.38 years; range, 19 - 43 years) who had undergone complete UCLP correction were selected from the Department of Orthodontics, Pusan National University Dental Hospital (Busan, Korea). The inclusion criteria were (1) availability of birth and treatment records, (2) surgical correction of the cleft in infancy (primary lip correction within 1 year; primary palate correction before 2 years), and (3) no orthognathic surgery. The exclusion criteria were (1) diagnosis of a syndrome, (2) either growth or mental retardation, and (3) maxillary distraction osteogenesis in adolescence. This study was reviewed and approved by the Ethics Committee of Pusan National University Hospital (E-2011040).
Data acquisition
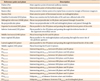
Before the orthodontic treatment, CBCT scans (PaX-Zenith 3D; Vatech Co., Gyeonggi-Do, Korea) were recorded, with the subject in an upright position for maximum intercuspation. The Frankfurt horizontal (FH) plane was parallel to the floor. The maxillofacial regions were scanned by using a field of view of 20 × 19 cm, tube voltage of 90 kVp, tube current of 4.0 mA, and scan time of 24 s. The scans were reconstructed by using three-dimensional dental imaging software (Ez3D2009; E-WOO Technology Co., Ltd., Gyeonggi-Do, Korea). Then, the craniofacial structures in the three-dimensional images were re-orientated according to reference planes: the Basion-perpendicular, midsagittal reference (MSR), and FH planes (Table 1).
One operator performed all the measurements twice with an interval of 2 weeks. Under the same conditions, the linear and surface measurements of the hard and soft tissues were obtained (window width: 4,000; window level: 1,000).
Linear measurements
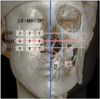
The analytical method involved the use of a 3 × 3 grid of vertical and horizontal planes to divide the midfacial region unilaterally. The vertical planes were the inner sagittal (IS), middle sagittal (MS), and lateral sagittal (LS) planes and the horizontal planes were the superior horizontal (SH), middle horizontal (MH), and inferior horizontal (IH) planes (Table 1, Figure 1). Their intersecting points were P1hard/soft to P9hard/soft. Two additional points were used unilaterally to assess the dentoalveolar area: P10hard/soft, midpoint of the distance between the alare and the cheilion, and P11hard/soft, midpoint of the distance between P10hard/soft and the MSR plane (Table 1, Figure 1).
We obtained 22, five, and two linear measurements for assessing anteroposterior, transverse, and vertical hard- and soft-tissue asymmetries, respectively, in the midfacial and dentoalveolar areas on each side. To evaluate the anteroposterior asymmetry, the distances from the Ba-perpendicular plane to the corresponding hard- and soft-tissue points (P1hard/soft to P11hard/soft) on the affected and unaffected sides were measured (Figure 2A). To evaluate the transverse asymmetry, the distances from the MSR plane to the IS and LS planes, along with the most lateral soft-tissue point on each of the vertical lines, were measured (Figure 2B). Finally, the vertical asymmetry was calculated by measuring the distances from the FH plane to the SH and IH planes. The SH plane on the unaffected side, referred to as the FH plane, was used as the reference line (Figure 2C).
Surface measurements
To evaluate the midfacial asymmetry in terms of convexity or concavity between the affected and the unaffected sides, the surface areas of the maxilla and zygomatic bone on each of the horizontal planes were measured. The superior area was between the anterior surface of the maxilla and the line from P1hard to P3hard, the middle area was between the anterior surface of the maxilla and the line from P4hard to P6hard, and the inferior area was between the anterior surface of maxilla and the line from P7hard to P9hard. Negative values indicated concavity and positive values indicated convexity (Figure 2D).
Statistical analysis
To assess the intraobserver variability and reproducibility, the measurements were checked twice with an interval of 14 days. A paired t-test was used for all the comparisons. The differences were considered significant at p < 0.05. PASW Statistics version 18.0 for Windows (IBM Co., Armonk, NY, USA) was used for the statistical analyses.
RESULTS
The intraobserver agreement of the measurements was excellent (intraclass correlation coefficient range: 0.966 - 0.998).
Anteroposterior asymmetry
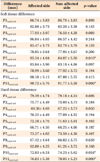
In the soft-tissue analysis, the distances from the Baperpendicular plane to P7soft on the unaffected side (p = 0.010) and P11soft on the affected side (p = 0.006) were significantly decreased (Table 2). In the hard-tissue analysis, the distances from the Ba-perpendicular plane to P10hard (p = 0.034) and P11hard (p = 0.006) on the affected side showed a significant reduction. None of the other midfacial measurements showed significant differences (p > 0.05).
Transverse and vertical asymmetries
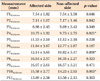
In terms of the transverse asymmetry, only the distance from the MSR plane to the IS plane was significantly different (p < 0.05): it was greater on the affected side than on the unaffected side. None of the soft-tissue measurements showed significant differences (p > 0.05). Further, neither of the measurements for vertical asymmetry were significant (p > 0.05).
Soft tissue thickness
In terms of the soft-tissue thickness, P4thickness (p = 0.021), P7thickness (p = 0.000), and P10thickness (p = 0.003) showed significant differences on the affected side (Table 3). The middle and lateral regions of the midface showed no significant differences between the sides (p > 0.05).
Surface measurements
No significant differences in the surface measurements were noted (p > 0.05; Table 4).
DISCUSSION
Although much research on asymmetry in patients with UCLP has been conducted, conclusions remain elusive.6,7,17,21,22 Simply, the midfacial hard- and soft-tissue asymmetries in adults have not been sufficiently evaluated. In the present study, CBCT, with the use of established reference lines and grid planes,18,22 enabled effective simultaneous analysis of hard- and soft-tissue asymmetries of the midface in adults with nonsyndromic UCLP. As these patients show midfacial defects and variations, a cranial structure manifesting a relatively small variation was used as the basis for the reference planes. The FH and MSR planes, given the previous research showing the porion to be an adequately stable structure for use as a reference point,17,23 were considered acceptable for evaluating midfacial asymmetry caused by a relatively small variation of the cleft.17
Tissue defects and scar tissue resulting from early surgery in patients with UCLP can impede normal growth and induce anteroposterior and transverse asymmetries. Nasal asymmetry is a long-recognized stigma of these patients.9,11,21,24,25 Even so, the midfacial area has rarely been the focus of study.
The results showed that no significant differences existed between the affected and the unaffected sides or between the hard and the soft tissues at most sites (p > 0.05). Similarly, previous research has shown significant differences between the affected and the unaffected sides only in the nasolabial and dentoalveolar areas.8,17 Suri et al.17 observed no significant differences in bilateral measurements of the craniofacial structures far from the cleft, indicating the absence of major transverse and sagittal asymmetries of the deeper midfacial structures in their study sample. The maxillary sinuses on both sides of the face were similar to the reference in size and lateromedial and anteroposterior locations. Further, Suzuki et al.24 reported that the size of the sinus associated with UCLP is not dependent on the cleft side. However, others have reported contradictory results, showing asymmetry in the midfacial region, especially of the orbital, maxillary, and nasal regions, by using three-dimensional skull models. Lateral dislocation of the maxilla on the affected side has been noted, and mean retrograde movement has been shown in 52% of the patients.22,26,27
With regard to the hard-tissue measurements, only those in the dentoalveolar area were significantly different (p < 0.05): the tissue on the affected side was retruded compared with that on the unaffected side. This seems reasonable, because the dentoalveolar area and piriform aperture directly lie in the contraction area of the cleft.6,7,17,26 P11hard seems to have been affected by asymmetrical posterior displacement of the maxilla itself, due to the absence of the lateral incisor on the affected side. This depression of the dentoalveolar area on the cleft side is similar to the sagittal depression of the bony alar base in the findings of Mølsted and Dahl9 and Kolbenstvedt et al.25
Among the soft-tissue measurements, only in the dentoalveolar (P11soft) and nasal (P7soft) areas were significant differences noted (p < 0.05); however, their positions varied. Specifically, the dentoalveolar area was located relatively posterior on the affected side, because P11soft was closer to the cleft. P11soft was the site of scar-tissue formation, owing to the flap facilitation and suturing that had been performed in the previous cheiloplasty.28,29 Conversely, the lower portion of the midface adjacent to the nose was located relatively anteriorly on the affected side. This might have been caused by the soft-tissue thickness, which was greater near the nose (P4soft and P7soft) than elsewhere. Further, the difference in the soft-tissue thickness may have been caused by the gap between the cleft segment and the postsurgical changes in muscle position and function. Nevertheless, these results are consistent with previous findings, showing greater soft-tissue thickness on the affected side.3,9,30 In their research on untreated unilateral cleft nose deformities by using a combined photography/CBCT measurement method, Li et al.3 insisted that bony deformities would determine the soft-tissue contours and the soft tissue, in turn, could camouflage the underlying bony deformities in various patterns and to different extents, making the external configuration less deformed than its bony basis.
The surface measurements of bone concavity or convexity did not show any significant difference between the affected and the unaffected sides in any area (p > 0.05). These results confirm that the affected side does not present any particular bony depression. However, with respect to the impact of facial asymmetry on visual perception, Meyer-Marcotty et al.7 insisted that the greater the facial asymmetry near the midline of the face, the more negative is the evaluation of the face in direct face-to-face interactions among patients with UCLP. The greatest asymmetry in adult patients is in the nasolabial and dentoalveolar areas, which can affect the perception of midfacial asymmetry. Better midfacial symmetry is achievable, therefore, by performing rhinoplasty after orthognathic surgery.

 XML Download