

 PDF
PDF ePub
ePub Citation
 Print
Print


INTRODUCTION
The aim of orthodontic and surgical treatment of patients who have craniofacial anomalies is to achieve not only an ideal occlusion, but also, more significantly, a harmonious facial appearance.1 One important aspect of this appearance is facial asymmetry, which is determined by both hard and soft tissue. Although the soft tissue morphology is known to reflect the underlying hard tissue structure, the hard tissue structure may not be fully expressed on the soft tissue images. The soft tissue may compensate for this asymmetry, or be more asymmetric.2,3 Moreover, a patient and his or her family evaluate the success of the orthodontic treatment or orthognathic surgery mainly by visual cutaneous changes. Since the external appearance of asymmetry is of great importance for patients and essential for treatment planning, the soft tissue features of facial asymmetry, as well as hard tissue characteristics,4-6 need to be evaluated.
Because differences between the dimensions of the right and left half of any human face, as well as between paired structures are common findings in healthy individuals,7-12 the aim of surgically creating a perfectly symmetrical face is not realistic. Considering that minor asymmetry exists in normal occlusion individuals and does not cause a problem both aesthetically and functionally, it is necessary to determine the range of "normal asymmetry" for an evaluation of facial asymmetry using a quantitative analysis.
The purpose of the present study was to obtain the right and left difference values of the facial soft tissue land marks from the normal occlusion individuals, and further to determine the range of "normal asymmetry" in a 3-dimensional (3D) coordinate system, so resultant data can be used as a standard in the evaluation of facial asymmetry.
MATERIALS AND METHODS
The sample was selected from university students. A clinical examination was carried out, and those subjects who were judged to have a Class I molar and canine relationships with no or minimal crowding and well-balanced faces were selected. All subjects had no previous orthodontic treatment. Any subject who presented apparent facial asymmetry was excluded from the samples. Thus, lateral and frontal cephalograms were not obtained for the purpose of sample selection. Forty eight students, 24 men (mean age 26.2 years) and 24 women (mean age 25.3 years), were enrolled into the present study. Informed consent from all subjects was obtained.
The computed tomography (CT) scans were obtained using a cone-beam CT scan ner (Alphard Vega; Asahi Roentgen Co., Kyoto, Japan) under the following conditions: 80 κV, 5 mA, voxel size 0.39 × 0.39 × 0.39 mm, field of view 200 × 179 mm. The subject was scanned in the seated position with a relaxed facial expression. After the scanning was completed, digital imaging and communication in medicine (DICOM) images were created, and then input onto a personal computer. The axial images were reconstructed into a 3D model by using V-works program (V-works 4.0 Professional; CyberMed, Seoul, Korea).
After opening the volume rendering image as the skin mode in the V-works, the landmarks were defined using the program's Create V-surgery Project function. First, the landmarks for the construction of the reference planes were identified in order to evaluate the position of the landmarks with a 3D coordinate system. In this study, hard tissue landmarks were used for the construction of the reference planes. The horizontal reference plane was constructed on both sides of the Porion (Po) and right side of the Orbitale (Or). The sagittal reference plane was defined as being perpendicular to the horizontal plane passing Nasion (N) and Opisthion (Op). The coronal plane was at a right angle to the horizontal and midsagittal plane passing through N.
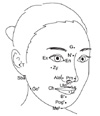
After defining the reference planes using the hard tissue landmarks, 27 soft tissue landmarks, 9 midline and 9 pairs of bilateral landmarks, were located as described in Table 1. The landmarks were located on the 3D surface model, and multi-planar reconstruction (MPR) views were used to identify the landmark when necessary. All data were saved as the form of a vsp file and the files were imported into the related program (V-surgery, CyberMed) (Table 1, Figure 1).
Using the programs, the position of 27 landmarks was obtained in the form of a 3D coordinate system (x, y, z) which was determined as the distances from the reference planes. A positive coordinate value indicates the posterior, superior, and left side of the face, and a negative value indicates the opposite. Using the 3D coordinate values of each point, the right and left differences were calculated for each coordinate. While the difference in the x coordinate direction was designated as the transverse difference (dx), the differences in the y and z coordinates were expressed as the sagittal (dy) and vertical differences (dz) respectively. Each difference was calculated as follows:
dx = |xl - (-xr)|
dy = |yl - yr|
dz = |zl - zr|
where (xl, yl, zl) and (xr, yr, zr) were 3D coordinates of the landmarks of the left and right face. For the midline landmarks, absolute value of the x coordinate was directly assigned to dx.
In order to assess the measurement errors, the images from 10 subjects (5 men and 5 women) were selected randomly, and the landmarks were identified twice at an interval of two weeks by an operator. The method errors (MEs) of the double registration of all landmarks in dx, dy, dz were calculated using the Dahlberg's formula as follows:
where d is the difference between the two measurements and n is the number of the subjects. The errors ranged from 0.2 to 0.9 mm.
In order to determine the right and left difference of a pair of landmarks three-dimensionally, the following equation was used according to the study of Ras et al.:12

As there is no difference in the y and z values between the left and the right sides for the midline landmarks, dx was assigned directly to the 3D difference. Means and standard deviations were calculated for the male and female separately and together. The Shapiro-Wilks test for normality showed that all variables were normally distributed. The independent-samples t-test was used to examine gender differences at the significance level of 0.05.
On the other hand, horizontal, sagittal, and vertical differences were calculated using a pair of each coordinate to evaluate which direction of difference contributed to the degree of 3D difference for bilateral landmarks. For the examination of gender differences of the 3D coordinate system, Hotelling's T2 test was used. All statistical analyses were carried out by the SPSS software program (version 16.0; SPSS Inc., Chicago, IL, USA).
RESULTS
The means and standard deviations of the right and left differences of the landmarks are presented in Table 2. In the comparison between males and females, all landmarks showed no significant sex differences. Thus, combined data was used in subsequent analyses. The mean difference values derived from normal occlusion individuals used in the study ranged from 0.6 to 4.6 mm, indicating a high variability according to the landmarks.
The midline landmarks showed generally smaller values compared to bilateral landmarks. The values ranged from 0.6 to 1.5 mm. In particular, G, N', Prn, and Sn showed small values ranging from 0.6 to 0.7 mm, indicating that those landmarks can also be used as the references in the evaluation of facial asymmetry. The landmarks in the lower region of the face such as B', Pog', and Me', showed greater values than those in the upper region of the face, indicating an increase of asymmetry according to lower positioning of the landmarks.
The bilateral landmarks presented greater values than the midline landmarks, and a higher variability according to the landmarks. The values ranged from 1.5 to 4.6 mm. En and Ulp showed smallest values, approximately 1.5 mm, whereas Zy and Go' presented greatest values, 3.3 and 4.6 mm respectively. Similar to the midline landmarks, the bilateral landmarks also showed a tendency of increased values according to lower positioning of the landmarks in the face. In addition, the values showed a tendency to increase according to lateral positioning of the landmarks. As an example, compared to Ulp and Ala which showed 1.5 and 1.9 mm respectively, Cheilion presented a greater value, 2.2 mm, and Sba and Go' showed significantly greater values, 3.1 and 4.6 mm respectively. The more the landmarks were distant from the midsagittal plane, the greater their values were (Table 2).
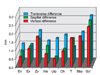
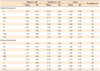
In order to evaluate which direction of difference contributed to the degree of overall difference for the bilateral landmarks, the means and standard deviations were computed for each coordinate direction. While Table 3 shows the values of each sex, combined values were used in the evaluation of the values according to landmarks because Hotelling's T2 test did not show any significant differences between male and female subjects. Figure 2 shows graphic presentation of transverse, sagittal, and vertical direction of right and left differences for each landmark. The differences were present not only in transverse direction but also in sagittal and vertical directions. A landmark, Tragion, presented greater values in sagittal and vertical directions than in transverse directions. These results indicate that overall differences are determined not only by transverse differences but also by sagittal and vertical differences, indicating that 3D evaluation would be essential in the facial soft tissue analysis (Table 3, Figure 2).
DISCUSSION
Selection of reference plane is of the utmost importance in the evaluation of asymmetry of an object. The results can be different depending on the position of the reference plane. Ras et al.12-14 used a vertical plane perpendicular to and bisecting the line connecting the right and left Exocanthi as the reference plane in the evaluation of facial asymmetry using stereophotogrammetry. Ferrario et al.15 selected the vertical line passing through the Nasion and perpendicular to the plane connecting the two Exocanthi in the evaluation of asymmetry using a 3D electromagnetic digitizer. Baik et al.16,17 constructed a plane passing through soft tissue Nasion and the midpoint of both Tragus points as the sagittal reference plane in their 3D facial soft tissue analysis using a laser scanner. All these studies, however, used soft tissue landmarks for the construction of reference planes. Considering that the reproducibility of soft tissue landmarks is low,18 the reliability of the reference plane constructed with soft tissue landmark might be questionable. For the present study, the hard tissue landmarks were used in the construction of the reference plane. Hard tissue landmarks could be identified easily with the help of the MPR view. A more important advantage of the construction of the reference plane with the hard tissue landmarks is that the hard and soft tissue can be evaluated simultaneously, in other words, with the same coordinate system as the same reference planes are used. This will enable us to understand the hard and soft tissue interrelationship more accurately. Moreover, use of the same reference planes for both hard and soft tissue evaluation will simplify the procedure of analysis in clinical practice and further contribute to a wider use of 3D image analysis in everyday practice.
The mean values of the right and left differences of the facial soft tissue landmarks derived from normal occlusion individuals ranged from 0.6 to 4.6 mm, indicating a high variability according to the landmarks. Although some landmarks presented small values, the landmarks used in the study generally showed greater values than expected, indicating that the range of "normal asymmetry" of soft tissue might be wider than in hard tissue. Katsumata et al.4 developed the standard values for hard tissue analysis using the same 3D coordinate system as the present study. Comparison of the data of the present study with their studies revealed that the right and left differences of the soft tissue are greater than in hard tissue. This difference might be due to a variation of soft tissue thickness and should be expected results to some extent in the subjects of normal occlusion individuals. However, it is interesting to note that the findings derived from the subjects of facial asymmetry individuals are quite different from the present study. Kim et al.3 reported that the degree of asymmetry is less in soft tissue than in hard tissue for most measurements except lip-line can ting in the comparison between soft and hard tissue measurements in the subjects of facial asymmetry individuals. They explained that skeletal aberration is not fully reflected in soft tissue because it is compensated or masked by muscle and/or skin tissue.2,3 It is likely that the right and left differences of the soft tissue are greater than in hard tissue in normal occlusion individuals while vice versa in facial asymmetry patients.
While most of the landmarks presented great values of the right and left difference, the midline landmarks showed relatively small values. The values ranged 0.6 to 1.5 mm. In particular, G, N', Prn, and Sn showed very small values ranging from 0.6 to 0.7 mm, indicating that those landmarks also can be used as the references in the evaluation of facial asymmetry. On the other hand, the landmarks in the lower region of the face, B', Pog' and Me', showed great values indicating that the degree of asymmetry increases according to lower positioning of the landmarks. This finding is identical with the results of previous studies.8,10,11,15,19 Farkas11 reported that the lowest mean frequency of asymmetries was found in the orbital region (less than 2%), followed by the nose (7%) and mouth (about 12%) in the normal population. Similar findings were present in facial asymmetry patients. Severt and Proffit19 revealed that the asymmetry affected the upper face in only 5%, the midface in 36%, and the chin in 41% in a retrospective survey of a large number of patients evaluated in the Dentofacial Clinic at the University of North Carolina. This tendency seems to be partly due to the fact that the mandible is a mobile structure compared to the maxilla which is connected to the adjacent structures more strongly with the sutures.
In addition, the right and left difference values showed a tendency to increase according to lateral positioning of the landmarks. As an example, the Subaurale and soft tissue Gonion showed over two times greater values than Upper lip point and Alare in the present study. Previous studies dealing with the same issue reported the same results with the present study.8,10,11,15 Ferrario et al.15 revealed that Tragion, Gonion, and Zygion were the most asymmetric landmarks whereas the least asymmetric was endocanthion in their 3D study with an electromagnetic digitizer. Considering an increase of asymmetry according to lateral positioning of the landmarks, bilateral landmarks should be used with caution in the construction of the reference planes while some authors12-17 used bilateral landmarks in the construction of reference planes for their 3D facial soft tissue studies. This will be truer when the landmarks are more distant from the midsagittal structures.
While the data in the study can be used in the identification of individual "asymmetric" subjects, a way of deciding the threshold value can be an issue. Farkas11 and Ferrario et al.15 used the mean plus 2 standard deviations as the maximum normal asymmetry to supply a threshold value for the identification of asymmetry. On the other hand, Katsumata and her colleagues4,5 defined a point as asymmetric when the right and left difference was larger than the mean plus one standard deviation, and further defined it as marked asymmetry when the point demonstrated a value greater than twice the mean plus one standard deviation. It is likely that a decision of threshold value is rather subjective according to investigators or clinicians, particularly in the subject of asymmetry.
On the other hand, the present data obtained from normal occlusion individuals can be used in evaluation in post-treatment results and explanation to a patient and his or her family as well as in diagnosis of asymmetry before treatment. The fact that the range of "normal asymmetry" of soft tissue is wider than in the hard tissue indicates that soft tissue symmetry cannot be guaranteed after orthognathic surgery even with perfect correction of hard tissue. This limitation in soft tissue correction should be taken into consideration in formulating a surgical treatment plan. In addition, it should be informed to the patients that some degree of asymmetry after surgery is natural, not the results of malpractice. Considering that some patients complaint of remaining soft tissue asymmetry after surgery the results of the present study can be a basis of explanation to the patients and can be a further help in improving the interrelationship between the operators and patients.
CONCLUSION
1. In the present study, 27 soft tissue landmarks were identified in 3D coordinate system, and their right and left differences were determined.
2. The right and left difference values showed a tendency to increase according to the lower and lateral positioning of the landmarks in the face.
3. Overall differences were determined not only by transverse differences but also by sagittal and vertical differences, indicating that 3D evaluation would be essential in the facial soft tissue analysis.


 XML Download