

 PDF
PDF ePub
ePub Citation
 Print
Print


INTRODUCTION
MATERIALS AND METHODS
Subjects
Cine MRI and stages of deglutition
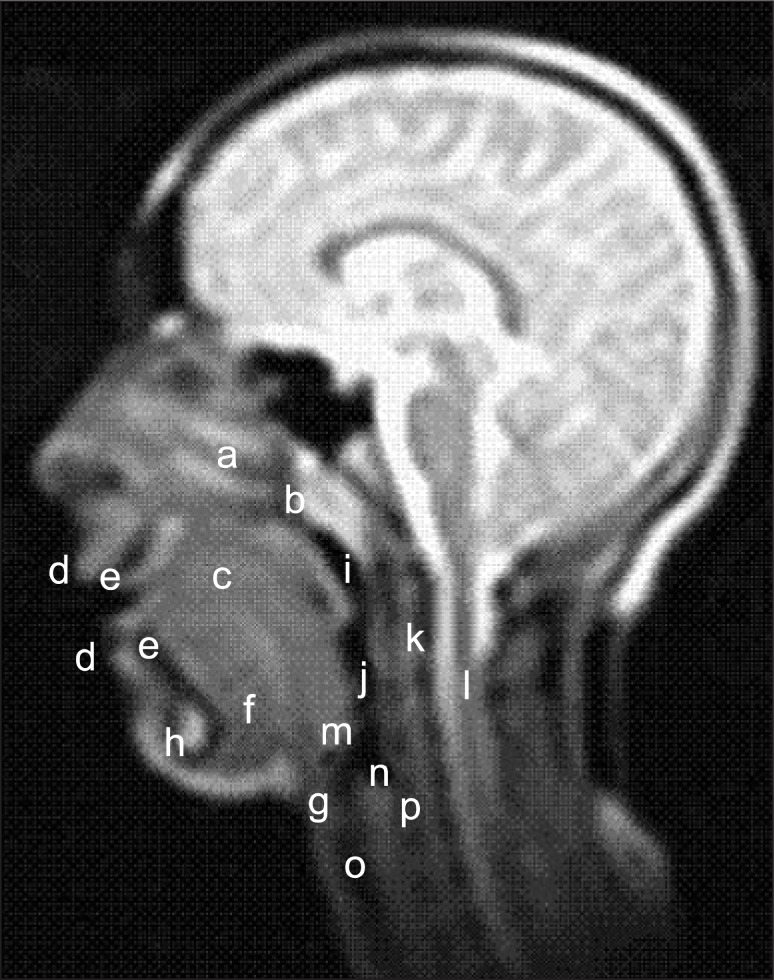 | Figure 1Anatomical structures visible on cine magnetic resonance imaging (a) nasal cavity, (b) nasopharynx, (c) tongue, (d) lips, (e) incisors, (f) floor of the mouth, (g) hyoid bone, (h) symphysis, (i) pharynx, (j) larynx, (k) spinal column, (l) spinal cord, (m) epiglottis, (n) cricoid cartilage and cricotracheal membrane, (o) trachea, and (p) upper portion of the esophagus.
|
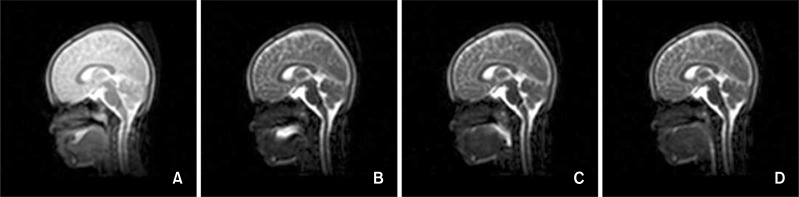 | Figure 2Stages of deglutition. A, stage 1 (oral preparatory stage), the tongue tip contacts the maxillary incisors and/or the palatal mucosa; B, stage 2 (oral stage), the dorsum of the tongue loses contact with the soft palate; C, stage 3 (pharyngeal stage), the bolus crosses the posterior or inferior margin of the mandibular ramus; and D, stage 4 (esophageal stage), the bolus enters the esophageal opening.
|
Measurements
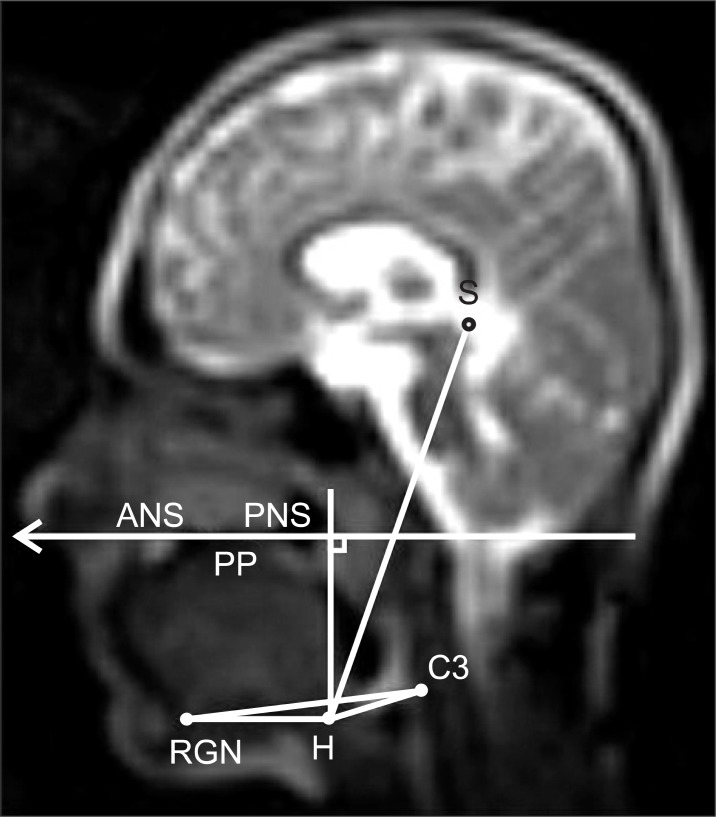 | Figure 3Measurements used for evaluating hyoid bone movements. (1) H-S, distance between hyoidale (H, the most anterosuperior point of the hyoid bone) and point sella (S); (2) H-PP, perpendicular distance of hyoidale to the palatal plane (PP); (3) H-C3RGN, perpendicular distance of hyoidale to the line connecting the most anteroinferior point of the third cervical vertebra (C3) and retrognathion (RNG, the most prominent point of the posterior border of the symphysis); (4) H-C3, distance between hyoidale and the most anteroinferior point of the third cervical vertebra; and (5) H-RGN, distance between hyoidale and retrognathion.
|
Statistical analysis
RESULTS
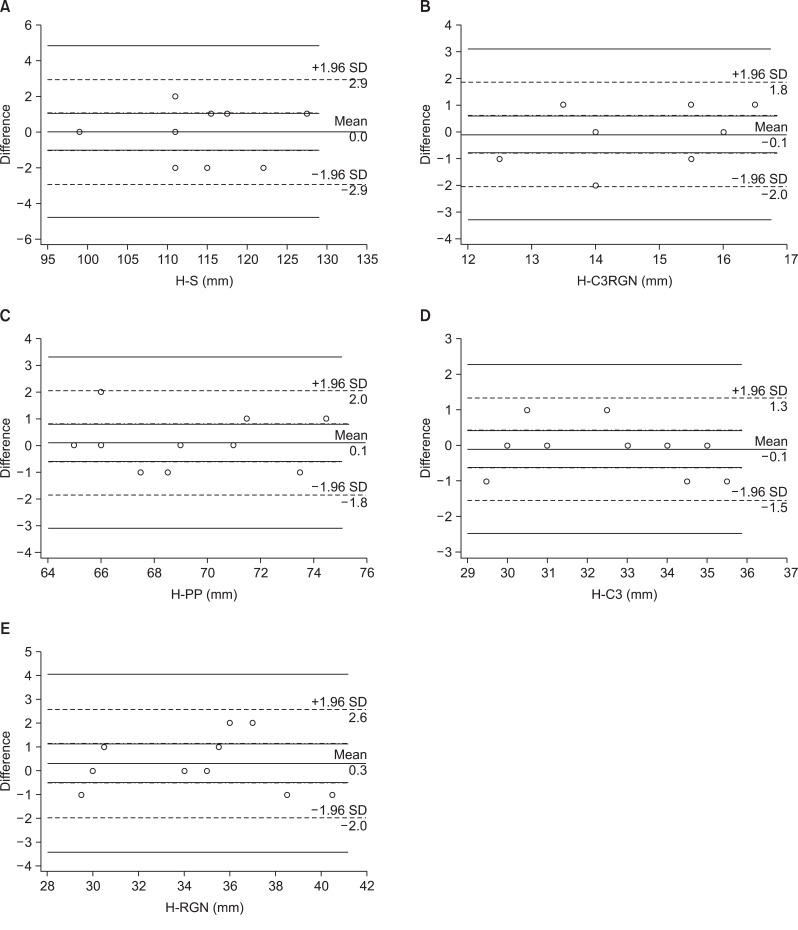 | Figure 4Bland-Altman plots of the average differences in the measurements. A, H-S; B, H-C3RGN; C, H-PP; D, H-C3; and E, H-RGN. The overall bias of each measurement is shown, along with the 95% agreement interval. SD, Standard deviation. Refer to Figure 3 for measurements and abbreviations.
|
Table 1
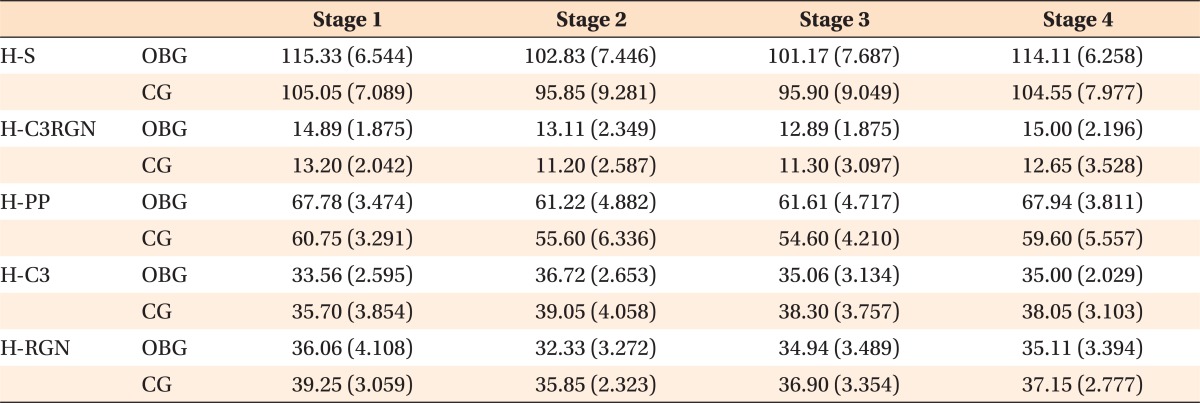
Values are presented as mean (standard deviation).
OBG, Open bite group (n = 18); CG, control group (n = 18).
Refer to Figure 3 for measurements and abbreviations.
![]()
Table 2
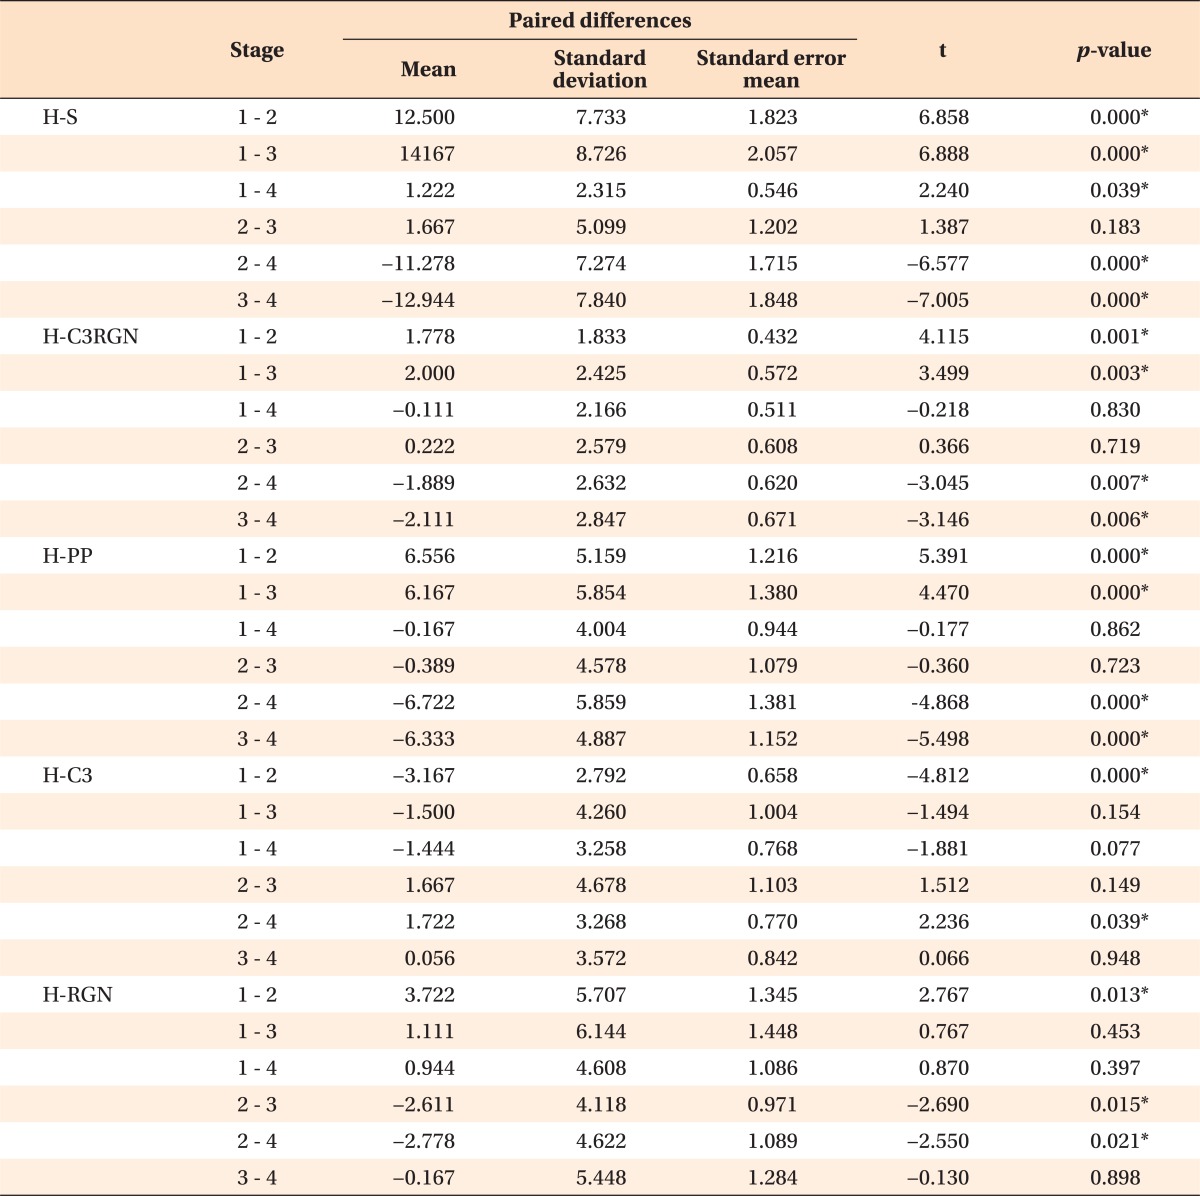
*Statistically significant (by 2-tailed test).
Refer to Figure 3 for measurements and abbreviations.
![]()
Table 3
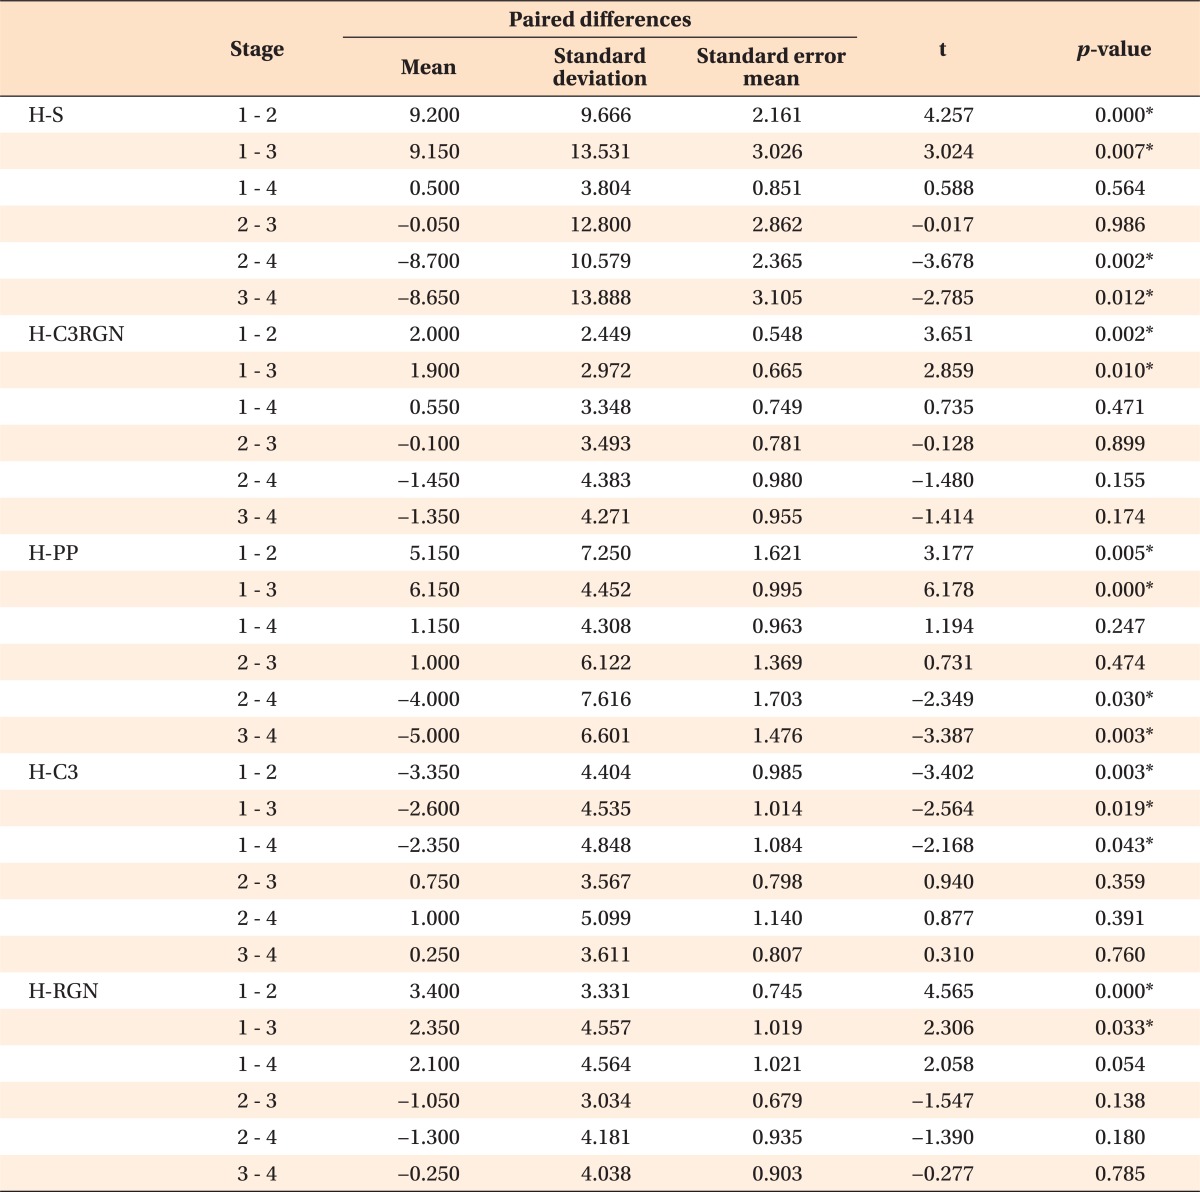
*Statistically significant (by 2-tailed test).
Refer to Figure 3 for measurements and abbreviations.
![]()
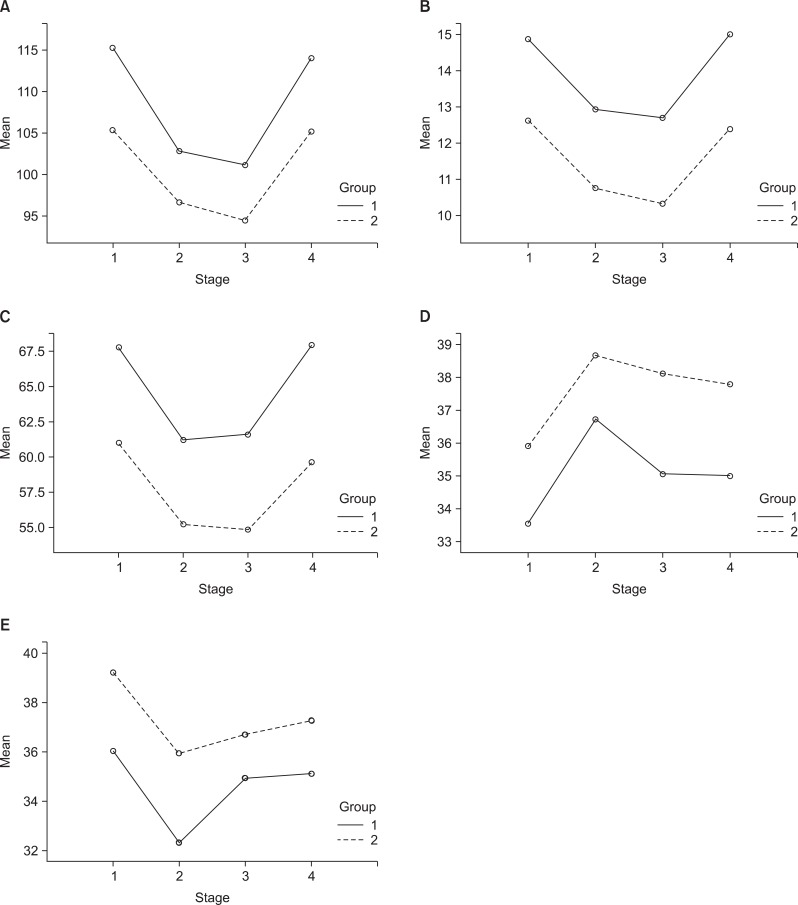 | Figure 5Plots of the mean A, H-S; B, H-C3RGN; C, H-PP; D, H-C3; and E, H-RGN values as a function of the stages of deglutition in the open bite group (group 1) and the control group (group 2). Refer to Figure 3 for measurements and abbreviations.
|
Table 4
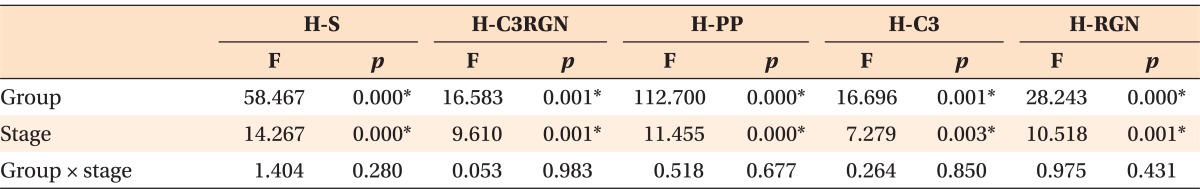
*Statistically significant (by repeated-measures ANOVA).
Refer to Figure 3 for measurements and abbreviations.
![]()
DISCUSSION
CONCLUSION
Real-time B-TFE cine MRI is a valuable tool to evaluate the movements of the hyoid bone during deglutition.
The hyoid bone reaches its most anterior and superior positions at the oral (stage 2) and pharyngeal (stage 3) stages of deglutition, respectively. Open bite does not affect the displacement pattern of the hyoid bone during deglutition.
The hyoid bone is positioned more inferiorly and posteriorly in patients with open bite because of released tension of the suprahyoid muscles.
 XML Download