INTRODUCTION
Although superimposition of serial lateral cephalograms has been used to investigate the pattern and amount of tooth movement, it cannot be used for precise evaluation of tooth movement in the three-dimensional (3D) coordinates. Recently, a 3D virtual model has been introduced to analyze the movement of individual teeth by superimposition of pre- and post-treatment models.
1-
4 Cha et al.
2 reported no significant difference in the horizontal and vertical movements of the maxillary central incisor and first molar between superimposition of pre- and post-treatment lateral cephalograms and superimposition of pre- and post-treatment 3D virtual models. In addition, Lai et al.
3 asserted that 3D analysis of serial dental models could provide detailed information on tooth movements, especially in the transverse direction. In a 3D virtual model study of Class I bialveolar protrusion cases treated with first premolar extraction, sliding mechanics, and conventional anchorage, Cho et al.
4 reported that the maxillary posterior teeth showed significant mesial-in rotation and contraction toward the midsagittal plane.
The orthodontic mini-implant (OMI, known as a temporary anchorage device) has been used to provide maximum or absolute anchorage during en masse retraction of the maxillary anterior tooth, especially for the treatment of Class II division 1 (div.1) patients. However, few studies have been published regarding the treatment of Class II div.1 patients with extraction of the maxillary first premolars and the mandibular second premolars, sliding mechanics, and OMIs.
Therefore, the purpose of this retrospective study was to compare the effect of conventional and OMI anchorage on tooth movement and arch dimension change of the maxillary dentition in Class II div.1 patients treated with extraction of the maxillary first premolars and the mandibular second premolars and sliding mechanics using superimposition of 3D virtual maxillary models pre- and post-orthodontic treatment.
Go to :

MATERIALS AND METHODS
Twenty-four patients who met the inclusion criteria were included in this study. The following inclusion criteria, regarding age, skeletal pattern, Angle's classification, arch form, and treatment methods, were applied to the study cohort: 1) To reduce the residual growth effect, the minimum age for treatment for female patients was 14 years and that of male patients was 17 years; 2) Patients had Class II div.1 malocclusion, full Class II canine and molar relationships, and tapered or ovoid symmetric arch form; 3) Patients received treatment with extraction of the maxillary first premolars and the mandibular second premolars; and 4) Sliding mechanics (0.022-in MBT brackets [3M Unitek, Monrovia, CA, USA] with 0.019 × 0.025-in stainless steel wire) was applied in these patients.
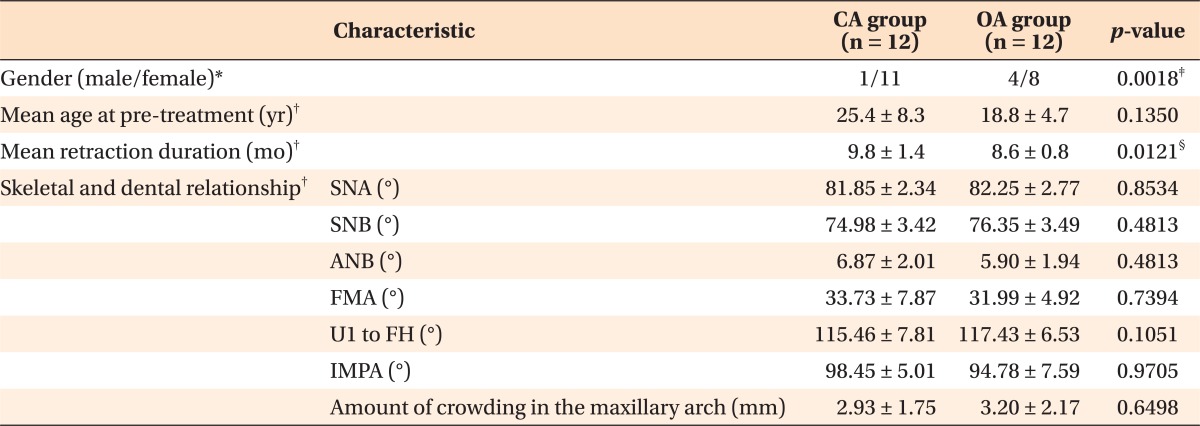
The patients were divided according to the anchorage method into a conventional anchorage group (CA group, n = 12; transpalatal arch and/or extraoral headgear) and an OMI anchorage group (OA group, n = 12, OMIs inserted at the buccal attached gingiva between the maxillary second premolar and first molar on both sides, 6 mm-length, 1.6 mm-diameter, Dual-top, Jeil Med. Co. Seoul, Korea). Although the average period for extraction space closure was significantly shorter in the OA group than in the CA group (8.7 months vs. 9.8 months,
p < 0.05), no significant difference in age or skeletal and dental relationships was observed between the two groups (
Table 1).
Table 1
Characteristics of patients in the CA and OMI anchorage groups

The 3D virtual maxillary models before (T0) and after treatment (T1) were constructed using a 3D laser scanner and the 3Txer program (Orapix, Seoul, Korea). Since the palatal rugae
5-
7 and the mid-palatal area between the maxillary first and second molars
4 are considered to be stable during orthodontic treatment, these areas were used as reference areas for superimposition of the 3D virtual maxillary models at the T0 and T1 stages using the best fit method (Rapidform 2006, 3D Systems Korea, Inc., Seoul, Korea) (
Figure 1).
 | Figure 1Superimposition three-dimensional virtual maxillary models of pre- and post-orthodontic treatment. 
|
To reduce errors of superimposition, the occlusal planes of the 3D virtual models were compared with those of the patients' lateral cephalograms. After superimposition of the T0 and T1 3D virtual models, the angular difference of the occlusal plane between the T0 and T1 stages was measured. The amount of change in the Frankfort horizontal (FH) to the maxillary occlusal plane angle between the T0 and T1 stages was measured on the lateral cephalograms (
Figure 2). If the angular difference between the 3D virtual models and lateral cephalograms was greater than 5°, superimposition of the 3D models was repeated to correct the error.
4
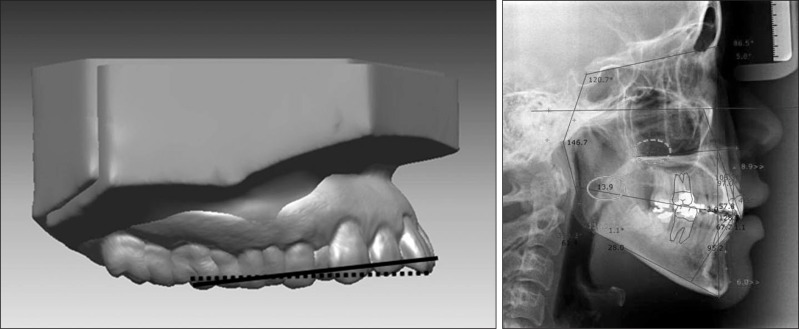 | Figure 2Verification of the superimposition accuracy of the three-dimensional virtual maxillary models (3D-VMXMs). The frankfort horizontal plane to the maxillary occlusal plane angle in the lateral cephalogram was measured at the pre (T0) and post-orthodontic (T1) treatment to verify the change in the occlusal plane of the 3D-VMXMs between the T0 and T1 stages.
|
The facial axis (FA) point
8 was used as a reference point because it does not change during orthodontic treatment compared with the incisal edge or cusp tip.
4 At the FA point of an individual tooth, a 3D coordinate system was established to measure the angular variables (
Figure 3). The three reference planes were used to locate the origin point and to measure the linear variables (
Figure 4).
 | Figure 3
A, Definition of the points. 1, Gingival point: the most concave and the lowest point in the cervical margin of the clinical crown; 2, occlusal point: the midpoint of the incisal edge of the incisors, the cusp tip of the canine and second premolar, and the most concave point between the mesiobuccal and distobuccal cusps of the molars; 3, mesial point: the most mesial point that is intersected between a parallel line of the facial axis of the clinical crown (5, FACC) and the Andrews plane (6) and; 4, distal point: the most distal point that is intersected between a parallel line of the FACC and the Andrews plane; 7, facial axis (FA) point. B, Definition of the coordinate system established at the FA point; X-axis, horizontal axis; Y-axis, a vertical axis that is perpendicular to the X-axis; Z-axis, a sagittal axis that is perpendicular to the X-and Y-axes.
|
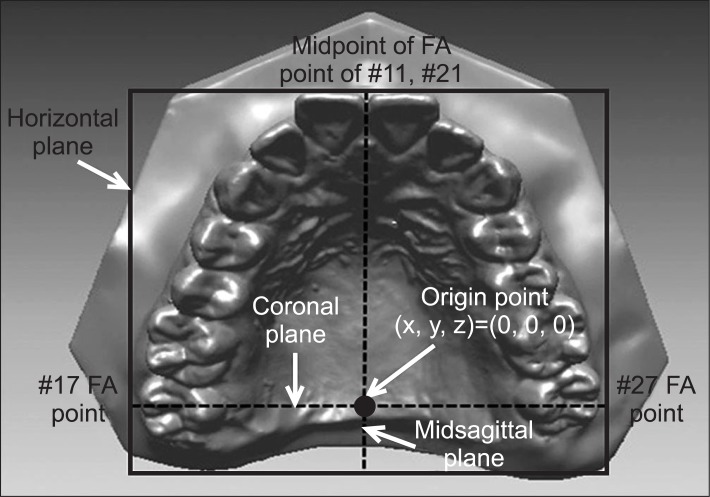 | Figure 4Definitions of the reference planes and origin at the occlusal view. The horizontal plane represents a plane that connects a midpoint between the facial axis (FA) points of the maxillary right and left central incisors (#11 and 21) and the FA points of the maxillary right and left second molars (#17 and 27). Midsagittal plane, a plane that passes through a midpoint between the FA points of #17 and 27 and is perpendicular to the horizontal plane; coronal plane, a plane that connects the FA points between #17 and 27 and is perpendicular to the horizontal and midsagittal planes; origin point is the intersection point of the 3 planes.
|
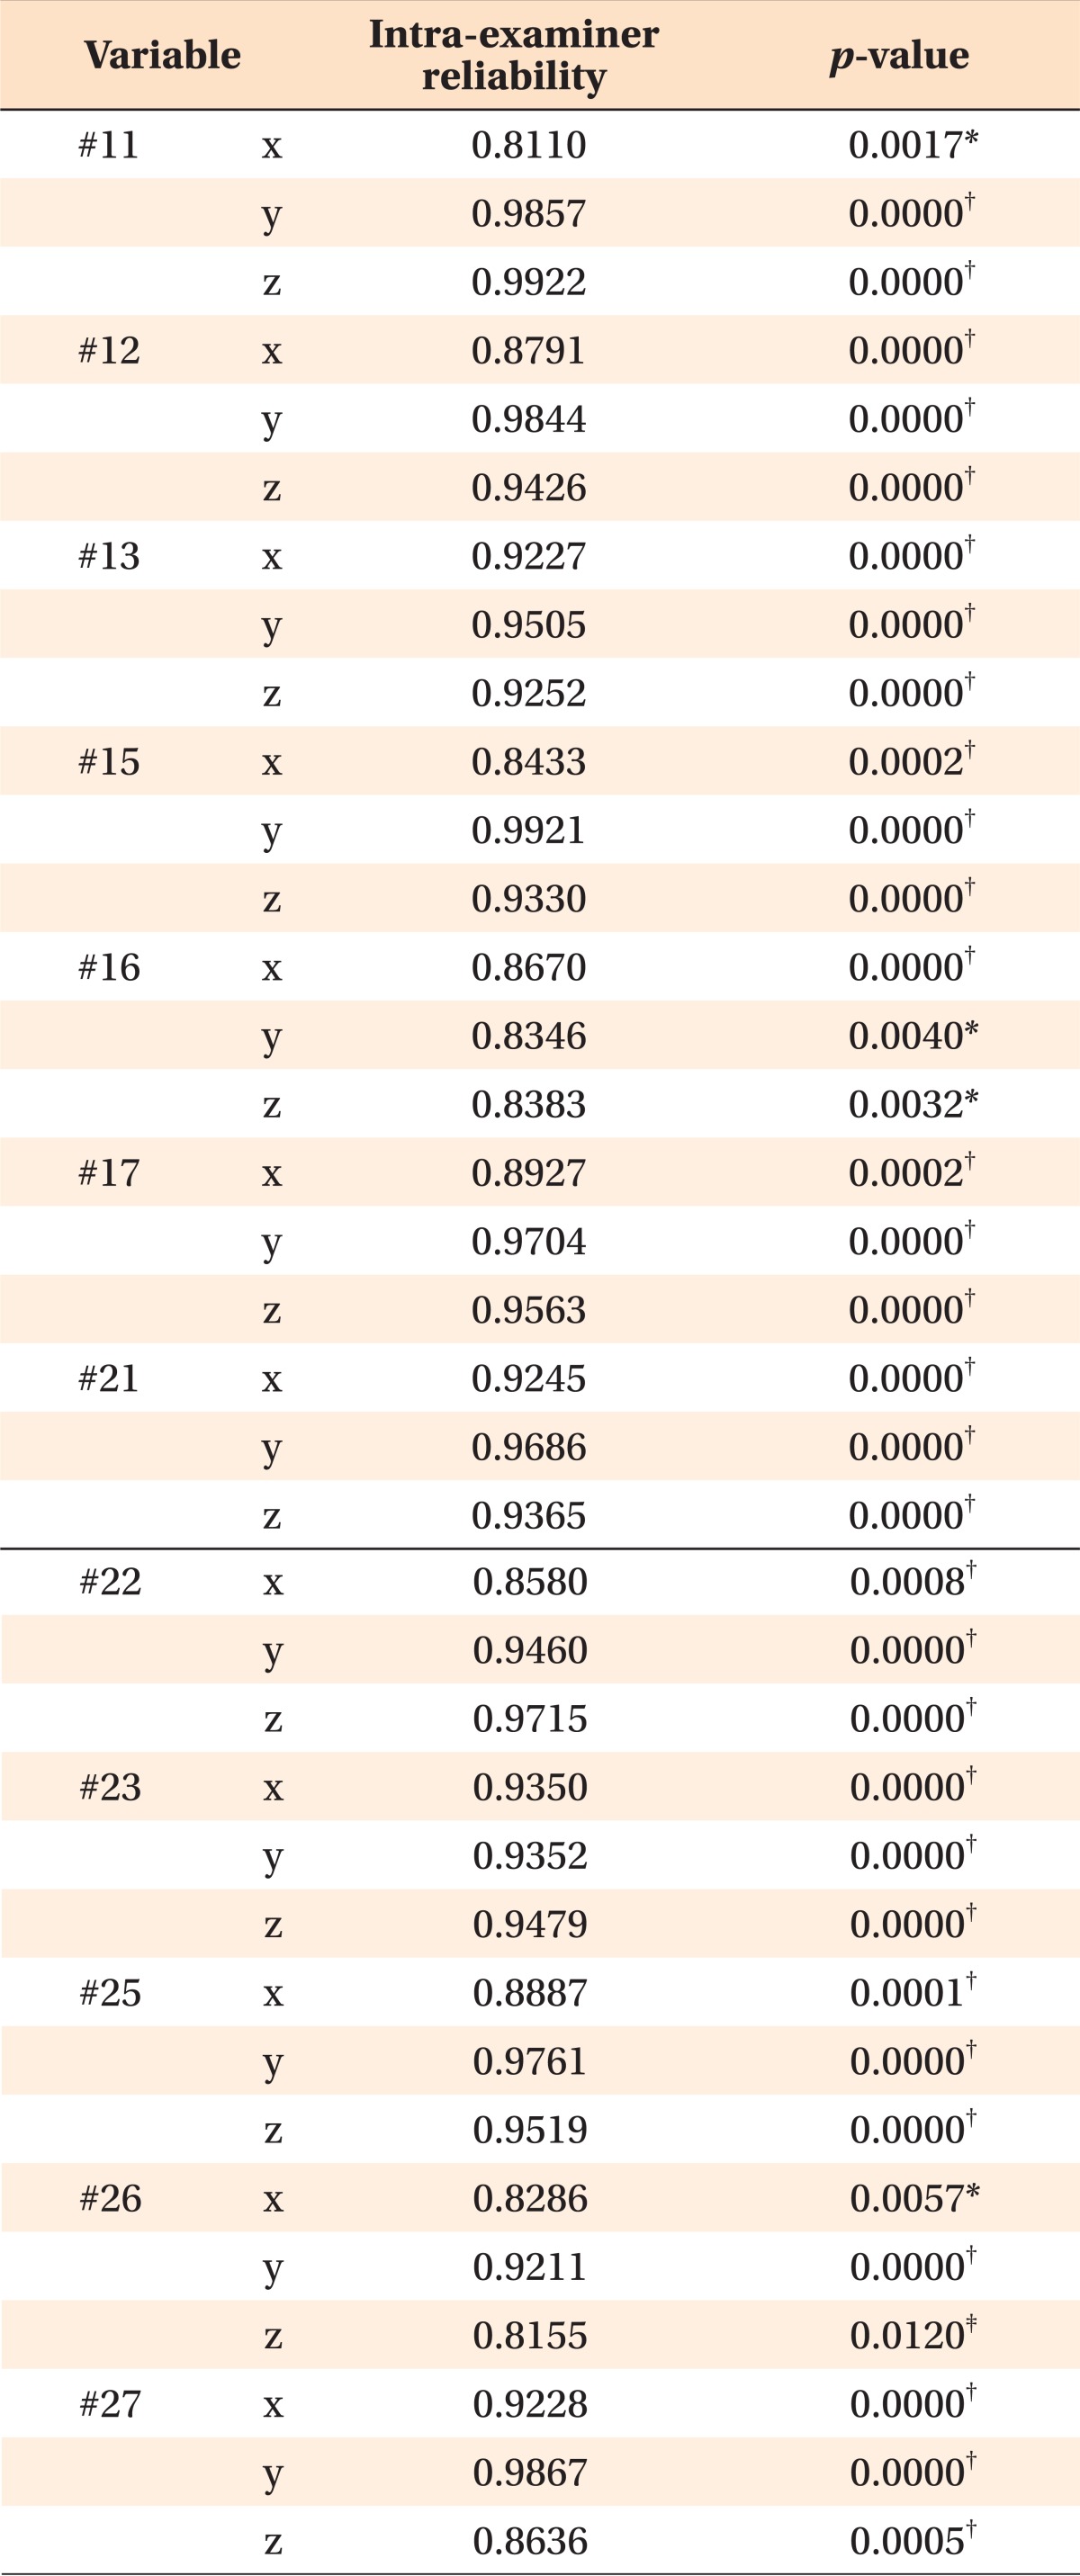
The reference points were digitized three times with a two-week interval by single examiner. Intraclass correlation coefficients (ICC) for reference point identification were computed to assess intra-examiner reliability (repeatability). Since the assessment of the intra-examiner reliability for reference point identification showed excellent ICC values (
Table 2), the first digitized data were used.
Table 2
Intraclass correlation coefficients of intra-examiner reliability
The linear variables (
Figure 5), angular variables (
Figure 6), and arch dimension variables (
Figure 7) at T0 and T1 stages were measured with the 3Txer program (Orapix). Since there were no differences in measurement of the variables between the right and left dentition, the data from both sides were combined. Mann-Whitney U-test for independent groups and Wilcoxon singed-rank test for dependent data were performed for statistical analysis.
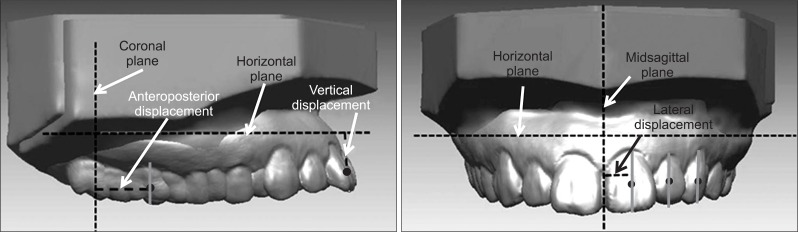 | Figure 5Linear variables. Vertical displacement refers to the perpendicular distance from the facial axis (FA) point of an individual tooth to the horizontal plane. Anteroposterior displacement refers to the perpendicular distance from the FA point of an individual tooth to the coronal plane. Lateral displacement refers to the perpendicular distance from the FA point of an individual tooth to the midsagittal plane.
|
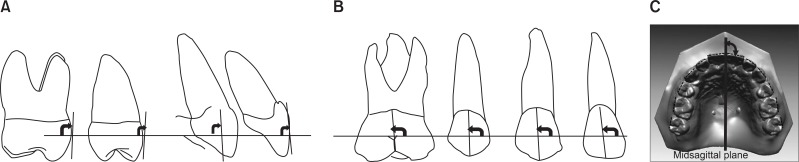 | Figure 6Angular variables. A, Inclination, angle between the facial axis of the clinical crown (FACC) of an individual tooth and the horizontal plane in the proximal view. B, Angulation, angle between the FACC of an individual tooth and the horizontal plane in the frontal view. C, Rotation, angle between the X-axis of an individual tooth and the midsagittal plane in the occlusal view.
|
 | Figure 7Arch-dimension variables. IMXCW, Inter-maxillary canine width; IMXP2W, inter-maxillary second premolar width; IMXM1W, inter-maxillary first molar width; IMXM2W, inter-maxillary second molar width; MXCD, maxillary canine depth; MXMD, maxillary molar depth; MXCI, maxillary central incisor.
|
Go to :
RESULTS
Comparison of the linear variables according to stage and group
There was significant difference in the values of linear variables between the two groups at T0 stage (
Table 3). In the CA group, the maxillary central and lateral incisors (MXCI and MXLI) moved backward (5.3 mm, 5.0 mm, both
p < 0.001) and were intruded (0.5 mm,
p < 0.05; 0.8 mm,
p < 0.001), and MXLI moved laterally (1.1 mm,
p < 0.001). Although there was no significant change in vertical displacement of the maxillary canine (MXC), MXC moved backward and laterally (5.2 mm, 0.8 mm, both
p < 0.001). The maxillary second premolar, and first and second molars (MXP2, MXM1, and MXM2) were extruded (0.5 mm,
p < 0.01; 1.5 mm,
p < 0.001; 1.5 mm,
p < 0.001), moved forward (1.5 mm, 1.4 mm, 1.3 mm, all
p < 0.001) and contracted (1.1 mm,
p < 0.001; 1.4 mm,
p < 0.001; 0.8 mm,
p < 0.01).
Table 3
Comparison of the linear variables according to stage and group
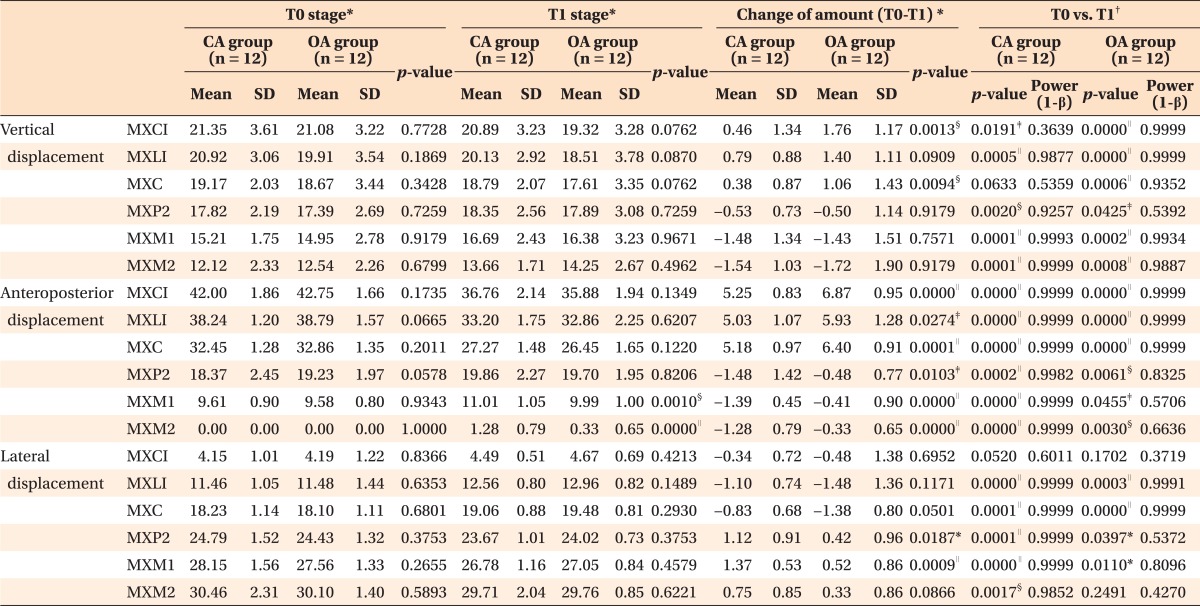
In the OA group, MXCI, MXLI, and MXC moved backward (6.9 mm, 5.9 mm, 6.4 mm, all p < 0.001) and were intruded (1.8 mm, 1.4 mm, 1.1 mm, all p < 0.001) while MXLI and MXC moved laterally (1.5 mm, 1.4 mm, all p < 0.001). MXP2, MXM1, and MXM2 moved forward (0.5 mm, p < 0.01; 0.4 mm, p < 0.05; 0.3 mm, p < 0.01) and were extruded (0.5 mm, p < 0.05; 1.4 mm, p < 0.001; 1.7 mm, p < 0.001), and MXP2 and MXM1 showed contraction (0.4 mm, 0.5 mm, both p < 0.05).
In the comparison of the amount of change between the CA and OA groups, the OA group showed more backward movement of MXCI, MXLI, and MXC (6.9 mm vs. 5.3 mm, p < 0.001; 5.9 mm vs. 5.0 mm, p < 0.05; 6.4 mm vs. 5.2 mm, p < 0.001); more intrusion of MXCI and MXC (1.8 mm vs. 0.5 mm, 1.1 mm vs. 0.4 mm, both p < 0.01); less forward movement of MXP2, MXM1, and MXM2 (0.5 mm vs. 1.5 mm, p < 0.05; 0.4 mm vs. 1.4 mm, p < 0.001; 0.3 mm vs. 1.3 mm, p < 0.001); and less contraction of MXP2 and MXM1 (0.4 mm vs. 1.1 mm, p < 0.05; 0.5 mm vs. 1.4 mm, p < 0.001) than CA group.
Comparison of the angular variables according to stage and group
The two groups did not show significant difference in the values of angular variables at T0 stage (
Table 4). In the CA group, MXCI and MXLI inclined lingually (6.1°, 3.2°, both
p < 0.001), and MXLI rotated distally (5.2°,
p < 0.01). There were no significant changes in the angular variables of MXC. Although MXP2, MXM1, and MXM2 did not show significant changes in inclination, they showed mesial tipping (4.0°,
p < 0.01; 5.2°,
p < 0.01; 6.7°,
p < 0.001) and mesial-in rotation (5.1°,
p < 0.001; 3.3°,
p < 0.001; 3.0°,
p < 0.01).
Table 4
Comparison of the angular variables according to stage and group
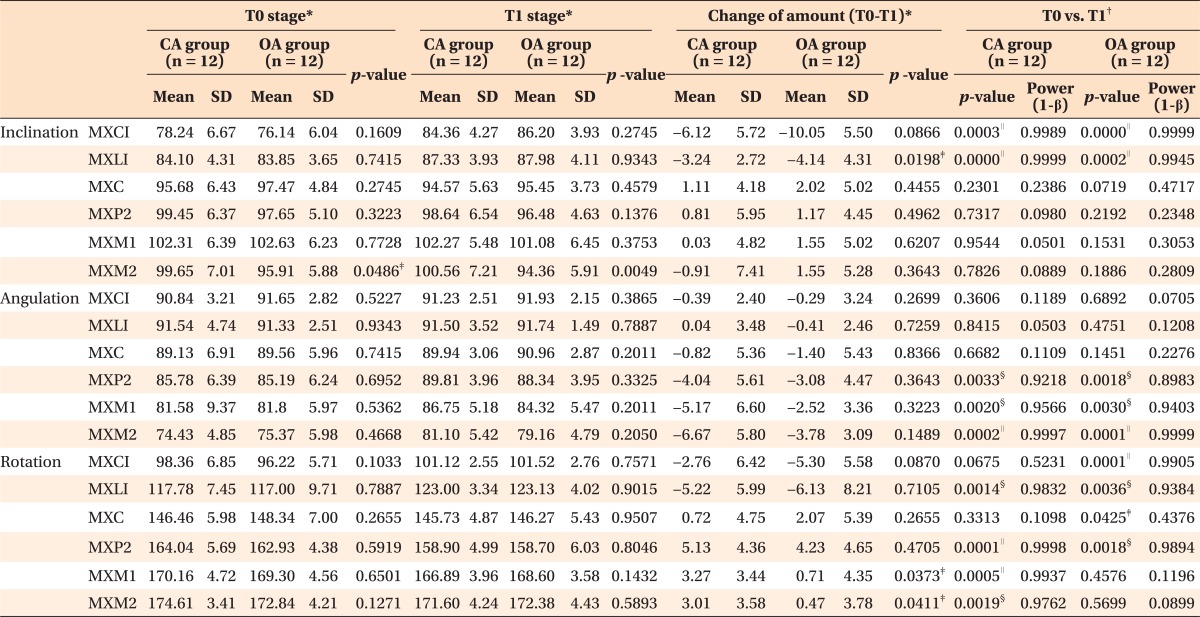
In the OA group, MXCI and MXLI were inclined lingually (10.1°, 4.1°, both p < 0.001) and rotated distally (5.3°, p < 0.001; 6.1°, p < 0.01). MXC did not show significant changes in inclination or angulation except for mesial-in rotation (2.1°, p < 0.05). Although MXP2, MXM1, and MXM2 did not show significant changes in inclination, they showed mesial tipping (3.1°, p < 0.01; 2.5°, p < 0.01; 3.8°, p < 0.001). Among them, only MXP2 was rotated mesially (4.2°, p < 0.01).
When the amount of change was compared between the CA and OA groups, the OA group showed more lingual inclination of MXLI (4.1° vs. 3.2°, p < 0.05) and less mesial-in rotation of MXM1 and MXM2 (3.3° vs. 0.7°, 3.0° vs. 0.5°, both p < 0.05) than CA group. However, MXP2, MXM1, and MXM2 did not show significant difference in the amount of change in mesial tipping between two groups.
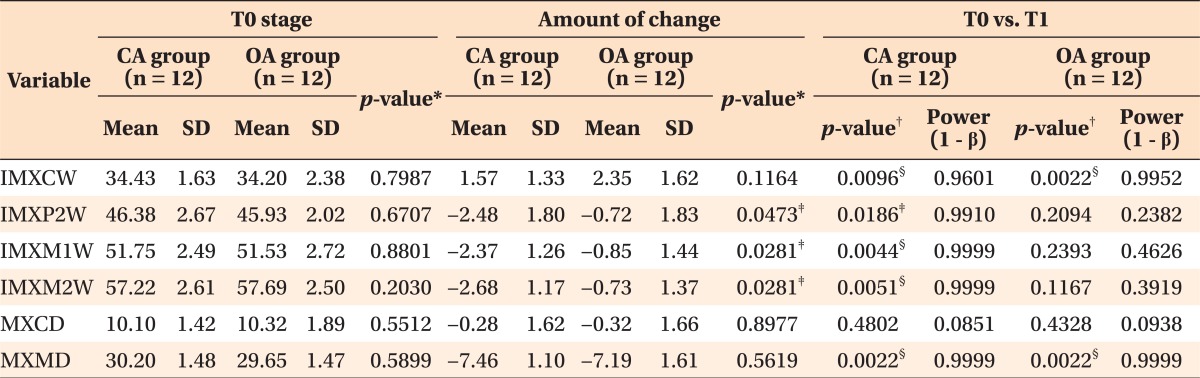
Comparison of the arch dimension variables
At T0 stage, there were no significant differences in the values of the arch dimension variables (
Table 5). Although inter-maxillary canine width (IMXCW) was increased in both groups (1.6 mm vs. 2.4 mm), there was no significant difference between the two groups. However, inter-maxillary second premolar width (IMXP2W), inter-maxillary first molar width (IMXM1W), and inter-maxillary second molar width (IMXM2W) were significantly decreased in the CA group compared to the OA group (2.5 mm vs. 0.7 mm, 2.4 mm vs. 0.9 mm, 2.7 mm vs. 0.7 mm, all
p < 0.05). Maxillary canine depth (MXCD) was not changed in either group. Although maxillary molar depth (MXMD) was decreased after treatment in both groups, there was no significant difference between the CA and OA groups (7.5 mm vs. 7.2 mm, respectively).
Table 5
Comparison of the arch-dimension variables between the 2 groups
Go to :
DISCUSSION
In the present study, significant differences were observed between the CA and OA groups in the amount of backward movement of the MXCI (5.3 mm vs. 6.9 mm,
p < 0.001) and forward movement of the MXM1 (1.4 mm vs. 0.4 mm,
p < 0.001). These findings indicate that the OA group showed more retraction of the anterior teeth (CA 79.7% vs. OA 94.5%) and less anchorage loss of the posterior teeth (CA 20.3% vs. OA 5.5%) compared to the CA group. Creekmore,
9 Ziegler and Ingervall,
10 and Thiruvenkatachari et al.,
11 have reported 33% to 37.5% of anchorage loss of the posterior teeth in conventional anchorage.
In the OA group, we observed significant intrusion of the FA points on the MXCI and MXLI (1.8 mm and 1.4 mm), which is in contrast to the result of Cho et al.,
4 who observed 2 mm extrusion of the maxillary anterior teeth in conventional anchorage. This difference appears to have occurred due to an intrusive force vector that connects elastics or springs to OMIs (
Figure 8). Upadhyay et al.
12 also reported 1.3 mm intrusion of the maxillary central incisors in Class II div.1 patients treated with OMIs to retract the maxillary anterior teeth.
 | Figure 8Schematic drawing of the force system using orthodontic mini-implant for en-masse retraction of the maxillary anterior teeth. The force (F) can be divided into the retraction force vector (R) and the intrusive force vector (I) to the maxillary anterior teeth in the lateral view and the lateral force vector (L) and the retraction force vector (R) in the occlusal view.
|
Although the FA points of the maxillary molars were extruded in both the CA and OA groups (MXP2, -0.5 mm vs. -0.5 mm; MXM1, -1.5 mm vs. -1.4 mm; MXM2, -1.5 mm vs. -1.7 mm; CA group vs. OA group, respectively), the difference between the two groups was statistically and clinically insignificant. The reason why the FA points of the maxillary posterior teeth were extruded in both CA and OA groups seemed to be related with changes in inclination (MXP2, 0.8° vs. 1.2°; MXM1, 0.0° vs. 1.6°; MXM2, -0.9° vs. 1.6°; CA group vs. OA group, respectively), lateral displacement (MXP2, 1.1 mm vs. 0.4 mm; MXM1, 1.4 mm vs. 0.5 mm; MXM2, 0.8 mm vs. 0.3 mm; CA group vs. OA group, respectively), rotation (MXP2, 5.1° vs. 4.2°; MXM1, 3.3° vs. 0.7°; MXM2, 3.0° vs. 0.5°; CA group vs. OA group, respectively), and resolution of the curve of Spee in the maxillary arch.
In both two groups, there was opposite movement in lateral displacement between the upper anterior and posterior teeth: distraction of the MXLI and MXC (1.1 mm and 0.8 mm in the CA group, both
p < 0.001; 1.5 mm and 1.4 mm in the OA group, both
p < 0.001) and contraction of the MXP2 and MXM1 (1.1 mm and 1.4 mm in the CA group, both
p < 0.001; 0.4 mm and 0.5 mm in the OA group, both
p < 0.05). In addition, a significant difference existed in the amount of contraction of the MXP2 and MXM1 between the CA and OA groups (1.1 mm vs. 0.4 mm,
p < 0.05; 1.4 mm vs. 0.5 mm,
p < 0.001, respectively). The CA group had similar amounts of contraction in the posterior teeth to those described by Cho et al.,
4 who reported 1.2 mm to 1.4 mm in the posterior teeth. However, the OA group showed a nearly stable position of the posterior teeth in lateral displacement because OMIs could prevent or minimize the forward movement and mesial-in rotation of the posterior teeth, and a lateral force vector could avoid constriction of the arch (
Figure 8).
The amount of lingual inclination of the MXCI in the CA and OA groups (6.1° and 10.1°, respectively) indicates that OMIs could produce more lingual inclination than conventional anchorage. Upadhyay et al.
12 reported 12.4° lingual inclination of the MXCI in Class II div.1 patients treated with OMIs; a similar finding was obtained in the present study.
The amount of mesial-tipping of the MXM1 in the CA group (5.2°) was similar to that reported by Upadhyay et al.
13; 4° in the conventional treatment of Class II malocclusion based on superimposition of the cephalograms. However, OMIs reduced mesial tipping of the MXM1 to 2.5° in the OA group, although there was no significant difference between the CA and OA groups.
In the present study, the amount of mesial-in rotation of the MXC in the CA group (approximately 0.7°) was similar to that reported by Koh et al.
14 (approximately 0.3° in the Class I group) and different from that reported by Cho et al.
4 (distal-in rotation, 0.2°). In addition, the amount of mesial-in rotation of the MXC in the OA group (2.1°) was significantly greater than that reported by Koh et al.
14 The reason for this difference may be that the MXC rotated more mesially in the OA group than in the CA group due to rounding of the tapered arch form by alignment and en-masse retraction of the anterior teeth.
The amounts of mesial-in rotation of the MXM1 and MXM2 in the CA group were approximately 3.0°; this is similar to the result reported by Cho et al.
4 (approximately 4.0° in the Class I group). However, the amounts of mesial-in rotation of the MXM1 and MXM2 in the OA group (0.7° and 0.5°, respectively) were significantly lower than those reported by Cho et al.
4 These differences may help to establish the Class I molar relationship and seem to be related to the effect of individual arch curvature, anchorage device, or treatment mechanics on the amounts of rotation of the MXM1 and MXM2.
There was a larger decrease in the IMXP2W, IMXM1W, and IMXM2W in the CA group than in the OA group (2.5 mm vs. 0.7 mm, 2.4 mm vs. 0.9 mm, 2.7 mm vs. 0.7 mm, respectively, all
p < 0.05). The amount of decrease in the IMXM1W in the CA group appears similar to that reported by Ong and Woods,
15 who reported a 2.6 mm decrease in the maxillary intermolar width in the maxillary first premolar and mandibular second premolar extraction group using a preangulated edgewise appliance. However, in the OA group, since OMIs seemed to maintain the positioning of the maxillary posterior teeth and to produce less mesial-in rotation of the maxillary posterior teeth during space closure, the decrease in the IMXP2W, IMXM1W, and IMXM2W was lower than in the CA group.
Since the pattern and amount of changes in the FA point can be different from those of the incisal edge or cusp tip, the data obtained in this study should be carefully interpreted for clinical application. Although 3D virtual technology can be used to explain tooth movement and arch dimension change of the maxillary dentition, further studies are needed to define a clear methodology for superimposition of the mandibular dentition.
Go to :


 PDF
PDF ePub
ePub Citation
 Print
Print


 XML Download