

 PDF
PDF ePub
ePub Citation
 Print
Print


INTRODUCTION
A common and fundamental objective in Class II orthodontic correction is the establishment of a Class I molar relationship.1,2 To this end, it is important to identify whether higher occlusal contacts are achieved more with a Class I than Class II molar relationship. Furthermore, it is essential to determine whether distal displacement of molars within the maxilla can be achieved by the Class II correction strategy, or whether premolar extraction is necessary.
Molar relationships are generally analyzed from the buccal, rather than the lingual, aspect, because the latter is difficult to do without splitting dental casts. However, American Board of Orthodontics (ABO) guidelines have emphasized the importance of occlusal contact of the molar and premolar lingual cusps on the occlusal surface of the opposing teeth.2 In the classical text on tooth form, for instance, Russell3 demonstrated how important it is for the palatal cusp of the upper molar to be seated in the central fossa of the lower first molar. The position of the palatal cusp of the maxillary first molar was recently emphasized by Liu and Melsen,1 who performed examinations from both the buccal and lingual aspects when assessing Class II molar relationships. In order to avoid splitting study casts that had been made of the lingual surfaces of the first molars, the authors placed a dental mirror at a 45-degree angle to each cast when classifying relationships.
In general, orthodontic diagnosis of occlusion is mainly morphological and static, and is not directly related to normal function or functional disorders. Measuring the occlusal contact areas may serve as a pre- and post-treatment record of the functional relationship of occlusion, and, further, may facilitate the assessment of functional changes following active orthodontic treatment. In turn, a more differentiated diagnosis of molar relationships may help identify the true nature of the malocclusion, thus enabling the application of more suitable treatment approaches.
Until now, few studies have evaluated the occlusal contact areas of different levels of Class II molar relationships nor compared these with Class I molar relationships. Therefore, this study was performed with 2 main goals: firstly, to evaluate the consistency of molar relationship assessments performed from both the buccal and lingual aspects; and, secondly, to compare the occlusal contact areas of different severities of Class II and Class I molar relationships in 3-dimensional (3D) models.
MATERIALS AND METHODS
Sample selection
We evaluated 553 study casts that had been clinically diagnosed as having Class I or Class II molar relationships on one or both sides. Casts were obtained from the records of 3,000 consecutively screened patients who visited the orthodontic clinic at Ewha Womans University Mokdong Hospital (Seoul, Korea) from 1994 to 2010. The mean subject age was 22.9 years (standard deviation, 8.73; range, 14.8 - 48.4 years).
Sample selection was based exclusively on the initial anteroposterior dental relationship, regardless of any other dentoalveolar or skeletal characteristics. All study casts had a complete dentition up to at least the second molar and were registered by bite-wax and uniformly trimmed. Casts were excluded with following criteria: fractured cusps or severe attrition, molars or premolars on which more than two-thirds of the occlusal surface had been reconstructed, supernumerary or congenitally missing teeth, ectopic teeth, tooth aplasia, or anomalies in tooth shape, anterior or posterior crossbite, irregularities on the occlusal surfaces on the cast, or minimal premolar rotations and incisor irregularities. Additionally, none of the patients had a history of previous orthodontic treatment. This left a final sample size of 232 pairs of dental casts obtained from 232 subjects (166 women and 66 men), and a total of 380 sides (right, left, or both) for analysis.
Classification of molar relationships
We evaluated study casts from both the buccal and lingual aspects. The classifications for buccal aspect analyses used in this study are similar to those devised by Liu and Melsen,1 but have been simplified into only 3 categories:
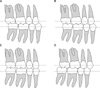
(1) Class I (Class I molar relationship): The mesiobuccal cusp of the upper first molar is in occlusion with the mesiobuccal groove of the lower first molar (Figure 1A).
(2) Class II-m (mild or moderate Class II molar relationships): The mesiobuccal cusp tip of the upper first molar is located between the mesiobuccal groove and cusp tip of the lower first molar (Figure 1B and 1C).
(3) Class II-s (severe Class II molar relationship): The mesiobuccal cusp tip of the upper first molar is located on anterior aspect of the mesiobuccal cusp tip of the lower first molar (Figure 1D).
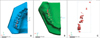
A 3D dental laser scanner (KOD-500; Orapix Co. Ltd., Seoul, Korea; accuracy: ±20 µm; mode: high-resolution) was used to perform surface scanning and to create 3D digital models of all study casts. This method, which is known to be highly accurate,4 allowed us to classify molar relationships from the lingual aspect as well. Surface datasets were imported into Rapidform XOR3® software (INUS Technology Inc., Seoul, Korea)5 as a triangulated 3D mesh. Then the lingual surfaces at a sectioned image were assessed, making it possible to identify the position of the mesiopalatal cusp of the upper first molar with respect to the lower (Figure 2). Furthermore, the lingual relationship was classified according to the functional intercuspations between the maxillary and mandibular first molars (Figure 3):
(1) Lingual 0: The mesiopalatal cusp of the upper first molar occludes with the distal triangular fossa of the lower first molar.
(2) Lingual 1: The mesiopalatal cusp of the upper first molar occludes with the central fossa of the lower first molar.
(3) Lingual 2: The mesiopalatal cusp of the upper first molar occludes with the mesial triangular fossa of the lower first molar.
(4) Lingual 3: The mesiopalatal cusp of the upper first molar is seated on the anterior aspect of the mesial triangular fossa of the lower first molar.
Although this categorization scheme generally follows that of Liu and Melsen,1 we added the category "lingual 0" in order to improve specificity.
Analysis of the occlusal contact area
3D digital models were used to analyze the occlusal contact areas. The models were digitally post-processed using Rapidform XOR3® software. In this program, the areas of intersection of the upper and lower scanned mesh areas, i.e., the occlusal contact areas, were calculated using the Boolean function (Figure 4). An automated measuring tool was used to quantify the occlusal contact areas of the 2 molars and premolars on each side.
Intra-examiner error
Four weeks after the initial measurement, we evaluated intra-examiner error by randomly selecting, and reclassifying the molar relationships of 30 casts. A chi-square test was used to evaluate the reliability of our measuring techniques; no significant differences were found between the 2 samples (p > 0.05).
Statistical analysis
Descriptive statistics, including the mean, standard deviation, and 95% confidence intervals associated with the occlusal contact areas, were calculated for each classification group (e.g., buccal I, II-m, and II-s; lingual 0-3). Among-group differences in occlusal contact areas were evaluated with two-way analyses of variance (ANOVA), followed by Tukey Honestly Significant Difference (HSD) post-hoc tests. A chi-square test was used to determine consistency of molar relationship classification performed from the buccal and lingual aspects. Significance was defined as α < 0.05. All statistical analyses were performed using PASW Statistics 18 (IBM Co., Armonk, NY, USA).
RESULTS
Molar relationships determined from the buccal and lingual aspects
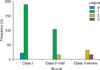
Table 1 and Figure 5 show sample distributions resulting from the buccal and lingual aspect analyses. Of the 380 sides analyzed from the buccal aspect, 211 were Class I, 120 were Class II-m, and 49 were Class II-s. Among those designated as Class I, only 10.4% of molar relationships were determined as level 0 (22 of 211) from the lingual aspect; however, the frequency rose to 89.6% for level 1 (189 sides of the 211 sides) relationships. Among those designated as Class II-m, a similarly high number of level 1 relationships, 86.7% (104 of 120), were determined from the lingual aspect. However, only 13.3% (16 of the 120 sides) of level 2 relationships were detected in this group. Finally, among relationships designated as Class II-s from the buccal, lingual aspect analysis revealed 65.3% of sides (32 of 49) as level 2, and 34.7% (17 of 49) as level 3.
Results of the chi-square test revealed significant differences in classifications resulting from buccal and lingual aspect analyses (p < 0.05).
Occlusal contact areas associated with each buccal and lingual molar relationship
Mean occlusal contact areas of all groups are shown in Table 2. In general, contact areas determined from buccal data were highest for Class I (79.77 ± 11.62 mm2), followed by Class II-m (62.58 ± 11.09 mm2), and then Class II-s (36.99 ± 13.95 mm2). However, the only statistically significant difference was the one between Class II-s and the other 2 groups (both p < 0.05).
Mean occlusal contact areas, as determined by lingual analyses, were highest in group 1 (73.51 ± 8.37 mm2), followed by group 0 (69.38 ± 15.92 mm2), then group 2 (59.49 ± 12.28 mm2), and finally group 3 (46.74 ± 21.64 mm2). Group 1 values were significantly higher than those for all other groups except group 0 (p < 0.05). There were no other significant differences among the groups (all p > 0.05).
DISCUSSION
We used 3D modeling to evaluate the consistency of buccal and lingual analyses of molar relationships. In addition to revealing that this categorization technique is associated with high intra-examiner reliability (p > 0.05), our results indicate that classifications derived from buccal and lingual molar aspect analyses are consistent only when the upper and lower first molars are in a Class I relationship (189 sides, 89.6%). We have considered lingual 0, 1, 2, and 3 as mild lingual class III, lingual Class I, mild, and severe lingual Class II, respectively.
Conflicting buccal and lingual categorizations were made for 61.5% (104 of 169 molars) of molar relationships determined, from buccal analyses, Class II. This level of buccal-lingual consistency (e.g., in only 38.5% of cases) was markedly lower than that found in molar Class I (89.6% of cases). Surprisingly, the majority (86.7%) of cases categorized as Class II from buccal data were determined to be Class I when observed from the lingual aspect (lingual 1). In other words, only a small percentage of the models reported as having a Class II molar relationship were truly Class II (lingual 2, 3). Indeed, cases classified as Class II from the lingual aspect (lingual 2, 3) always tended to be less severe than their buccal counterparts at each sublevel (Table 1).
These patterns result from the anatomical features of the upper and lower first molars in occlusion. Specifically, the lower first molar erupts into dentition prior to its upper counterpart, thereby facilitating "cusp-to-fossa" occlusion. Three fossae - the mesial triangular, central, and distal triangular - are functionally available on the occlusal surfaces of the lower molars to occlude with the upper palatal cusps.3 In the majority (89.9%) of Class II cases examined here, the upper mesiopalatal cusp was seated in either the mesial triangular (28.4%) or central (61.5%) fossae.
Molar rotation6-10 is another common cause of inconsistencies in buccal and lingual classifications of molar relationships.1 For example, Braun et al.7 reported that rotation of the upper first permanent molar existed in 85% of all orthodontic conditions, 90% of all Class II division 1 cases, and 100% of all maxillary constrictions studied. Because it is triple-rooted and has a trapezoidal configuration, the upper first molar is more prone to rotation than its lower counterpart.
Our findings suggest that the upper mesiopalatal cusp functions as a pivotal axis around which the upper first molar rotates. This cusp occludes most frequently in the central fossa, less frequently in the mesial triangular fossa, and rarely anterior to the mesial triangular fossa. The mild buccal Class II molar relationship is clinically referred to as "half cusp Class II"; among our study group, a large portion of these cases were more comparable to buccal Class I than severe buccal Class II (or "full cusp Class II") when analyzed from the lingual perspective. Given that the palatal cusp is the functional cusp of the upper molar, this implies that the functional properties of half cusp Class II are more similar to buccal Class I - a hypothesis that was partially verified by the occlusal contact areas measured in our samples.
Functional evaluation of occlusion is commonly based on measurements of occlusal contact areas.11,12 For instance, Luke and Lucas13 reported that masticatory performance is highly correlated with the occlusal area of teeth posterior to the canine. An even more important factor controlling the masticatory performance of human subjects with natural teeth is the amount of occlusal contact area between the molar and premolar teeth, which is on average, one-fifth of the total occlusal surfaces.14 Therefore, in this study, the occlusal contact area was used as a parameter for comparing the occlusion of Class I and Class II molar relationships.
Specifically, we found that mean occlusal contact area was significantly higher in Class I cases than in Class II cases (79.77 ± 11.62 mm2 vs. 62.58 ± 11.09 mm2 for Class II-s and 36.99 ± 13.95 mm2 for Class II-m) (Table 2). Although differences between Class I and mild Class II values were not significant, there were significant differences between severe Class II values and those of other groups.
In our sample, severe Class II cases exhibited good interdigitation from the buccal aspect, but had the smallest occlusal contact areas. Furthermore, these findings were significantly different from those measured in Class I cases. In contrast, mild Class II cases had poor interdigitation from the buccal aspect, but occlusal contact areas were similar to those documented in Class I cases. Moreover, these values were significantly higher for mild Class II molar relationships than for severe Class II relationships (Table 2). Thus, we conclude that functional occlusions are better for mild buccal Class II cases than severe Class II cases.
Our measurements of mean occlusal contact areas also highlighted the importance of the cusp-to-central fossa relationships (lingual 1). The mean value (73.51 ± 8.37 mm2) was associated with significantly (p < 0.05) greater mean occlusal contact area than was measured for any other lingual relationship except cusp-to-distal triangular fossa (lingual 0). However, the differences between cusp-to-mesial triangular fossa (lingual 2) and cusp-to-marginal ridge relationships (lingual 3) were not statistically significant (p > 0.05). In general, our findings were in accordance with those previously reported by others. For instance, in a study on associations between occlusal parameters and comminution of solid food during chewing, Sierpinska et al.15 found that the mean area of the chewing platform was 125.12 ± 46.5 mm2 in subjects with full dentitions (in 25 completely dentate subjects; 28 teeth, 14 functional dental units).
When considering the results of research on occlusal contact areas, it is important to take note of the methods used to quantify this variable, and whether they are appropriate for each particular analysis. Contact area has frequently been measured with T-Scan II equipment (Tekscan Inc., Boston, MA, USA),16,17 which is a reliable method for the analysis and evaluation of occlusal contact distribution in maximum intercuspation. This value is calculated by multiplying the number of tooth contacts recorded by the T-Scan sensor by the size of a single pixel (1.6 mm2), thus reflecting occlusal conditions. However, one limitation of the system is that values are recorded during real-time occlusal contacts generated by occlusal forces in the oral cavity. Both maximum occlusal force (N) and occlusal contact area (mm2) have also been evaluated using horseshoe-shaped pressure-sensitive films (Dental Prescale 50H, R type; Fujifilm, Tokyo, Japan), which exhibit color variation and yield an area dependent on the amount of applied pressure within a range of 5 - 120 MPa. The system then automatically estimates the occlusal pressure and contact area by measuring color density and area data. However, because this method is associated with variations in occlusal pressure, all subjects must cooperate if records are to be obtained in a uniform fashion.18-20 Since the aim of the current study was to analyze the occlusal contact areas without taking occlusal forces into consideration, we felt it was most appropriate to use 3D digitalization, which is not associated with mastication components that are difficult to control.
Overall, the majority of cases categorized as mild Class II included lingual Class I (lingual 1) classifications, while the majority of cases categorized as severe Class II included lingual Class II (lingual 2, 3) classifications. Thus, from the buccal aspect, individuals with severe Class II seem to have better interdigitation than those with mild Class II, though the occlusal contact area of the former may not necessarily be greater than that of the latter. These differences between buccal and lingual classifications can have significant clinical impacts, as recently emphasized by Korn.21 For example, it is necessary to identify the category of the molar relationships during the treatment planning stage to correct a malposed upper first molar. Class I lingual molar relationships (lingual 1) can most likely be corrected by rotation around the lingual cusp. This displacement will generate sufficient space for the correction of the mild Class II tendency observed in the molar region. By contrast, molar relationships categorized as Class II (lingual 2, 3) from lingual aspect analyses are more likely to have a skeletal discrepancy and reflect a true discrepancy in the sagittal jaw relationship. A skeletal correction is required in such cases.
Although our statistical analyses revealed convincing, and consistent patterns, there were some limitations to our study. First, our strict inclusion criteria caused us to exclude many samples, particularly those belonging to the Class II-s group; as a result, we did not have even numbers of samples for each category. Secondly, deviation from mean values was sometimes considerable, possibly as a result of differences in tooth size or errors made in the process of creating impressions and casts; there may also have been some errors made during the 3D scanning procedure. In order to verify the accuracy of our findings, and to further our understanding of the occlusal contact between the upper and lower teeth and how this can be evaluated from both the buccal and lingual perspectives, we encourage future studies with larger sample sizes, measurements of dynamic occlusal force, and prospective study designs.
CONCLUSION
The classifications of buccal (particularly buccal Class II) and lingual molar relationships were not always consistent. A large portion of molars that were categorized buccally as Class II were categorized lingually as Class I. The smallest occlusal contact area was observed in cases of severe buccal Class II molar relationships, which could be inferred as having the worst molar relationship among these groups-especially from the lingual aspect.


 XML Download