

 PDF
PDF ePub
ePub Citation
 Print
Print


INTRODUCTION
Anchorage reinforcement is one of the major factors underlying successful orthodontic treatment.1,2 The advantages of orthodontic mini-implants (OMIs) are broadly recognized. They are small, relatively non-invasive, easily manipulated, and versatile in that their insertion sites can be varied. Long-term (8 - 12 months) success rates of OMIs have been reported to range from 76.1 - 91.6%.3-5
Host factors affecting the stability of an OMI include bone quantity and quality, root proximity, soft tissue thickness, patient age, and facial morphology. Insertion site, surgical technique, force of application, and inflammation control are also closely related to success rate.3-6 Among these factors, the thickness of the cortical bone was noted as a major risk factor for OMI failure. Kuroda et al.3 reported that a patient's age, sex, anteroposterior jaw relationship, and mandibular plane angle were not correlated with success rate. However, Miyawaki et al.4 reported that OMI failure rates increased in patients with thin cortical bone thickness and high mandibular plane angle.
Human mandibles (teeth, periodontal ligament, cancellous bone, and cortical bone) managed in the field of dentistry can be reproduced structurally from a mechanical engineering perspective. The lower jaw border is known to deform outwardly during clenching particularly in the posterior region, mainly due to the high activity of the masseter muscle.7 Three-dimensional (3D) computed tomography (CT) and computer-aided design (CAD) have been applied to the transformation of 3D dental and craniofacial geometry into finite element (FE) models.8 In contrast to ideal models constructed by an engineering specialist,9 customized and anatomically correct FE models are available on a real-time and personalized basis. In addition to modeling, material properties and boundary conditions are important for improving the accuracy, validity, and efficiency of FE analysis.
In this study, 3 FE models with a mandibular posterior OMI were constructed using CT images of 3 subjects with different mandibular plane angles. The aims of this study were to investigate (1) whether the mandibular deformation under clenching is influenced by facial type, (2) the characteristics of peri-orthodontic mini-implant compressive strain (POMI-CSTN) between the mandibular posterior teeth developed by clenching, and (3) the clinical implications of mandibular deformation related to the stability of OMIs.
MATERIALS AND METHODS
Construction of the FE model
Three FE models were constructed using CT images of 3 adult males with different Frankfurt mandibular plane angles (FMAs). The FMAs of models A, B, and C were 16° (low angle), 24° (average angle), and 40° (high angle), respectively. The patients were 43, 53, and 58 years old and had no third molars. This study was approved by the Institutional Review Board of Asan Medical Center.
The mean window width obtained from the 3 subjects was applied for the cortical bone segmentation. First, 6 CT images of each subject were selected at even axial intervals from the cemento-enamel junction (CEJ) level of #46 to the lower border of the mandible. The window width used to isolate the entire cortical bone region from other structures was confirmed using PACS viewer (V-works 4.0; Cybermed Inc., Seoul, Korea). The window widths of the 18 selected images ranged from 284 - 1,829 Hounsfield units.
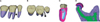
To generate the mandibular volume, the CT images of each subject were transferred to Bionix Body Builder software (version 3.0; CANTIBio Inc., Suwon, Korea). The cortical bone regions of the 3 subjects were segmented based on a pre-defined threshold level (average window width). A 3D patient-specific surface mesh (raw model) was generated and exported into the format of the FE model (Figure 1A). HyperMesh software (version 8.0; Altair Engineering, Troy, MI, USA) was used to remesh the inside surface geometry of the mandible using tetrahedral elements with the standard growth and normal mesh generation options (Figure 1B). Three craniomandibular FE models were constructed with different FMAs (Figure 2).
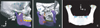
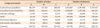
The OMI design was based on the ARC T1208 (1.2 mm in diameter and 6.5 mm in length; Biomaterials Korea Inc., Seoul, Korea), and it was placed between the roots of #45 and #46, perpendicular to the outer surface of the cortical bone (Figure 3A and 3B). The tetrahedral elements of the cortical bone around the OMI were finely meshed to be 0.05 mm per side. All nodes between the bone and the OMI were shared. The cancellous bone surrounded by the cortical bone was homogeneously auto-meshed (Figure 3C). The temporomandibular joints were each modeled as a pair of caps duplicated from the elements of the condyle. The first cap was assumed to represent articular cartilage and the second cap was modeled as cortical bone of the glenoid fossa of the temporal bone (Figure 3D). The number of nodes and elements in the 3 FE models are summarized in Table 1.
Material properties
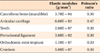
The material properties of the teeth, periodontal ligament, cancellous bone, and titanium were assigned as linear and isotropic (Table 2).7 According to Korioth and Hannam,7 mandibular cortical bone was considered to behave orthotropically, that is, its properties were assumed to differ in the x, y, and z directions, with the largest stiffness oriented along the long axis of the mandible (Table 3). To facilitate the delicate orthotropic simulation, the mandible was divided into 5 sections, and the cylindrical coordinate system corresponding to the orthotropic directions was allocated to each mandibular section. The long axis of the mandible represented the material x'-axis of each bone section. The y'-axis was bucco-lingually perpendicular to the x'-axis but tangential to each related jaw cross-section. The material z'-axis was perpendicular and vertically oriented with respect to the x'- and y'-axes (Figure 4).
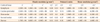
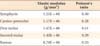
The isotropic material properties of the cortical bone sections were deduced from the orthotropic material properties on the assumption that the corresponding expressions of strain energy densities derived for the orthotropic and isotropic materials were equivalent under identical boundary conditions (Table 4).10 A total of 8 conditions were simulated (Table 5).
Boundary conditions
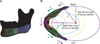
Tooth clenching was simulated by contraction of the temporal, master, lateral, and medial pterygoid muscles in the intercuspal position. The total jaw closing force was 757.5 N/side.7 Directions of the muscle contraction were defined by the nodal coordinate systems between nodes on the cranium and mandible. The origin and insertion areas of each muscle were individually determined based on textbooks of human anatomy (Figure 5A and 5B).11,12 The nodes on the functional cusp and fossa of premolars and molars were restrained from bilateral and vertical (z'-axis) movement. The right and left cortical regions of the glenoid fossa were fixed in 3 dimensions. The articular disc acted as a cushion between the condyle and the temporal bone.
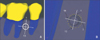
All analyses were performed using ANSYS software version 11.0 (ANSYS Inc., Canonsburg, PA, USA) and processed on an HP XW6400 workstation (Hewlett-Packard Co., Palo Alto, CA, USA). The results of the FE analysis were evaluated with respect to deformation and strain distribution for the 3 mandibles. Mandibular deformations were compared using the "deformed shape-undeformed model" display option. The deformed shapes were magnified 100 times to differentiate the various deformations macroscopically. The compressive strain contour plot (negative value) or tensile strain contour plot (positive value) of the cortical bone represented the regional surface deformation of the mandible. All strain values are given in units of microstrain (µE). Twenty-four nodes of the cortical bone around the OMI were selected for POMI-CSTN analysis (Figure 6).
To prevent nodal solution averaging effects during post-processing with ANSYS, which occur at the interfaces of materials with different material properties, the elements of the cortical bone, titanium, and cancellous bone were grouped according to their material properties. Prior to POMI-CSTN analysis, the cortical bone was selected according to its geometry and material properties. To compare POMI-CSTN under orthodontic force, the lower right portion of model A (the dento-alveolar structure including #45, #46, and the OMI) was trimmed, and 150 g or 200 g of traction force was applied distally on the head of the OMI parallel to the dental arch.
RESULTS
Deformation of the mandible and cortical bone strain
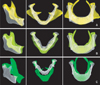
The deformation patterns for each of the 3 mandibles were compared. Although the deformations based on the orthotropic material properties appeared to be slightly exaggerated relative to those based on the isotropic material properties, the deformation patterns were very similar to each other overall (data not shown). The 3 models demonstrated different functional deformation characteristics. In the frontal view, the gonion was everted (x-axis direction) in model A; in the lateral view, the gonial angle was prominently extended (as in the straightening of an elbow) in model C. Anterior displacement of the dental arch from the occlusal view was greatest in model C and lowest in model A. In all 3 models, the coronoid process was elongated posterior-superiorly and inverted. The gonion was displaced anterosuperiorly (Figure 7).
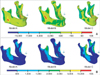
In all models, the compressive strain response was higher at each side of the posterior ramus (about 4,000 µE, cyan color) than in other regions, and this feature was especially noticeable in model C. The tensile strain (approximately 2,000 - 3,000 µE, lime color) was bilaterally concentrated on the coronoid process and anterior ramus, and this feature was also most prominent in model C (Figure 8).
Peri-orthodontic mini-implant compressive strain (POMI-CSTN)
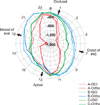
POMI-CSTN was analyzed using the polar line chart and found to be highly concentrated at the distal aspect of #45 and the mesial aspect of #46. The POMI-CSTN values were similar irrespective of the isotropic or orthotropic material properties in models B and C. In model A, the maximum POMI-CSTN (1,401.75 µE) was observed at the #18 node (Figure 9). Under a traction force of 200 g, the maximum POMI-CSTN values of models A, B, and C were 1,674, 1,898, and 1,506 µE, respectively. The maximum POMI-CSTN under a traction force of 150 g in model A (1,415 µE) was similar to that under clenching (Figure 10).
DISCUSSION
In orthodontics, the mandible has been thought of as a changeable structure through growth and development or as a limiting structure for orthodontic tooth movement, rather than as a deformable structure during the power stroke of mastication. The resistance of the mandible to bending or torsional movements under an external load is influenced by the mechanical implications of its size, shape, and cross-section.13
Korioth and Hannam7 reported that actual mandibular deflections ranged from 0.46 to 1.06 mm depending on the clenching task. During clenching in the intercuspal position, the inferior border of the mandible was shown to deform in an outward direction, and this deformation was more pronounced posteriorly than anteriorly mainly due to the strong activity of the masseter muscle. They also noted the eversion of the gonion and inferior distortion of the anterior teeth, to which the results of model A correspond (Figure 10). Gonion eversion tended to be smaller for the high mandibular plane angle than for the low angle in the frontal view.
O'Mahony et al.14 reported that bone implant interface stresses and peri-implant principal strains in the cortical crest were increased by 20 - 30% in the anisotropic (transversely isotropic) model compared to the isotropic model. In this study, despite using anatomically correct FE models and delicate material property axes, we found little difference in macroscopic mandibular deformation during clenching, which demonstrated little relationship to the equality or direction of the elastic constant. However, a comparison of the microscopic deformations around the OMI in the orthotropic case resulted in a higher POMI-CSTN in model A (Figure 9). Thus, from an OMI stability standpoint, the use of orthotropic material properties in an analysis may be considered to have more significance.
Many studies have reported a correlation between the thickness and density of the cortical bone and facial skeletal patterns. The cortical bone of short-faced subjects (low gonial angle) is thicker than that of long-faced subjects.15,16 In particular, the buccal cortical bone thickness between the lower first molar and the second molar is thicker in short-faced adults. The buccal and basal cortical bone thickness is negatively correlated with the mandibular plane angle and gonial angle.16,17 Large mandibular plane angles are a risk factor for OMI failure because the buccal cortical bone is thinner in high-angle cases (1.5 - 2.7 mm) than in low-angle cases (2.3 - 3.7 mm).4 The success rate for OMIs in the posterior buccal region tends to decrease for high mandibular angles.18
In this study, model C displayed the largest deformations in the gonial area (described as upward and forward displacement of the gonion) among the 3 models (Figure 7); however, the overall distribution and intensity of buccal alveolar bone strain around the posterior teeth was higher in model B (Figure 8). The thickness of the cortical bone at the OMI insertion site was 2.6 mm, 1.77 mm, and 1.33 mm for models B (average angle), C (high angle), and A (low angle), respectively. Thus, our results do not support the hypothesis that OMI stability in high-angle subjects may be decreased due to the greater degree of mandibular deformation.
Other factors may contribute to the distinct conclusions of the present study from previous clinical studies. The simplified subject selection criteria according to FMA may not be sufficient to define facial morphology. The low cortical bone thickness around the OMI in model A, although it also demonstrated low FMA, may alternatively be explained in terms of variations in the intra-mandibular cortical bone thickness.
Proffit et al.19 reported considerable differences in the average maximum bite force (MBF) of normal-face adult subjects (31.0 kg) and long-face subjects (11.2 kg) at 2.5-mm molar separation. Braun et al.20 found that MBF increased with decreasing mandibular plane/palatal plane angle, decreasing mandibular plane angle, and increasing ratio of the posterior facial height to anterior facial height. van Spronsen21 reported that the jaw-closing muscles of long-faced adults were up to 33% smaller than those in normal subjects, whereas variations in spatial orientation and mechanical advantage were less pronounced. To our knowledge, no report has described the magnitude of each closing muscle force applied during jaw closing as a function of the facial morphology. More reliable criteria for facial type selection and the use of a larger cohort of subjects with individualized muscle force data may be needed in future studies.
Loading conditions determine the mandibular bone structure as well as the modeling and remodeling of the mandible. Certain dentofacial structural changes such as orthodontic or prosthodontic treatment and jaw surgery can alter the functional deformation of the mandible, which may affect the internal structure of the mandibular bone.22 Mechanical fatigue damage (microdamage) in bone normally occurs in vivo, and the bone usually repairs damage below 2,000 µE through remodeling. However, overloading (at strains beyond 4,000 µE) can overwhelm the repair mechanisms, and damage accumulation can cause fatigue fractures.23 Frost24 suggested that doubling the size of the strain (from 2,000 to 4,000 µE) can increase microdamage by a factor of several hundred and cause dental and orthopedic bone implant loosening. The upper limits of tolerable cortical bone strain under normal conditions are 1,500 µE in tension and 2,500 µE in compression. Compressive strains of 2,500 - 4,000 µE are thought to be intolerably high.14
In this study, POMI-CSTN under clenching fell within the range of the adaptive window, indicating that the bone would properly adapt to the loading. However, when orthodontic traction force of 150 g was applied to the OMI in model A, the estimated total strain was 2,816 µE (Figure 10). In light of previous numerical studies of cortical bone strain applied during OMI insertion, more than 4,000 µE of POMI-CSTN may develop immediately after OMI insertion.25 If microdamage to the cortical bone is induced during OMI insertion and not replaced by newly formed bone, then repetitive occlusal and additional orthodontic loading to the OMI may increase POMI-CSTN up to 6,000 - 7,000 µE, which can compromise OMI stability.26 Thus, in addition to many suggested causes of OMI failure, consideration of the effect of functional mandibular deformation due to the physiologic occlusal function of the host may be helpful in increasing OMI success rates. The relationship between mandibular deformation and OMI stability under various clenching tasks requires further investigation.
CONCLUSION
An FE analysis of the mandibular deformations during clenching revealed different characteristics in 3 FMA-based facial types, and the secondary compressive strains arising from functional mandibular deformation on the cortical bone around the OMI were distributed mesiodistally rather than occlusogingivally. As the POMI-CSTN observed in the model A (low FMA) was relatively higher than those of models B and C and failed to exceed the normally allowed compressive cortical bone strain, the results of our study do not support the hypothesis that high mandibular angles reduce the stability of OMIs. However, microdamage to the cortical bone during OMI insertion, application of additional heavy orthodontic traction force to the OMI, or increased mandibular deformation during vigorous clenching may increase POMI-CSTN to compromise OMI stability.


 XML Download