

 PDF
PDF ePub
ePub Citation
 Print
Print


INTRODUCTION
Recently, temporary anchorage devices (TADs) were developed to achieve maximum anchorage using a simple method. Unlike general implants, TADs can be loaded immediately and have the advantages of low cost, short chair time and small size. The small size allows them to be placed in inter-dental spaces. Therefore, TADs are used widely in orthodontic treatment.
When placing an TAD, site selection is important. Important factors that affect site selection are stability and safety.1,2 Stable implants are retained and do not loosen when an orthodontic force is applied. The safety of a site refers to the ability of a clinician to place an implant at that site without damage to the root or other important anatomical structures.
Many studies have reported that the stability of TADs is affected by the initial site stability. Implant stability depends on the condition of the cortical bone and operator's technique.3-6 Therefore, it is important to know the cortical bone thickness, which is critical for the initial stability of an TAD.
In the mandible, the space between the 2nd premolar and 1st molar is the preferred site for anterior tooth retraction, and the space between the canine and 1st premolar or between the 1st premolar and 2nd premolar is often used for the mesial movement of molars. In addition, the mandibular buccal and lingual molar areas can be used for an TAD to intrude the molars. The mandibular molar area is often preferred for placement of TADs, along with the maxillary midpalatal suture,7,8 palatal, and maxillary buccal areas.9 Therefore, determination of the cortical bone thickness of the mandibular molar region will be helpful for the selection of TAD placement sites.
In this study, we evaluated the suitability of the mandibular molar area for TAD placement site by comparing the buccal and lingual cortical bone thicknesses using computed tomography (CT) images.
Go to : 
MATERIALS AND METHODS
We examined CT images of 30 adults (15 men with a mean age of 26.13 years and 15 women with a mean age of 26.67 years; Table 1). Images were selected from a larger sample of adults who received CT scans prior to extraction of the lower third molars at the Department of Oral and Maxillofacial Surgery, Yonsei University, Seoul, South Korea. The inclusion criteria were as follows: completion of growth, no severe crowding, no periodontal disease, no missing teeth, and no intrabony lesions in the mandible.
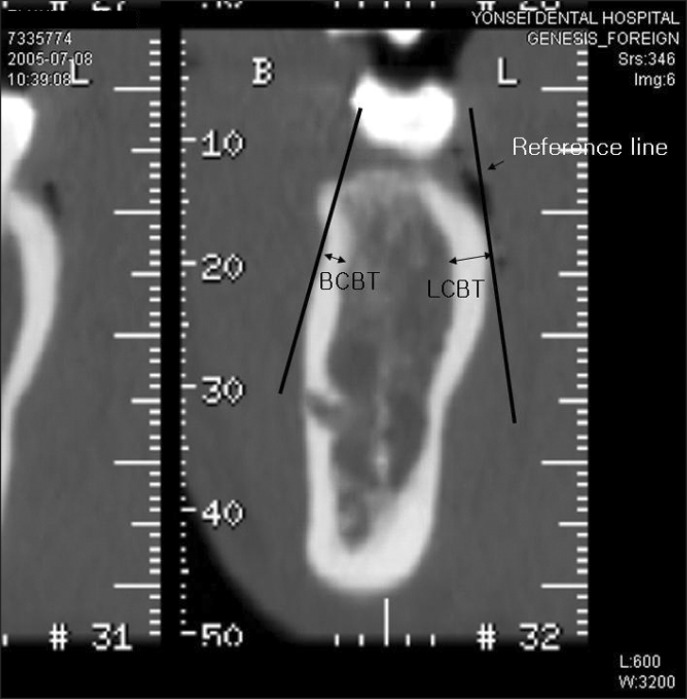
Images were taken using a CT Hispeed advantage (GE Medical System, Milwaukee, WI, USA) using a high-resolution bone algorithm at the following settings; 9.6 cm Display Field of View (DFOV), 200 mA, 120 kV, 1 second scanning time, and 1-mm slice thickness. When taking the CT images, the occlusal plane of each subject was perpendicular to the floor and each subject bit a tongue blade placed in the premolar region. The scanning range was from the mandibular occlusal plane to the mandibular border. The images were saved in the Picture Archiving Communication System (PACS) at Yonsei University Dental Hospital and the interdental bone thicknesses 4 mm apical to the cementoenamel junction (CEJ) between the canine and 1st premolar, 1st premolar and 2nd premolar, 2nd premolar and 1st molar, and 1st molar and 2nd molar on both sides of the mandible, were measured on the transaxial slices of CT images using the PiView STAR (INFINITT, Seoul, Korea) program (Figure 1).
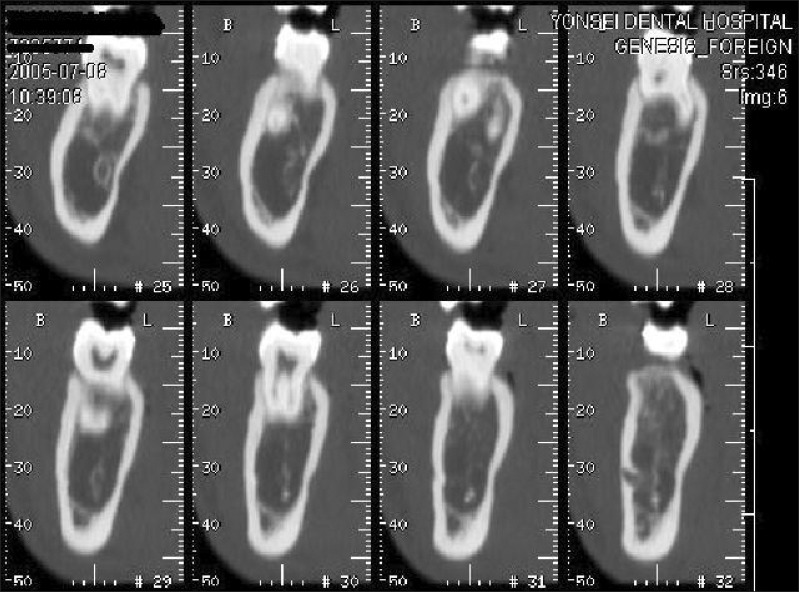
The transaxial images of the teeth were divided into 1-mm slices. The most distal transaxial image of the tooth that displayed the largest amount of the pulp chamber most clearly was measured. This image was chosen because it revealed the CEJ clearly.
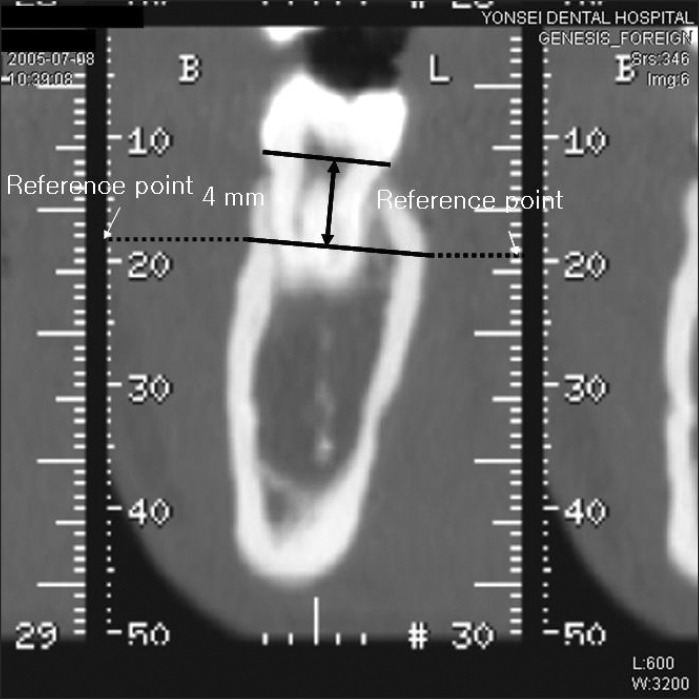
In this image, a line was drawn on the image that was parallel to and 4 mm below the CEJ. Two points were placed on this line that corresponded to where the tooth met with the buccal and lingual cortical bone. A horizontal line was drawn from each of these points to the right and left ruler on the computer screen, and the ruler measurements were marked as reference points (Figure 2). The reference points were then moved to the selected interdental transaxial image, based on the axial CT image, and a horizontal line was drawn from these reference points to the two points that corresponded to where the tooth met with the buccal and lingual cortical bone. Two more reference lines were set tangential to these two points and the buccal and lingual surfaces (Figure 3).
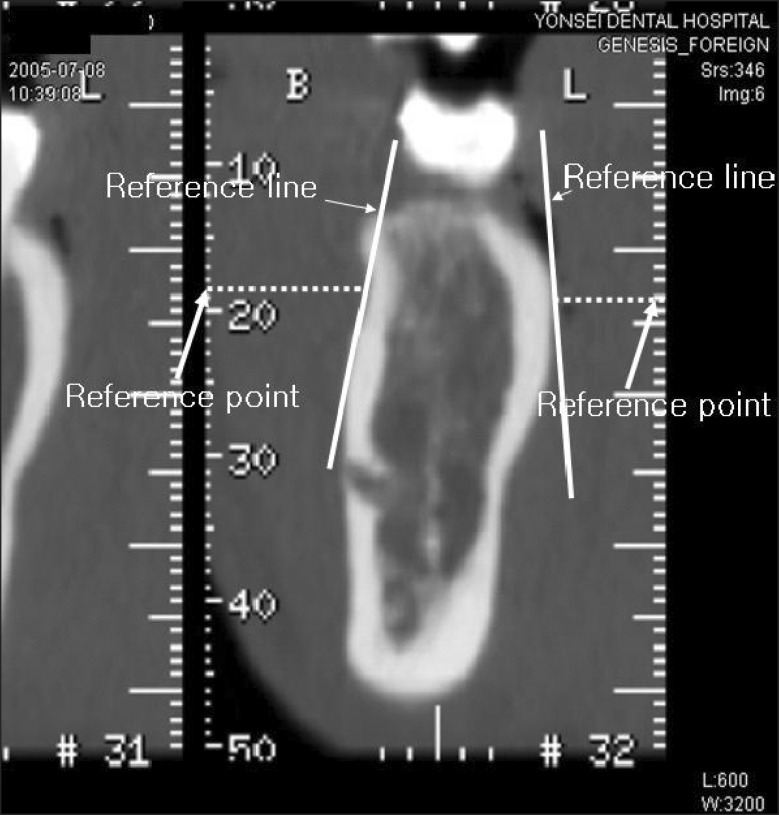
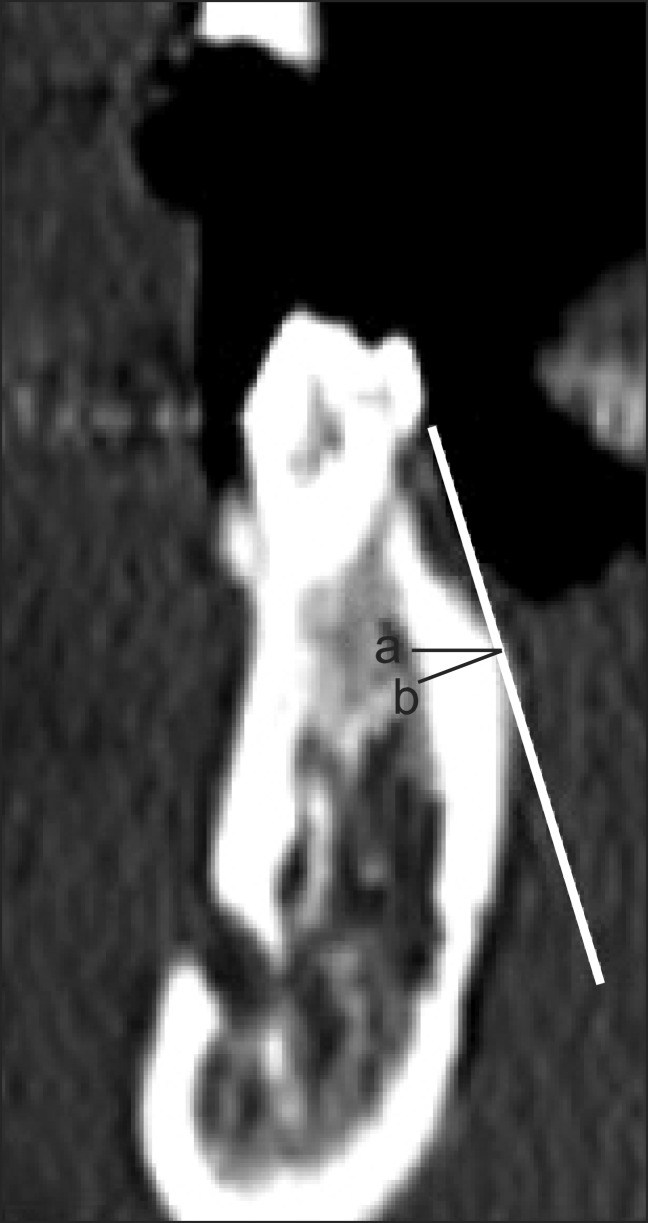
Buccal cortical bone thickness (BCBT) and lingual cortical bone thickness (LCBT) were measured on the line perpendicular to the reference line using PiView STAR (INFINITT) in mm (Figure 4).
Statistical analysis
We calculated the means and standard deviations of the buccal and lingual cortical bone thicknesses. Shapiro-Wilk's test revealed a normal distribution of the data. We used independent t-tests to compare the cortical bone thickness of men and women and between the buccal and lingual sides. A one-way repeated-measures ANOVA test was used to compare the buccal and lingual cortical bone thicknesses of the interdental areas between the canine and 2nd molar in men and women. All statistical analyses were carried out by the SPSS software program (version 19.0; SPSS Inc., Chicago, IL, USA).
Go to :
RESULTS
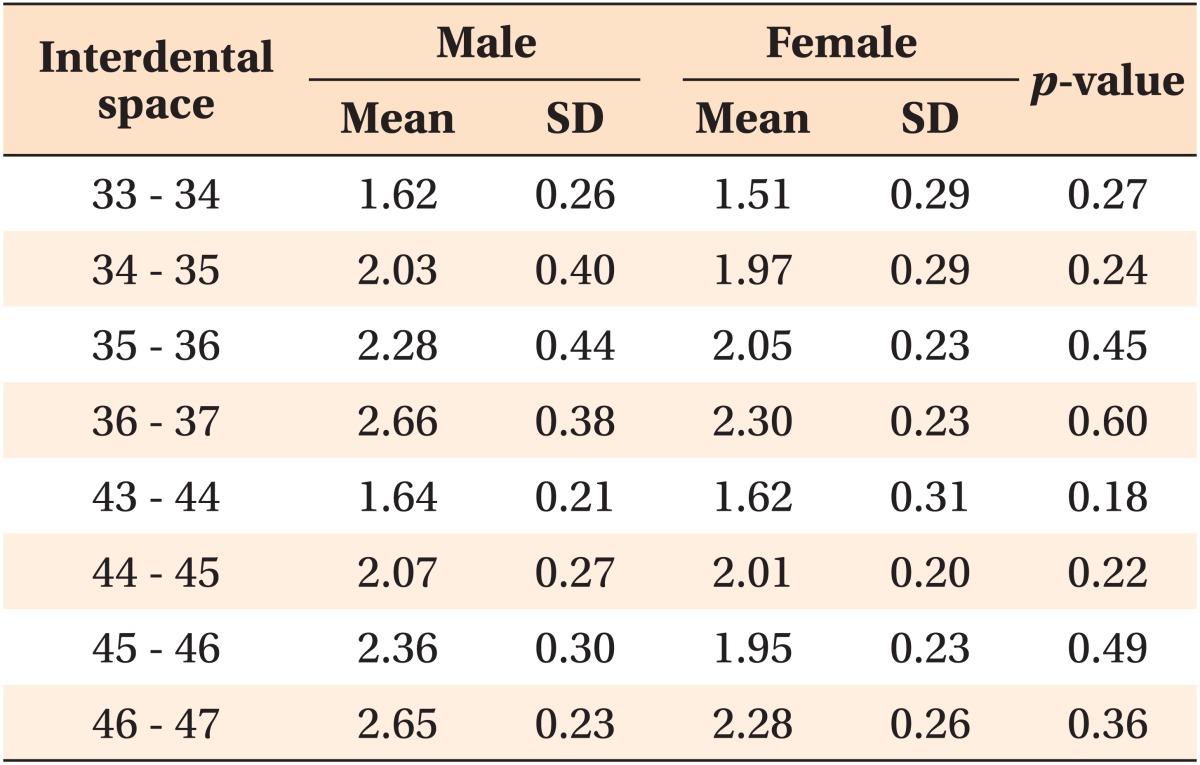
Buccal cortical bone thickness
The buccal cortical bone was thicker in men than in women, but the difference was not statistically significant (Table 2).
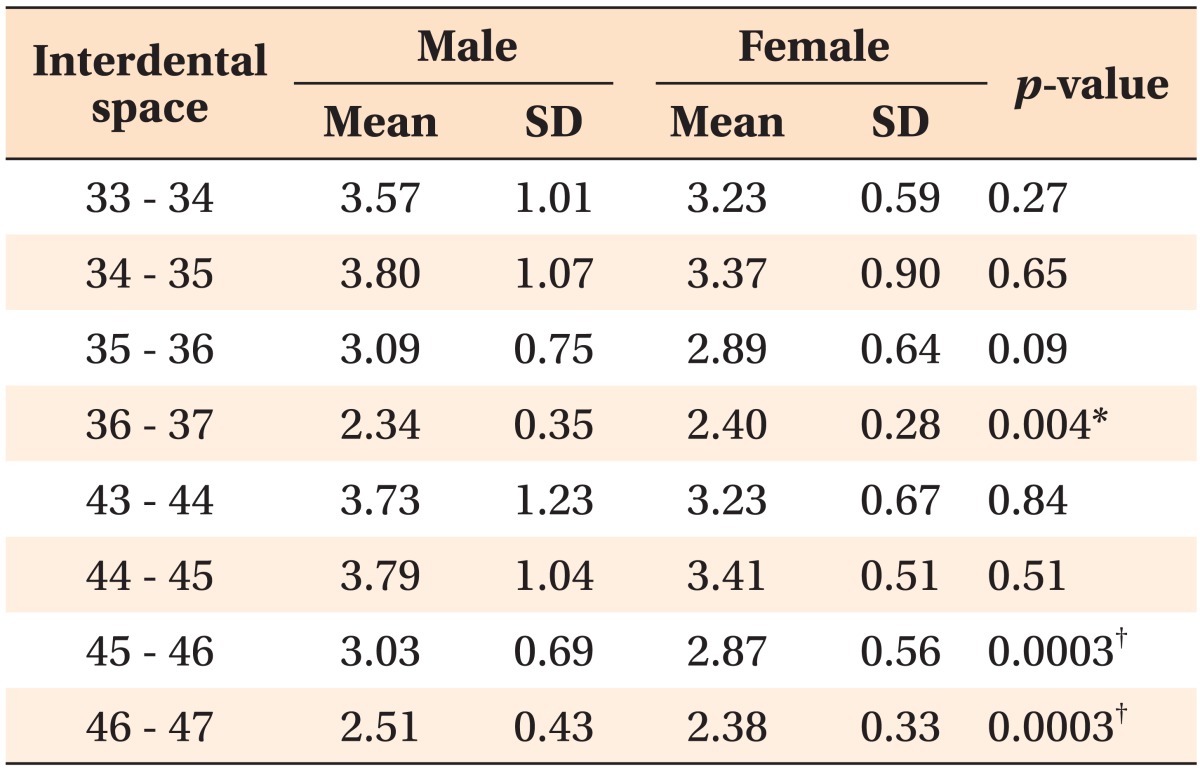
Lingual cortical bone thickness
The lingual cortical bone was thicker in men than in women, except between the left 1st and 2nd molars (Table 3).
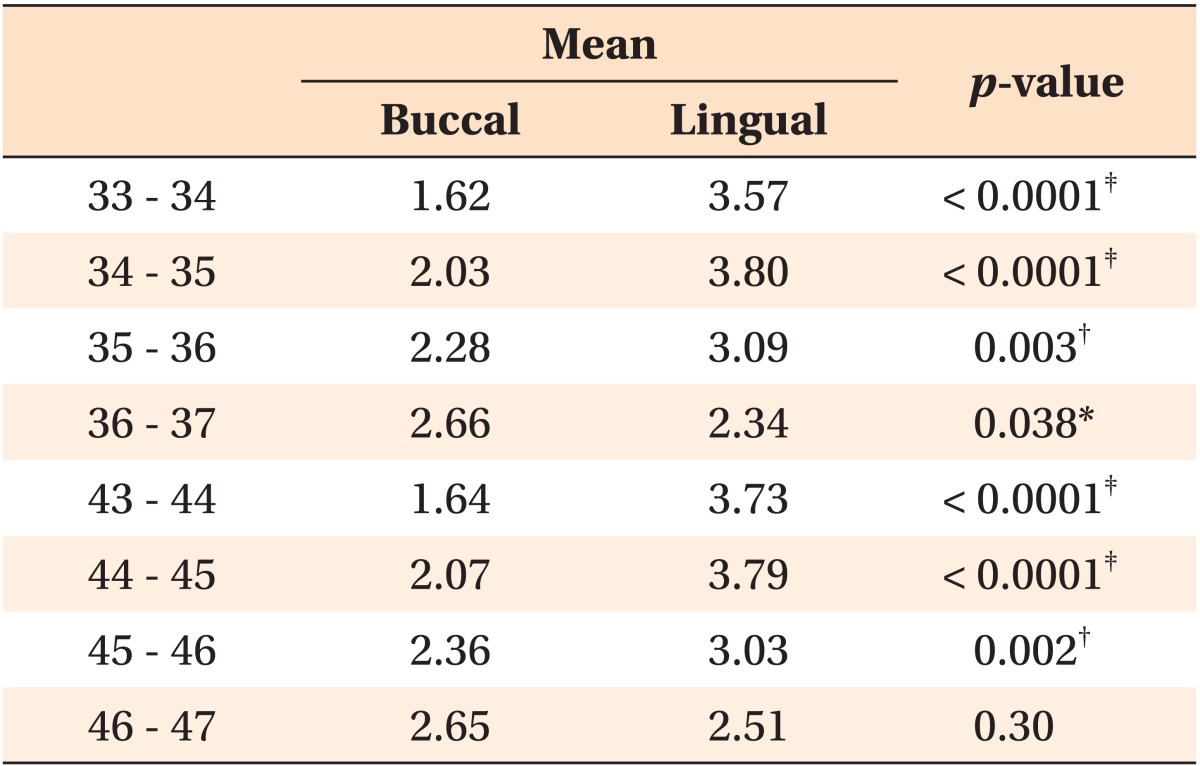
Comparison of buccal and lingual cortical bone thickness
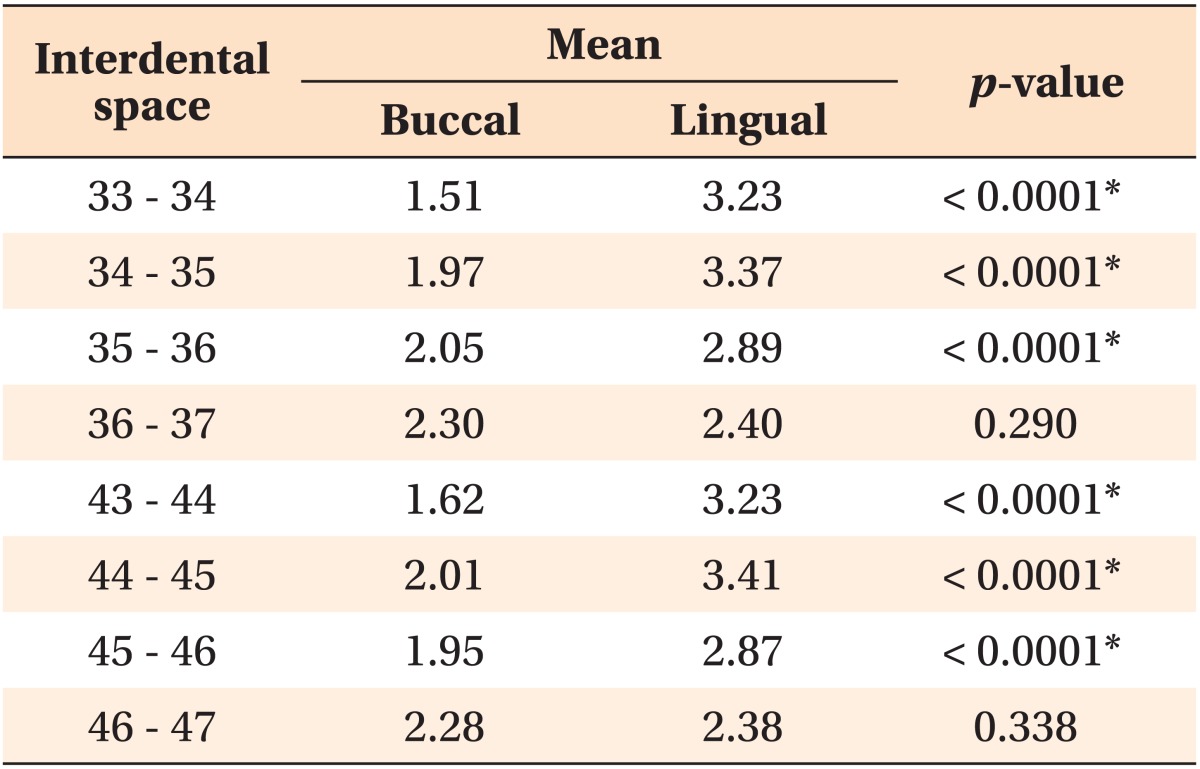
In men, the buccal cortical bone in the molar region was thicker than the lingual cortical bone, but this measurement was not statistically significant on the right side (Table 4). In women, the lingual cortical bone was thicker than the buccal cortical bone in all regions. This difference was statistically significant for all regions, except between the 1st and 2nd molars (Table 5).
Comparison of interdental cortical bone thickness
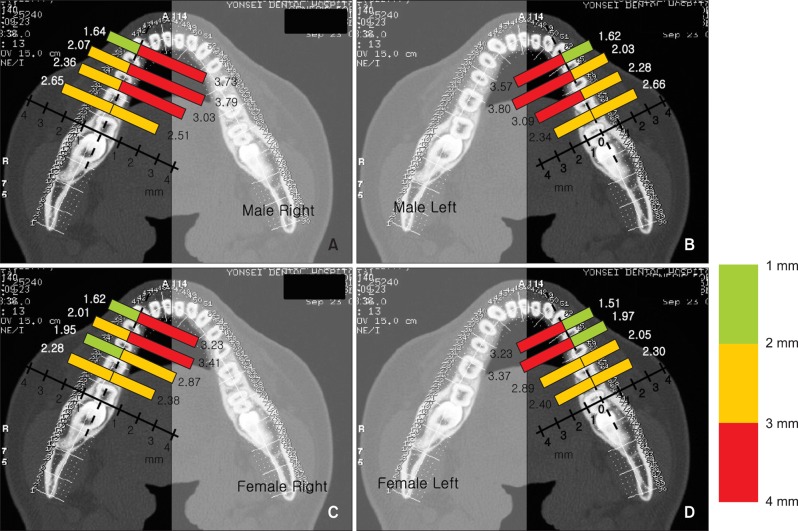
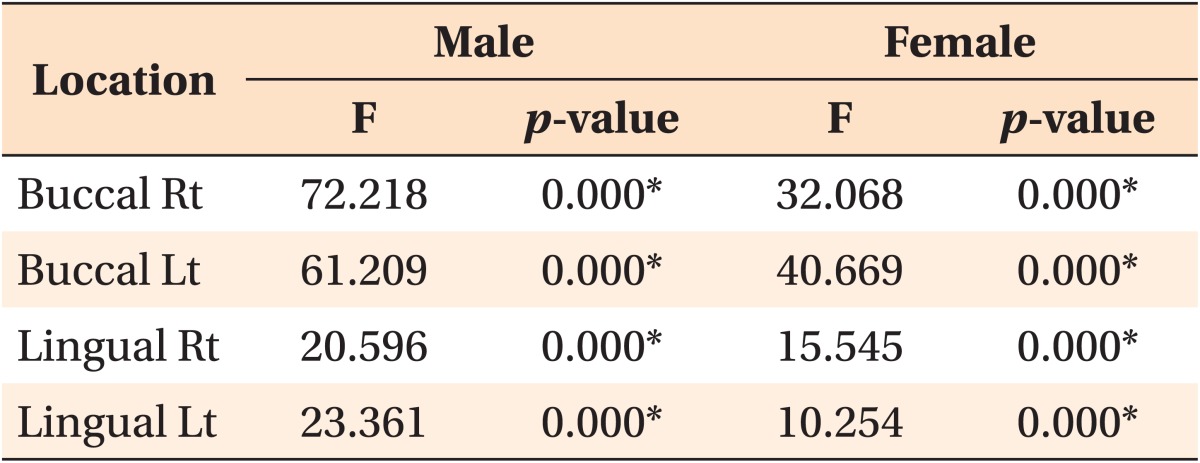
Mandibular lingual cortical bone thickness was the thickest between the 1st and 2nd premolar region and the thickness gradually decreased posterior to this region. On the other hand, the mandibular buccal cortical bone thickness increased between the anterior and posterior regions (Tables 4 and 5, Figure 5). One-way repeated-measures ANOVA tests indicated significant differences in cortical bone thickness between interdental regions (p < 0.01, Table 6).
Go to :
DISCUSSION
We used CT images to measure cortical bone thickness. In general, measurements using a dry skull make it difficult to ascertain the precise age of the skull. Even if the age of the donor is known, most samples show advanced bone resorption. Unlike general radiography, CT images can be used to provide accurate measurements of bone thickness without any expansion, transformation, or superimposition of anatomical structures.10-12 In addition, measurements from CT images are almost identical to those using dry skull specimens.10 Masumoto et al.13 reported that CT images were accurate and could be used to measure tooth angulation and cortical bone thickness with a margin of error less than 0.13° and 0.1 mm, respectively.
In previous studies, Kim et al.14 and Park15 used the axial plane as a reference plane in CT images. In this study, however, we used the transaxial plane as a reference plane in order to minimize errors due to the anatomical form of the mandible. Use of the axial plane as a reference plane results in an overestimation of thickness due to the mandibular buccolingual inclination (Figure 6). Park15 reported that the mandibular buccal cortical bone thickness of the 2nd premolar, 1st molar, and 2nd molar areas to be 1.71 ± 0.05 mm, 2.48 ± 0.71 mm, and 3.17 ± 0.93 mm, respectively. These measurements are larger than those in the present study. Therefore, the transaxial plane must be used as a reference plane for precise measurements.
TADs should be placed in an area with attached gingiva to increase their stability. Kim16 reported that healthy keratinized attached gingiva was located 3.5 - 5.3 mm below the gingival margin in the buccal area. Voigt et al.17 and Linde et al.18 reported that the lingual attached gingiva was located 1 - 9 mm below the gingival margin, but was 2 - 6 mm below the gingival margin in the premolar and molar area. On the basis of these studies, we estimated the location of the stable vertical position of TADs to be 4 mm below the CEJ in the buccal and lingual areas.
Cortical bone on both the buccal and lingual sides was thicker in men than in women. In this study, the buccal cortical bone thickness increased gradually from the anterior to posterior regions. This is in contrast to the lingual cortical bone thickness, which decreased gradually from the anterior to posterior regions. Similarly, Kim19 and Silvestrini Biavati20 found that the buccal cortical bone thickness increased from the anterior areas to the ramus and the lingual cortical bone was thicker in the anterior areas than posterior areas. On the other hand, we found that in both men and women, the lingual cortical bone was thickest between the 1st premolar and 2nd premolar, followed by the area between the canine and 1st premolar, the area between the 2nd premolar and 1st molar, and the area between the 1st molar and 2nd molar. Our measurements were smaller than those reported by Kim19 for the buccal area, and larger than those Kim reported for the lingual area. We attribute this difference to the difference in measurement methods. Kim19 measured the thickest and thinnest areas of cortical bone for each region, and calculated the average. However, we measured cortical bone thickness at the same distance from the CEJ in each region. In general, the cortical bone between the 1st premolar and 2nd premolar area is thickest in the lingual area because the lingual torus can be located 4 mm below the CEJ, although there are some individual differences. In some samples, the cortical bone thickness was > 6 mm in this area.
The buccal cortical bone thickness increased gradually from the anterior to posterior regions, but the lingual cortical bone thickness decreased from the anterior to posterior regions. This was related to buccolingual molar inclination. The mandibular molars are inclined lingually due to masticatory muscle activity and function.13,21 The buccolingual inclination of the mandibular molars is related to the force direction of the muscles acting on the molars. The axis of all molars is parallel to the direction of the pull of the medial pterygoid muscles. When the axis of mandibular molars and the direction of a muscle contraction coincide, mandibular molars can effectively resist masticatory forces, forming the curve of Wilson.
The lingual inclination of the mandibular molars helps the tongue and buccinator muscles to easily place food on the occlusal table, thus improving masticatory function. Ichim et al.22 and Hirabayashi23 reported that at the occlusal terminal phase, the load is directed buccally on the posterior teeth in the mandible. Because mandibular molars are inclined lingually, the mandibular molar buccal and lingual structures, particularly the cortical bone thickness, are affected by masticatory functions.13,21 When chewing and swallowing, the area around the mandibular posterior teeth also receives buccal loads from actions of the tongue. Therefore, the area surrounding the mandibular posterior teeth are supported by strong structures, such as the thick buccal cortical bone. This is especially true in the area of the 2nd molar where the masticatory muscle attachment is located. The buccal cortical bone in the 2nd molar area is thickest. In contrast, there is less need for strong support on the lingual side, so the lingual cortical bone appears to be thinner in the 2nd molar area. The forces acting on the mandibular cortical bone can also explain gender differences in cortical bone thickness in the area of the 2nd molar. The buccal cortical bone is thicker than the lingual cortical bone at the 2nd molar in men because men have a stronger masticatory forces than women. On the other hand, although buccal cortical bone thickness increases gradually posteriorly in women, it is thinner than the lingual cortical bone thickness at the 2nd molar because the masticatory forces of women tend to be weaker than that of men.
The gradual increase in the thickness of the buccal cortical bone from the anterior regions to the posterior regions implies that the stability of TADs would be greater if implanted in the molar region than in the premolar region. However, because the lingual cortical bone is thicker in the premolar regions than the molar regions, TADs implanted in the premolar region on the lingual side would be more stable than those implanted in the lingual molar region. This is because TADs are more stable when inserted into sites with thicker cortical bone.24,25 Although the lingual molar area has lower stability than the buccal molar area, the thinnest lingual cortical bone in this area was > 2 mm. This measurement was not significantly different from that of the buccal side. Therefore, the lingual cortical bone is as stable as the buccal cortical bone for TAD implantation.
Go to :
CONCLUSION
There was more than 2 mm of cortical bone in all areas, except between the canine and 1st premolar on the buccal side of the mandible. The cortical bone on both mandibular buccal and lingual sides is thick enough for TAD applications. This provides that mandibular buccal and lingual areas are proper site for stable placement of TADs.
Go to :
 XML Download