

 PDF
PDF ePub
ePub Citation
 Print
Print


INTRODUCTION
Aminotransferase, bilirubin, and alkaline phosphatase are the common indicators used for assessing the state (or condition) of the liver. In particular, increased serum levels of alanine aminotransferase (ALT) and aspartate aminotransferase (AST) indicate acute hepatocellular injury, such as viral infection, toxic injury, hypoxia, and hypoperfusion, where ALT and AST levels can rise by thousands of times the levels in the normal range. While ALT is relatively liver specific, AST levels can increase because of damage to other organs [1]. In addition, there are cases where non-hepatic respiratory or gastrointestinal viral infections lead to increased levels of ALT and AST without hepatic failure, and such conditions are referred to as nonspecific reactive hepatitis [23].
Acute lower respiratory tract infection, a common cause of nonspecific reactive hepatitis, is an important disease that accounts for about 30% of all diseases for which pediatric patients are hospitalized, and more than 60% of the infections are caused by a virus [456]. The recent introduction of multiplex real-time polymerase chain reaction (RT-PCR)-based diagnosis of viruses has improved the detection of causative viruses, and has been conducive to vigorous research in identifying varying clinical presentations in accordance with the types of respiratory virus [7].
In this context, the authors of this study sought to examine the relationship between the clinical manifestations of nonspecific reactive hepatitis and respiratory virus infection in pediatric patients.
MATERIALS AND METHODS
Patients
Patients who were admitted to the pediatric unit of Konyang University Hospital for lower respiratory tract disease and those who underwent an RT-PCR test between January 1, 2014 and December 31, 2014 were enrolled in the study. Patients who had a past history of hepatobiliary disease, and obese patients were excluded from the study [8]. Obesity was defined as a body mass index exceeding 95 percentiles at a minimum age of 2 years, and obesity was not defined for patients aged under 2 years [9]. Patients who tested negative for respiratory virus on RT-PCR and those with two or more viruses detected on RT-PCR were excluded. Patients were hospitalized until their respiratory symptoms and fever improved.
Methods
On the first day of admission, samples were obtained from throat or nasal swabs and immediately sent to the laboratory for RT-PCR. The nucleic acids were extracted using Ribospin™ vRD (GeneAll Biotechnology Co., Seoul, Korea), according to the manufacturer's instructions. The cDNAs were synthesized from the extracted RNAs with the cDNA Synthesis Premix (Seegene Inc., Seoul, Korea). All samples were tested using the Anyplex II RV16 (Seegene Inc.) kit. The respiratory virus detection reaction was divided into two panels, A (adenovirus, influenza A virus, influenza B virus, parainfluenza virus 1, parainfluenza virus 2, parainfluenza virus 3, parainfluenza virus 4, rhinovirus A/B/C) and B (respiratory syncytial virus A, respiratory syncytial virus B, bocavirus 1/2/3/4, metapneumovirus, coronavirus 229E, coronavirus NL63, coronavirus OC43, enterovirus). RT-PCR was run on CFX96 (Bio-Rad, Hercules, CA, USA) RT-PCR instrument, where viral respiratory pathogens were identified by a specific melting temperature of the amplicon labeled with one out of four fluorophores.
Blood tests were also conducted on the first day of admission. The normal ranges for ALT and AST varied with patient sex and age, and were defined as follows: for ALT, less than 40 IU/L for boys younger than 1 month, 32 IU/L for girls younger than 1 month, and 45 IU/L for both boys and girls older than 1 month; for AST, less than 71 IU/L for infants under 1 month, less than 63 IU/L for infants aged between 1 and 12 months, less than 60 IU/L for children aged between 1 and 3 years, less than 50 IU/L for children aged between 3 and 9 years, and less than 40 IU/L for children older than 9 years [1]. To compare the degree of increase in ALT and AST levels, we calculated the proportion of increase above the normal increase rates and defined this as the rates of increase in ALT and AST levels.
The patients were divided into those with increased levels of ALT or AST and those with normal levels, to compare the two groups in terms of sex, age, length of hospital stay, white blood cell count, leukocyte differential count, hemoglobin, hematocrit, platelet, ALT, AST, protein, albumin, alkaline phosphatase, bilirubin, lactate dehydrogenase, and C-reactive protein levels. Further, patients with increased ALT and AST levels were individually compared with those in the normal group, and blood test results were compared in accordance with the type of respiratory virus.
Statistical analyses were performed using PASW Statistics ver. 18.0 (IBM Co., Armonk, NY, USA). Continuous variables were analyzed using the unpaired 2-tailed t-test or analysis of variance, and categorical data were analyzed by using the chi-square test or Fisher exact test. A p-value less than 0.05 was considered statistically significant in all tests.
RESULTS
Epidemiological characteristics
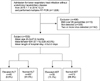
Among all subjects, 339 patients who tested negative for respiratory virus on RT-PCR and 142 patients with two or more viruses detected on RT-PCR were excluded. A total of 532 patients were included in the study (304 boys [57.1%] and 228 girls [42.9%]). The mean age of the patients was 25.0±27.6 months and the mean length of hospital stay was 4.5±3.0 days. ALT levels exceeded the normal range in 45 of the 532 patients (8.5%), and AST level exceeded the normal range in 59 patients (11.1%) (Fig. 1).
Comparison between patients in the increased ALT or AST group and those in the normal group
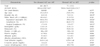
In total, 71 patients (13.3%) had increased ALT or AST levels. The male to female ratio in the increased ALT or AST groups (44:27) and the mean patient age (23.8±39.1 months) were not significantly different from those in the normal group (260:201 and 25.2±25.5 months, respectively) (p=0.377 and 0.768, respectively). The mean length of hospital stay of patients in the increased ALT or AST group was about 1 day longer than that of patients in the normal group (5.3±3.1 days vs. 4.4±3.0 days, p=0.019). The blood test results showed that there were significant differences between the two groups in the proportion of segmented neutrophils, atypical lymphocytes, albumin levels, and alkaline phosphatase; however, most of them were within the normal range. Patients in the increased ALT or AST group showed greater increases in their lactate dehydrogenase levels (613±133 IU/L vs. 853±752 IU/L, p=0.009) (Table 1).
Comparison between patients in the increased ALT and AST group, and those in the normal group
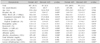
There were 45 patients (8.5%) in the increased ALT group, with a male to female ratio of 28:17, mean age of 16.0±35.8 months, and mean length of hospital stay of 5.8±3.7 days. Compared with the normal group, patients in the increased ALT group were significantly younger and their mean hospital stay was longer (p=0.022 and 0.003, respectively). The mean ALT level was 136.9±131.2 IU/L, and the rate of increase of ALT level was 3.1±2.9. There were significant differences in the proportion of segmented neutrophils, proportion of lymphocytes, platelet count, protein, albumin, and alkaline phosphatase levels between the groups, but the differences were within the normal ranges (Table 2).
There were 59 patients (11.1%) in the increased AST group, with a male to female ratio of 37:22, mean age of 24.8±36.7 months, and mean length of hospital stay of 5.2±3.3 days, which were not significantly different from the corresponding values in the normal group. The mean AST level was 128.3±143.3 IU/L and the rate of increase of AST level was 2.1±2.3. The lactate dehydrogenase level of these patients was 909±812 IU/L, which was increased by a significantly greater degree than the lactate dehydrogenase levels of patients in the normal group (p=0.007). There were significant differences in the proportion of atypical lymphocytes and albumin levels between the groups, but the differences were within the normal ranges (Table 2).
Comparing respiratory virus-specific differences between the groups
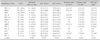
A total of 131 patients (24.6%) were infected by respiratory syncytial virus A, 128 patients (24.1%) were infected by rhinovirus, and 58 patients (10.9%) were infected by metapneumovirus. The incidences of increased ALT or AST levels were the highest in patients with adenovirus infections (6/24, 25.0%), followed by those with enterovirus (2/11, 18.2%) and respiratory syncytial virus A (21/131, 16.0%) infections. There were no significant differences among the different types of virus infections in the aminotransferase concentrations and in the mean increase rate of ALT/AST and the AST:ALT ratio (Table 3).
DISCUSSION
Nonspecific reactive hepatitis is defined as a secondary hepatic injury induced by a non-hepatic disease, without parenchymal liver damage. It is common for patients with a respiratory virus infection to lack clinical presentations while showing increased ALT or AST levels, which then drop to normal levels, with a good prognosis upon improvement of the infection. The exact mechanism is unknown, but Polakos et al. [10] reported that collateral damage seems to induce the condition, considering that apoptotic hepatocytes, antigen-specific CD8+ T cells, and Kupffer cells appear around the inflamed area, while the virus is not present in hepatocytes.
Other studies on nonspecific reactive hepatitis have reported that it occurs more frequently in younger age groups [11]. In the present study, there was no significant difference between the age of patients with increased levels of either ALT or AST and that of patients with normal levels for both. However, when patients in the increased ALT and AST groups were separately analyzed, the mean age of patients in the increased ALT level group (16.0±35.8 months) was significantly lower than that of patients in the normal group (25.8±26.6 months). On the contrary, there was no significant age difference between patients in the increased AST level group and those in the normal group. This indicates that younger patients with respiratory virus infection are more vulnerable to nonspecific reactive hepatitis, and the degree of influence on hepatic function is better reflected via ALT than AST levels.
Studies have suggested higher incidences of nonspecific reactive hepatitis in men than in women, but no sex-specific differences were found in the present study [11].
The rate of increase of ALT levels in the present study was 3.1±2.9, which indicates an ALT level three times higher than the normal range. Considering that the increase rate of AST level was 2.1±2.3, we presumed that ALT level increases by a greater degree than AST level during a respiratory virus infection, which is similar to the manifestations of acute hepatitis [11121314].
Lactate dehydrogenase level increased in both groups, but it increased significantly more in patients in the increased ALT or AST level group than in those in the normal group, which indicates a more severe overall tissue damage in patients in the increased ALT or AST level group.
Several studies have reported the frequency of nonspecific reactive hepatitis among patients with respiratory virus infection in Korea and abroad. Jeon et al. [11] reported that 19.4% of patients with viral infection of the lower respiratory tract showed hepatic dysfunction, with the frequency of liver damage being the highest in respiratory syncytial virus infection (50%), followed by influenza (35.8%), adenovirus (7.1%), and parainfluenza (7.1%) virus infections. Another study also reported that 49% of patients who underwent artificial ventilation for respiratory syncytial virus-induced bronchiolitis had nonspecific reactive hepatitis [12]. In the present study, 13.3% of all infant patients showed increased ALT or AST levels, which was lower than the incidences reported by other studies, presumably because we excluded patients infected by two or more viruses in order to clarify virus-specific features. In addition, the proportions of patients with increased ALT or AST levels were 33.7% for influenza, 30.9% for respiratory syncytial virus, and 24% for adenovirus, which were different from those reported by previous studies.
A previous study has reported that respiratory syncytial virus infection is associated with increased ALT and AST levels, but no differences in the levels were observed after respiratory syncytial virus infection in the present study [15].
Bilirubin level was significantly high in patients in the enterovirus infection group (2.7±5.0, p=0.002). Adenovirus, influenza virus, and enterovirus are known to induce hyperbilirubinemia along with hepatitis, but only patients in the enterovirus infection group showed increased levels of bilirubin in the present study [16]. Further, patients in the adenovirus infection group showed significantly high levels of C-reactive protein (4.8±4.9, p<0.001), which was in line with the findings of another study, where adenovirus infection showed more similarity with the clinical presentation of a bacterial infection than with infections caused by other types of viruses [17].
The AST:ALT ratio is used as an indicator to determine the cause of liver disease based on the fact that AST increases in greater degrees than ALT in liver diseases such as alcoholic liver disease. In the present study, there were no significant virus-specific differences in this ratio, which could be attributed to the small sample size of patients with increased ALT or AST levels [1314].
We believe that one of the merits of this study is our exhaustive investigation of all patients admitted to a single university hospital for lower respiratory tract infection, and that it more clearly observed virus-specific features by excluding cases of double infections.
One of the limitations of this study is that we could not survey the drug history of patients, which could influence the results of hepatic function tests, such as use of antipyretics and antibiotics at the time of admission; therefore, such patients were not excluded from the study. Further, we could not exclude the possibility of increased ALT or AST levels due to fever-induced muscle damage, as we could not examine the creatine phosphokinase levels of all patients. In addition, because we diagnosed respiratory virus only via RT-PCR testing, we could not exclude cases of past respiratory virus infection or false positives as well as patients with gastrointestinal infections [18].
In this study, we found that different types of viruses that infect the lower respiratory tract did not significantly affect ALT and AST levels. However, nonspecific reactive hepatitis was more common among patients with influenza, respiratory syncytial virus, and adenovirus infection as well as among patients who were infected at a younger age, and compared with the serum level of AST, serum level of ALT was a better indicator of the severity of nonspecific reactive hepatitis.
 XML Download