

 PDF
PDF ePub
ePub Citation
 Print
Print


INTRODUCTION
Crohn's disease (CD) is an idiopathic inflammatory disease of the intestines that is characterized by transmural inflammation. Enteric involvement is usually segmental and noncontiguous. The presence of skip lesions is characteristic of CD [1]. According to a recent study [2], approximately 25% patients develop this condition in childhood, with an increasing incidence in children and adolescents. Various radiologic imaging techniques, including small bowel follow-through, conventional enteroclysis, ultrasonography, computed tomography (CT), and magnetic resonance imaging (MRI), have been used to evaluate CD. With recent advances in technology, cross-sectional imaging techniques such as CT and MRI have come to be accepted as accurate diagnostic techniques, because they reliably identify extraluminal and extraintestinal pathological conditions in addition to the status of the bowel wall. Moreover, they have an advantage in the objective assessment of lesion extent because they can enable evaluation of the small bowel, which is the most frequently affected site (up to 80% of cases) of CD but less accessible with endoscopy [3]. CT enterography offers high spatial resolution with a short imaging time. However, exposure to ionizing radiation is a significant concern [45]. Moreover, because CD is a chronic process with relapse and remission, repeated imaging examinations may be required to assess disease activity, severity, and complications. To avoid the adverse effects of cumulative radiation exposure, particularly in children, MR enterography (MRE) was introduced as a radiation-free imaging technique for evaluating children with CD. The diagnostic performance of MRE has been shown to be comparable with that of CT enterography [67]. Furthermore, the former technique facilitates dynamic functional imaging [8910]. The aims of this article are to review the MRE technique and discuss interpretations for the spectrum of MRE findings in CD.
MAGNETIC RESONANCE ENTEROGRAPHY TECHNIQUE
Appropriate patient preparation, optimal bowel distension, fast scanning, and minimization of bowel peristalsis are important to obtain diagnostic and high-quality MRE images.
Patient preparation
Fasting for at least 6 h before MRE is recommended to improve the tolerance of patients toward the ingestion of a large amount of oral contrast agent. Furthermore, fasting decreases the intraluminal food residue that can be misinterpreted for a mass lesion. A low-residue diet for several days before examination is also recommended to facilitate the transit of the oral contrast agent by decreasing the amount of feces in the colon. No routine bowel preparation is required for MRE.
Optimal bowel distension is crucial for adequate imaging, because a collapsed bowel may hide early mural changes or can be misinterpreted as wall thickening and abnormal enhancement of the bowel wall. Currently, standard protocol for selection of the oral contrast agent, optimal volume of the oral contrast material, and timing of image acquisition to achieve adequate bowel distension has not yet been determined [111213141516].
Oral contrast agents used for MRE are classified as follows according to their signal intensities on the T1- and T2-weighted images [11]: positive (high signal intensity on both T1- and T2-weighted images), negative (low signal intensity on both T1- and T2-weighted images), and biphasic (low signal intensity on T1-weighted images and high signal intensity on T2-weighted images). Positive contrast agents are limited to the evaluation of subtle bowel wall enhancement. Negative contrast agents improve the conspicuity of the inflamed bowel and surrounding mesenteric pathology on T2-weighted images because of the high contrast achieved between the inflamed region, which exhibits high signal intensity, and the intraluminal region, which exhibits low signal intensity. However, associated susceptibility artifacts may influence the conspicuity of the bowel wall. Currently, the most frequently used contrast agents for MRE are biphasic agents, which provide good contrast between the bowel lumen and wall on both T2- and enhanced T1-weighted images and improve the detection of signal changes and enhancement of an inflamed bowel. Commercially available biphasic agents include polyethylene glycol, low-concentration barium sulfate (0.1% weight/volume) with sorbitol (VoLumen; E-Z-Em/Bracco, Lake Success, NY, USA), sorbitol alone, mannitol, locus bean gum and methylcellulose.
Optimal bowel distension is determined by the osmolarity, total volume, and uptake method of the oral contrast agent and the timing of image acquisition [131415161718]. Reported volumes vary from 1 L to 2 L depending on the contrast agent used. In general, a larger volume of contrast ingestion induces better bowel distension. However, the higher volume and osmolarity of the contrast agent may result in a higher rate of adverse effects such as diarrhea and abdominal cramps. The type of contrast agent and the optimal volume that does not cause adverse effects remain undetermined. For children, 600-1,000 mL volume depending on age [19] or 20 mL per kilogram of body weight (maximal dose, 1,350 mL) is generally considered optimal [192021222324]. Ingestion of the contrast material over regular intervals facilitates consistent bowel distension. Patients are encouraged to ingest two to four aliquots over 45 to 60 min. In some institutions, ingestion of another 200 mL of contrast material just before imaging or within the 10-15 min before imaging is recommended to achieve adequate distension of the duodenum and proximal jejunum [142325]. After complete ingestion of the contrast agent, a thick-slab T2-weighted single-shot image can be acquired to identify the progress of the material to the ileocecal junction.
Antiperistaltic agents improve the quality of MRE images by minimizing motion artifacts resulting from bowel peristalsis [26]. Two most commonly used antiperistaltic agents are glucagon and butylscopolamine (Buscopan; Boehringer Ingelheim, Ingelheim, Germany). There is no standard protocol regarding the type and volume, injection route, and timing of injection of antiperistaltic agents. Glucagon is more commonly used in children [2122232426] and can be administered via intravenous or intramuscular routes. Mollard et al. [21] proposed the use of intravenous glucagon on the basis of a weight-based protocol (body weight <25 kg=0.5 mg, body weight≥25 kg=1 mg). Glucagon can be administered as a single dose at the beginning of MRE [242527] or just prior to the acquisition of contrast-enhanced images [12128], depending on the order of sequences. It can also be administered in a split dose, half at the beginning of MRE to minimize intraluminal flow voids on T2-weighted single-shot image and half just before the acquisition of contrast-enhanced images, because post-contrast T1-weighted volumetric gradient-echo (GRE) sequences are susceptible to motion artifacts [222324272930]. Slow administration over 3-5 min with simultaneous injection of saline (approximately 50-70 mL) is proposed to minimize the side effects of glucagon. Similarly, 20 mg of butylscopolamine can be administered intravenously as a single dose or a split dose [30].
Magnetic resonance enterography protocol
Fast image acquisition while maintaining adequate bowel distension is crucial during MRE examination. Therefore, most recently recommended MRE protocols include a combination of fast, high-resolution pulse sequences. The basic sequences include the following: T2-weighted single-shot images; balanced steady-state free precession (balanced SSFP); and contrast-enhanced T1-weighted ultrafast spoiled GRE with fat suppression.
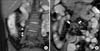
T2-weighted single-shot image provides an excellent depiction of anatomical landmarks and a relatively accurate depiction of bowel wall thickening, ulcers, perienteric fluid collection, and penetrating complications. Moreover, fat suppression improves the conspicuity of bowel wall edema. However, this sequence is susceptible to motion, which results in intraluminal fluid voids, and is also limited to assessment of the mesentery because of k-space filtering effects [31]. Balanced SSFP provides high tissue contrast and is relatively insensitive to motion [2527]. This sequence is better than the T2-weighted single-shot technique with regard to the evaluation of mesenteric vessels and lymph nodes (Fig. 1) [29]. However, balanced SSFP is vulnerable to susceptibility artifacts that can be produced by intraluminal air and black boundary artifacts that may interfere with the accurate assessment of bowel wall thickness. These two sequences enable complimentary interpretations of imaging findings when included together in an MRE protocol.
Pre- and postcontrast images are acquired using the T1-weighted ultrafast spoiled GRE sequence with fat suppression, which can be obtained in two- or three-dimensional (3D) planes. The 3D sequence provides higher spatial resolution and enables multiplanar reconstruction; however, it is more susceptible to motion. The two-dimensional (2D) sequence does not require patients to hold their breath and can be used for patients who experience difficulty with holding breath. Contrast-enhanced images allow better depiction of the lesion extent and severity compared with T2-weighted single-shot image [32]. Postcontrast images require at least two acquisitions, usually at 20-30 and 70 s, and delayed images are acquired in many institutions. However, the time intervals differ among institutions.
Recent studies have suggested that dynamic contrast-enhanced MRI (DCE-MRI) using semi-quantitative or quantitative methods allows the differentiation of active and inactive CD and enables the quantitative evaluation of inflammatory activity [103334]. Diffusion-weighted imaging (DWI) is useful for the detection of bowel segments with active inflammation as well as penetrating complications such as abscess, fistula, and sinus tract [35]. With the use of apparent diffusion coefficient (ADC) values, quantitative analysis of disease activity is also feasible [3637]. However, additional studies are required to determine the reliability of these values, because they can vary with the selected b-value or MR scanner. Further studies to validate the utility of DWI and DCE-MRI for the assessment of disease severity and treatment response are required.
INTERPRETATION OF IMAGING FINDINGS
The role of MRE in CD involves assessment of the lesion location and extent, disease activity and severity, complications such as penetrating diseases and strictures, and treatment response. Classification systems based on imaging have been proposed to allow the objective evaluation of the disease status and consequently aid in the formulation of appropriate treatment strategies. Maglinte et al. [38] classified CD into four subtypes: active inflammatory, fistulating and perforating, fibrostenotic, and reparative and regenerative. However, because CD is a chronic inflammatory process with a relapsing and remitting course, multiple stages ranging from active inflammation to fibrosis may coexist in a single bowel segment [394041]. The role of the radiologist is to determine significantly predominant imaging findings.
Active inflammatory subtype
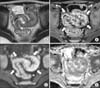
The bowel wall thickness, wall edema, and the pattern and degree of enhancement have been suggested as independent predictors of disease activity and severity [394243]. In general, a wall thickness of more than 3 mm is regarded as abnormal [30] (Fig. 2A). Bowel wall thickening is consistently correlated with the presence and activity of CD [39424344]. The wall thickness is significantly decreased during the transition from active disease to remission, although inactive pathologic segments remain thicker than normal bowel segments [44]. In the setting of a thickened bowel wall, the presence of wall edema on T2-weighted images and intense or layered enhancement on post-contrast images can be helpful for the assessment of disease activity. Submucosal edema and inflammation resulting from deep ulcers in CD patients appear as intramural hyperintensities on T2-weighted images (Fig. 2A and 3), active fibrosis generally exhibits low signal intensity within the bowel wall [12229]. A hyperenhanced bowel wall relative to the adjacent normal bowel loops indicates active inflammation [3942]. Intense and layered enhancement due to mucosal and serosal enhancement combined with submucosal edema is considered to reflect active inflammation (Fig. 2B) [143]. Intense homogenous patterns of enhancement can be also observed in regions of active transmural inflammation (Fig. 4) [39]. Although contrast enhancement is significantly decreased to a near-normal level after remission is achieved [44], mild and more homogenous postcontrast enhancement can remain in a less active or inactive phase [19]. Therefore, more objective parameters evaluating disease activity and severity may be needed as alternatives to subjective visual assessments of bowel wall enhancement. With the recent use of the DCE technique, it has become possible to evaluate serial enhancement and consequently calculate quantitative parameters for the assessment of bowel perfusion. Early and intense uptake of the contrast agent, which increases over time until a plateau is reached, is observed in regions of active inflammation [934], and, according to Oto et al. [1045], an inflamed bowel shows faster Ktrans values, larger Ve values, increased contrast uptake, larger initial areas under the contrast concentration curve, and steeper initial enhancement slopes compared with a normal bowel. Further studies validating the utility of this technique for the assessment of disease activity and severity and monitoring of treatment responses are required.
DWI measures the diffusivity of water in the extracellular space. In the active inflamed bowel segment, restricted diffusion of the bowel wall, which appears as high signal intensity on DWI with decreased ADC values, is observed (Fig. 2C and 2D). This is a result of narrowing of the extracellular space because of inflammatory cell infiltration [35363745]. Kiryu et al. [36] suggested that the accuracy of DWI was high with regard to the evaluation of disease activity by visual assessment (sensitivity, specificity, and accuracy for the detection of actively inflamed segments were 86.0%, 81.4%, and 82.4%, respectively), and that ADC values may facilitate the quantitative analysis of disease activity.
Associated extraluminal findings indicating active inflammation include mesenteric hyperemia, reactive mesenteric lymphadenopathy, and inflammation of mesenteric fat [394647]. The engorgement of mesenteric vascular structures, known as the comb sign, is depicted well on fat-saturated T2- and postcontrast T1-weighted sequences (Fig. 2, 5, and 7). Enlarged lymph nodes alone are not indicators of active inflammation; however, edema, enhancement, and diffusion restriction in the mesenteric lymph nodes adjacent to affected bowel segments may represent active disease (Fig. 6) [2147]. Inflamed and edematous mesenteric fat appears as ill-defined hyperintensities adjacent to inflamed bowel loops on fat-saturated T2- and postcontrast T1-weighted sequences (Fig. 6).
Fistulating and perforating subtype
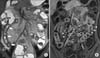
Transmural inflammation extending beyond the wall leads to blind-ending structures (sinus tract) or communications with adjacent epithelialized structures such as bowel loops, the genitourinary tract, and the skin (fistula). Sinus tracts and fistulae are usually observed as linear T2 hyperintense structures arising from the bowel wall. Penetrating diseases, including sinus tracts and fistulae, may lead to the formation of a phlegmon (inflammatory tissue) or an abscess (fluid collection) (Fig. 7) [12130]. Both can show variable signal intensities on T2-weighted sequences because of the presence of gas, oral contrast material, or fecal material, with the latter showing avid rim enhancement. Detection of the penetrating disease is important because the presence of these complications may alter medical therapy; a penetrating disease not accompanied by an abscess is generally treated with antibiotics or biologic agents without steroids. An abscess is a relative contraindication for the use of biologic agents such as infliximab and can be treated with percutaneous drainage [1]. On DWI, these penetrating diseases are depicted as structures with bright signal intensity due to highly viscous pus and dense infiltration of inflammatory cells [35]; therefore, DWI improves the detection of penetrating complications (Fig. 7C).
Fibrostenotic subtype
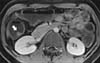
CD exhibits a progressive, destructive course and can consequently result in the formation of fibrostenotic strictures in the later phase because of the progress of structural damage [48]. Persistent luminal narrowing with upstream bowel dilatation indicating overt obstruction may result from active inflammation, fibrosis, or a combination of the two. It is important to differentiate fibrotic strictures from inflammatory strictures for accurate treatment planning. Inflammatory strictures can resolve with medical therapy, whereas fibrotic strictures may require surgical resection or endoscopic intervention. In general, a thickened bowel wall in the fibrotic stricture shows low signal intensity on T2-weighted sequences, with relatively low homogenous enhancement and the lack of extraluminal inflammation [41]. However, differentiation between inflammation and fibrosis on MRE can be challenging because they not only coexist in the same bowel segment but also significantly correlate to each other [40]. The fibrosis component in the acute-on-chronic disease will influence the overall enhancement as well as the mural signal on T2-weighted sequences [43]. In such cases, DWI may be helpful for interpretation. Diffusion restriction is not demonstrated in cases of fibrotic strictures, while active inflammation displays bright signal intensity on DWI [35]. The role of MRE is to guide treatment planning by defining predominant findings and evaluating the degree of bowel obstruction [21].
PITFALLS OF INTERPRETATION
The jejunum generally enhances more than the ileum because of an increased surface area and relative underdistension [14]. This is misinterpreted as affected bowel loops. In this setting, other findings indicating inflammation, such as bowel wall thickening, wall edema, and secondary extraluminal inflammatory changes, are helpful for correct interpretation.
Collapsed bowel loops can result in false-positive or false-negative interpretations. They may appear as abnormally thickened and hyperenhancing loops, with masking of mucosal changes such as ulceration and strictures. In this context, mural signal changes and extraluminal findings should be considered together. Cine MR sequence or delayed imaging would be helpful to avoid any pitfalls.
CONCLUSION
MRE plays an important role in the management as well as diagnosis for children with CD, because it can facilitate the accurate assessment of disease activity and complications such as penetrating and fibrostenotic diseases. Advanced techniques such as DWI and DCE-MRI can be helpful for the quantitative grading of disease activity. Further validation studies involving disease severity grading and treatment response monitoring are warranted.


 XML Download