

 PDF
PDF ePub
ePub Citation
 Print
Print


INTRODUCTION
According to a report from the World Health Organization in 2011, the prevalence of obesity has doubled in the last 30 years [1], and the population of overweight children and adolescents under 18 years of age is 17 million with an annual increase of 0.5-1 percent [2]. Childhood obesity can cause many complications such as hyperlipidemia and steatohepatitis at an early age. It may also lead to obesity in adulthood and thereby result in many lifestyle diseases [34] and affect quality of life [56]. Lee et al. [7] reported that 28.3% and 16.7% of obese children have above normal levels of serum triglycerides and total cholesterol, respectively. Fatty liver, as a result of obesity, can progress to liver cirrhosis [8], and in a report by Zou et al. [9], 55.7% of obese children were found to have non-alcoholic fatty liver diseases.
To measure the thickness of visceral and subcutaneous fat, various modalities of imaging have been tried on adults, such as computed tomography, dual-energy X-ray absorptiometry, and abdominal ultrasonography (US) [101112]. In children, there have been attempts to measure adipose tissue distribution using magnetic resonance imaging and to correlate the measurements with the body mass index (BMI) or elevated serum aminotransferases [13]. However, abdominal US, which is a relatively easy and safe method of imaging for children, has yet to be evaluated for the ability to measure the abdominal subcutaneous fat thickness and to estimate the degree of hyperlipidemia or steatohepatitis based on the measurements.
The aim of this study is to measure abdominal subcutaneous fat thickness using abdominal US in children with obesity and to evaluate the relationship between abdominal subcutaneous fat thickness and hyperlipidemia or steatohepatitis.
MATERIALS AND METHODS
The BMI of all the children brought to Gachon University Gil Medical Center in Incheon, Korea from May 2001 to December 2013 was calculated using their weight and height. Using the growth chart issued by the Korea Centers for Disease Control and Prevention and the Korean Pediatric Society in 2007, BMI above the 95th percentile was defined as obese. To be included in this study, serum lipid and liver aminotransferase levels had to be measured within two weeks prior or subsequent to performing US on a child diagnosed with obesity on whom an abdominal US was performed. A total of 166 children were included, and the data were collected retrospectively.
The children were divided into four groups: toddlers and preschool age children (group A, 2-5 years old), early elementary school age children (group B, 6-8 years old), late elementary school age children (group C, 9-11 years old), and adolescents in middle school (group D, 12-14 years old). Clinical characteristics of the different age groups are available in Table 1.
Diagnosis of hepatic steatosis
Hepatic steatosis was diagnosed by four experienced pediatric radiologists, using US (ultrasound system, Acuson Sequoia-512 [Siemens, Berlin, Germany] and ultrasound system, iU22 [Philips, Amsterdam, Netherlands]). A 6.0 MHz probe was used to evaluate the echogenicity of the liver in the diagnosis of hepatic steatosis. If the echogenicity of the liver was greater than that of the right kidney, hepatic steatosis was suspected and graded as follows [14]: Grade I (mild): slight diffuse increase in the fine echoes in the hepatic parenchyma with normal visualization of the diaphragm and intrahepatic vessel borders. Grade II (moderate): moderate diffuse increase in the fine echoes with slightly impaired visualization of the intrahepatic vessels and diaphragm. Grade III (severe): marked increase in fine echoes with poor or no visualization of the intrahepatic vessel borders, diaphragm, and posterior portion of the right lobe of the liver.
Measurements of abdominal subcutaneous fat
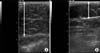
Abdominal subcutaneous fat thickness was measured in the supine position during normal respiration with minimal pressure applied by the US probe. Midline abdominal subcutaneous fat thickness (MASFT) was measured transversely at one centimeter caudal to the umbilicus level and the right flank abdominal subcutaneous fat thickness (RFASFT) was measured coronally at two locations of the right flank, with the average value being recorded (Fig. 1). Measurements of MASFT and RFASFT of all 166 children were correlated with other parameters.
Statistical analysis
All statistical analysis was carried out using SPSS ver. 12.0 (SPSS Inc., Chicago, IL, USA), and all data were expressed as mean±standard deviation. Correlation of parameters were analyzed using Spearman's rank correlation coefficient, and statistical significance was defined as p<0.05. Correlation between abdominal subcutaneous fat thickness and grade of hepatic steatosis was analyzed using one-way ANOVA, and post-hoc test was carried out using the Duncan's multiple range test.
The research process was approved by Gachon University Gil Medical Center Institutional Review Board (GCIRB2014-247).
RESULTS
Clinical characteristics
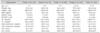
Of the 166 children included in this study, 110 were male and 56 were female. The average age was 9.4±2.7 years (9.6±2.6 years for boys and 9.1±2.9 years for girls). The average weight of all the children was 54.4±16.8 kg, with 55.5±16.5 kg for boys and 51.9±17.2 kg for girls. The average height was 142.8±16.5 cm (143.3±15.8 cm for boys and 141.3± 17.8 cm for girls), and the average BMI was 25.9±3.4 kg/m2 (26.3±3.4 kg/m2 for boys and 25.2±3.2 kg/m2 for girls) (Table 1).
Serum laboratory results
The average values of triglyceride, total cholesterol, high density lipoprotein-cholesterol, and low density lipoprotein (LDL)-cholesterol were 138.0±71.1 (27.0-354.0) mg/dL, 174.5±31.2 (93.0-258.0) mg/dL, 47.2±10.7 (22.0-83.0) mg/dL, and 99.1±28.9 (11.4-186.6) mg/dL, respectively. The average value of aspartate aminotransferase (AST) and alanine aminotransferase (ALT) were 38.4±33.8 (12.0-345.0) IU/L and 52.8±62.7 (4.0-348.0) IU/L, respectively (Table 1).
Abdominal US
Of the 166 children who underwent abdominal US, 107 children were diagnosed with hepatic steatosis; 46 children with grade I (mild), 56 with grade II (moderate), and 5 with grade III (severe) (Table 2).
The average values of MASFT and RFASFT were 3.4±0.9 (1.3-5.8) cm and 2.1±0.8 (0.7-5.4) cm, respectively (Table 1). Neither MASFT (p=0.656) nor RFASFT (p=0.167) had significant difference between the two sexes.
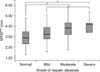
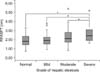
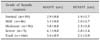
According to the grade of hepatic steatosis, the average values of MASFT and RFASFT were 2.9±0.8 cm and 1.9±0.7 cm in the normal group, 3.3±0.8 cm and 2.0±0.7 cm in grade I, 3.8±0.8 cm and 2.3±0.8 cm in grade II, 4.1±0.8 cm and 2.8±1.4 cm in grade III, respectively (Table 3).
Correlation of MASFT and RFASFT, BMI, serum lipid levels, and serum liver aminotransferase levels
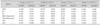
In group A, thicker MASFT was correlated with increased BMI (ρ=0.692, p=0.003). In group B, thicker MASFT was correlated with both increased BMI (ρ=0.559, p=0.001) and elevated ALT (ρ=0.432, p=0.014). In group C, both MASFT (ρ=0.509, p=0.000) and RFASFT (ρ=0.409, p=0.000) were correlated with BMI. Lastly in group D, thicker MASFT was correlated with higher serum levels of AST (ρ=0.477, p=0.004) and ALT (ρ=0.564, p=0.001), and thicker RFASFT was correlated with elevated total cholesterol (ρ=0.466, p=0.006) and LDL-cholesterol (ρ=0.563, p=0.001) (Table 4).
Correlation between abdominal subcutaneous fat thickness and the grade of hepatic steatosis observed on abdominal US
MASFT and the grade of hepatic steatosis showed a statistically significant correlation (p=0.000). Post-hoc comparison showed the average value of MASFT in the normal group was not significantly thinner than that of grade I, but was significantly thinner than that of grade II and III. The average value of MASFT of grade I was significantly thinner than that of grade III (Table 3, Fig. 2).
DISCUSSION
There have been studies that have attempted to measure the abdominal fatty tissues in children through computed tomography or magnetic resonance imaging and to observe the relationship between the abdominal fatty tissues, BMI, and liver aminotransferases [1315]. Even though abdominal US provides safe and easy imaging, there are no studies that address the relationship between abdominal subcutaneous fat thickness measured by abdominal US and hyperlipidemia or steatohepatitis in children. This study addressed this issue and found that abdominal subcutaneous fat thickness (MASFT and RFASFT) correlated with BMI and hepatic steatosis. In addition, hyperlipidemia and steatohepatitis correlated with the abdominal subcutaneous fat thickness (MASFT and RFASFT) in the age group of 12-14 years (group D). This implies that measuring the abdominal subcutaneous fat thickness will aid in the estimation of complications that result from obesity in the adolescent population. To ensure a more accurate measurement of abdominal subcutaneous fat thickness, both transverse measurement (MASFT) and coronal measurement (RFASFT) of the abdominal subcutaneous fat thickness were used.
Prior studies have found a higher degree of obesity to be related to higher serum levels of lipids [71617]. This study also found that higher BMI was significantly related to higher levels of total cholesterol (ρ=0.163, p=0.036) and LDL-cholesterol (ρ=0.155, p=0.046). Prolonged obesity in children leads to chronic complications, such as type 2 diabetes, hypertension, dyslipidemia, and carotid-artery sclerosis [4].
Fatty liver disease has been associated with obesity in children [918]. Zou et al. [9] and Boyraz et al. [18] reported that 55.7% and 48.1% of obese children have non-alcoholic fatty liver disease, respectively. This study also found that 64% of obese children have hepatic steatosis. Fatty liver disease caused by obesity is more likely to follow a benign course; however, some report various forms of liver damage accompanying obesity [192021]. Andersen and Gluud [22] reviewed 41 papers and reported that amongst the 1,515 obese patients who underwent liver biopsy, 80% had signs of fatty degeneration and 3% had fatty liver cirrhosis.
The grade of hepatic steatosis has been correlated with the degree of obesity [23]. This study also found that higher BMI was correlated with thicker MASFT (ρ=0.569, p=0.000) and RFASFT (ρ=0.452, p=0.000), and that abdominal subcutaneous fat thickness differed significantly between the grades of hepatic steatosis. Therefore, measurement of abdominal subcutaneous fat thickness can aid in the estimation of the grade of hepatic steatosis and can have clinical implications.
Especially in the age group of 12-14 years, thicker abdominal subcutaneous fat was correlated with higher levels of serum total cholesterol (ρ=0.466, p=0.006), LDL-cholesterol (ρ=0.563, p=0.001), AST (ρ=0.477, p=0.004), and ALT (ρ=0.564, p=0.001). Therefore, in children over 12 years of age undergoing abdominal US, abdominal subcutaneous fat thickness measured by US will aid in the estimation of the degree of hyperlipidemia and steatohepatitis, in addition to measuring serum lipid profile and liver transaminases.
The limitations of this study are as follows: four radiologists participated in the measurement of the MASFT, RFASFT, and the grade of hepatic steatosis, and interpersonal differences could have existed, but not been corrected. In addition, biopsies were not performed in any of our patients, thus histological confirmation of the grade of hepatic steatosis could not be carried out.
In conclusion, abdominal subcutaneous fat thickness measured by US can be used as a reliable predictor of possible hyperlipidemia and steatohepatitis in children, especially during the adolescent stage.

 XML Download