

 PDF
PDF ePub
ePub Citation
 Print
Print


INTRODUCTION
Epithelial ovarian cancer (EOC) is the leading cause of gynecologic cancer death in Western countries [1]. Despite standardized treatment consisting of cytoreductive surgery followed by platinum-based systemic chemotherapy, the prognosis of patients with advanced ovarian cancer is poor and the majority of them experience recurrences [2,3]. As a result, there has been considerable interest in developing predictive markers to assess the risk of a relapse in advanced EOC patients. The most famous biomarker in EOC is CA-125, which has been used in both diagnosis of the disease and monitoring of treatment [4-6]. Recent evidence indicates that the nadir CA-125 level after completion of primary treatment was associated with prognosis [7-11]. Though the use of prognostic information is not well studied, some have proposed its possible role in the stratification of patients in clinical trials and planning further treatment [9,10].
Many researchers have usually used the cut-off value of 10 and/or 20 U/mL [7,9-11]. Some suggested 12 U/mL as a cut-off value based on the median CA-125 level of their study cohort [8]. However, there was still no consensus about the proper cut-off value of nadir CA-125 that can discriminate patients with better prognosis from those with poorer outcome. If we should stratify the trial group or plan a novel consolidation treatment to improve the outcome of the poor prognostic group, what cut-off value should we adopt for discriminating the patients? Can we classify patients with a nadir level of 10.5 as belonging to an unfavorable group, while classify others with a nadir level of 9.5 as favorable? The current study was designed to answer this question and to provide a possible algorithm to determine a non-arbitrary cut-off value of nadir CA-125. Here, we show the discrimination performance at various cut-off level of nadir CA-125 which help to determine the ideal cut-off value of post-operative CA-125 in order to discriminate between high- and low-risk groups.
MATERIALS AND METHODS
From two institutions, the National Cancer Center (Goyang, Korea) and the Samsung Medical Center (Seoul, Korea), we identified 436 patients who had undergone surgery for advanced (stage III or IV) EOC between January 2001 and December 2007, consecutively. Institutional review board approval was exempted because the patient information was de-identified. All patients treated at the institution during that time period were included in the analysis; those with borderline tumors were excluded. The inclusion criteria were as follows: 1) serum CA-125 levels at the time of diagnosis >35 U/mL, 2) clinical, biochemical (post-treatment serum CA-125 ≤35 U/mL) and radiologic complete remission (CR), and 3) available records for CA-125 levels at the time of diagnosis and at its nadir. The pretreatment CA-125 level was required to be reported within 4 weeks from the time of diagnosis. The post-treatment CA-125 level was required to be reported after 2 weeks but within 4 weeks from the end of chemotherapy. To determine nadir CA-125 levels, at least two serial serum CA-125 level determinations with at least 2 weeks interval were required within 4 months following the end of treatment. With these inclusion criteria, 267 patients were finally selected for the analysis. The data from these patients were used in a previous publication by our group [11].
The medical records of these patients were reviewed and the following information were collected: age at diagnosis, tumor grade and histology, tumor stage, serum CA-125 levels at the time of diagnosis, optimality of cytoreductive surgery, nadir serum CA-125 concentration, and timing of recurrence and/or disease status at the last follow-up. The serum CA-125 level was determined with a radioimmunoassay. No centralized measurement was applied. All patients were surgically staged according to the International Federation of Gynecology and Obstetrics (FIGO) system. Optimal cytoreduction was defined as no residual tumor measuring ≥1 cm in the maximal dimension at the completion of the surgical procedure. After surgery, all patients received adjuvant chemotherapy with carboplatin (area under the curve of 5) and paclitaxel (175 mg/m2) for six to nine cycles. When a patient is in poor medical condition or when preoperative radiologic imaging suggests unsuccessful optimal surgery, neoadjuvant chemotherapy based on carboplatin and paclitaxel was administered based on the clinician's decision.
The progression-free survival (PFS) was the primary endpoint, and was defined as the interval between the date of initial treatment until the last date of follow-up, or the date of recurrence. After CR, all the patients were followed-up with an interval of less than 3 months. Serum CA-125 was obtained at each visit. Disease recurrence was defined as the appearance of a new lesion, or the reappearance of any lesion that had disappeared on diagnostic imaging (computed tomography [CT] and magnetic resonance imaging [MRI]).
All statistical analyses were performed using STATA ver. 10.0 (College Station, TX, USA). The survival distributions were estimated by the Kaplan-Meier method, and statistical significance was determined by the log-rank test and Cox's proportional hazard model analysis. The formula for a positive likelihood ratio (LR) is sensitivity/(1-specificity), and the formula for a negative LR is (1-sensitivity)/specificity. A clinically useful test was defined as having a positive LR >5.0 and a negative LR <0.2. All p-values presented were two-sided, and associations were considered significant if the p-value was <0.05.
RESULTS
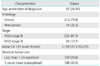
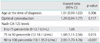
The clinical and pathological characteristics of 267 patients are summarized in Table 1. The median age was 55 years and 59.6% of the patients had optimal cytoreduction during their surgery. The median follow-up time was 41.9 months and the median PFS was 21.2 months (95% confidence interval [CI], 18.0 to 22.9 months). The patients who had nadir CA-125 levels under 10 U/mL showed significantly better survival compared with patients with nadir between 10 and 35 U/mL (log rank test, p=0.0001).
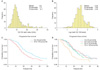
The distribution of nadir CA-125 level is shown in Fig. 1A. It showed a skewed distribution. Nadir CA-125 levels from half of the patients were located between 7.3 and 12.1 U/mL. Therefore, we calculated the logarithm of CA-125 and the corresponding distribution (Fig. 1B). In all Cox's hazard models of the current study, the logarithm transformation was applied for nadir CA-125 level. Then, we divided the patients by median level of nadir CA-125, which is 9.3 U/mL. As expected, we observed that PFS was strongly correlated with nadir CA-125 levels (p=0.002) (Fig.1C). Next, we divided the group by 25, 50, and 75 percentiles of nadir CA-125 (7.3, 9.3, and 12.1 U/mL) and tested the difference in PFS among the four groups. Interestingly, the PFS of the 50-75 percentile group was not different from that of the 25-50 percentile group, and even from that of the 0-25 percentile group. However, only the 75-100 percentile group showed significantly different PFS from the other groups (p<0.001) (Fig. 1D). Then, we compared the hazard ratios in order to show that nadir CA-125 was a weak predictor among the 25-75 percentile group (Table 2). We tested age, histology, stage, initial CA-125 level, optimality of cytoreduction as predictors, and age and optimality of cytoreduction were found to be significant predictors for multivariate analysis. The logarithm of nadir CA-125 level was not associated with hazard ratio within each group except for the 75-100 percentile group (p=0.034).
Based on the above observations, we tested the diagnostic performance of several provisional cut-off values of nadir CA-125 (10, 12 and 18 U/mL) in predicting PFS at 6 and 12 months (Table 3). In the prediction of PFS <6 months and <12 months, the cut-off value of 18 U/mL showed the highest accuracy (89.2% and 80.8%, respectively), while accuracy was lowest in the cut-off level of 10 U/mL. If we may weigh the predicting power of the high-risk group greater than classification accuracy, positive LR and specificity should be of interest. Again, the cut-off value of 18 U/mL showed the highest positive LR and specificity in prediction of PFS <6 months and <12 months. As a result, the cut-off of 18 U/mL showed the highest positive predictive value in predicting both end points (28.6% and 52.0%, respectively).
Finally, we classified the study cohort into three groups at the cut-off of 12.1 U/mL (75 percentile) and 18.1 U/mL (90 percentile) and performed multivariate Cox analysis (Table 4). The FIGO stage was not included in the multivariate analysis because it did not show significant association in univariate analysis (p=0.742). In multivariate analysis, the current data were unable to detect an association between optimal cytoreduction and outcome (p=0.117). The hazard ratio was significantly higher in the 75-90 percentile group (1.68; 95% CI, 1.11 to 2.56) and in the 90-100 percentile group (2.85; 95% CI, 1.70 to 4.76) when they were compared with the 0-75 percentile group.
DISCUSSION
Based on previous evidence [7-11], it is clear that the posttreatment nadir CA-125 level is a good predictor of PFS of EOC. Interestingly, many studies have used an arbitrary cutoff value or a median value for the stratification of the cohort [7,9-11], but not a cut-off value determined on the basis of its diagnostic performance. In contrast to data of previous studies, the strength of our data is that the cut-off value has been tested with their diagnostic performance and area under the ROC curve. Moreover, we analyzed the distribution of the nadir value of CA-125 and determined the interval where the nadir level provided a prognostic value.
The current study revealed interesting features of the nadir CA-125 levels in patients who achieved CR. First, a large proportion of the patients who achieved CR had nadir CA-125 levels around 10 U/mL. Our data showed that the log-transformed nadir CA-125 levels in patients with CR had a normal distribution and that half of the patients had their nadir CA-125 levels between 7.3 and 12.1 U/mL. Thus, it is evident that dichotomization using a cut-off value near the median may result in inaccurate classification. Indeed, our data indicated that the nadir CA-125 level provided little prognostic information in the interval between 7.3 and 12.1 U/mL. In contrast, the nadir CA-125 level had a prognostic value only when it fell between 12.1 and 35 U/mL.
Second, we showed that the conventional cut-off of 10 U/ mL did not provide reliable diagnostic performance. In the prediction of PFS at given time points (6 and 12 months), it showed inferior performance, both in classification accuracy and reliability of screening high-risk patients. Indeed, there were conflicting data among several prospective cohorts about the differences in PFS between a group with nadir of 0-10 U/mL and that with 10-20 U/mL [9,12]. Rather, our data showed that 18 U/mL was the better cut-off value. Although we can only identify 10% of the patients who achieved CR as being in the high-risk group, it has high specificity and a better positive LR compared with other suggested cut-off values. If we may sacrifice accuracy for the inclusion of more high-risk patients, 12 U/mL should be the next choice. However, it is arguable that our results are valid for the current dataset and might not be generalized. Thus, our data should be validated in an external dataset.
In summary, the conventional cut-off of 10 U/mL should not be recommended in guiding treatment decisions or stratifying patients because 1) the centralized distribution of nadir CA-125 around the median value may result in considerable misclassification; 2) its overall diagnostic performance is not satisfactory; and 3) when the nadir CA-125 value is near the median value, the correlation between CA-125 and survival outcome is not significant. Although either cut-off value of 10 or 12 U/mL may show statistically significant correlation with PFS, the current study states that it does not provide clinically useful information in dichotomization or stratification of patients. Considering the positive LR and accuracy, we suggest 18 U/mL as the optimal cut-off value of nadir CA-125 that can be used to identify high-risk patients with moderate reliability.


 XML Download