

 PDF
PDF ePub
ePub Citation
 Print
Print


INTRODUCTION
Cisplatin (cis-diamminedichloroplatinum II) has been used to treat various malignant tumors, including epithelial ovarian cancer (EOC),1 the most common type of ovarian cancer. The platinum analogue can cross-link DNA to interfere with the mitosis of cancer cells. Clinical chemotherapy is prescribed to the patient on the basis of the statistical validity of its efficacy and safety. However, many patients who have received chemotherapy with platinum derivatives have exhibited resistance to cisplatin, leading to a low 5-year survival rate.2,3 Several hypotheses pertinent to the mechanism of the resistance have been proposed: 1) reduction in drug accumulation within cancer cells;4-6 2) elevation of detoxification function within cells;7 3) activation of the repair mechanism for DNA damage;8,9 4) defects in mismatch repair;5,6,10,11 and 5) reduction in sensitivity to apoptosis induced by the drugs.12 Resistance to cisplatin can be explained by altered cellular reaction to DNA damage or activation of insensitivity mechanisms.13-16
Since the 1950s, a series of tests referred as to chemotherapy sensitivity and resistance assays (CSRAs) have been introduced.17,18 These tests involve the measurement of dehydrogenase activity, staining for cell viability, the measurement of the intracellular intake of a drug using radioisotopes, the measurement of drug metabolites after administration of the drugs, and the measurement of cell colony formation. In vitro CSRA of surgical specimens from patients with ovarian cancer are limited by heterogeneous cellular composition, a long evaluation time, and high cost. Even in patients with the same histological microscopic diagnosis, individual sensitivity to a given chemotherapeutic agent can vary.19-21 If the response of a patient to a chemotherapeutic drug could be predicted prior to its administration, then the prescription of personalized chemotherapeutic agents and the omission of ineffective or inappropriate drugs could decrease unnecessary side effects and costs. To explore the differential pattern of transcriptional levels of tumor suppressor genes, oncogenes, transcription factors, growth factors, genes for repairing DNA damage, and apoptosis-regulating genes, single-gene-based approaches were applied for each patient or cell line. Thus, a DNA microarray that can evaluate the expression levels of a large number of genes in a short time may be utilized to obtain the global pattern of gene expression for each sample from a patient or an established cell line.22-25 The cell lines derived from EOC patients would be useful for in vitro anti-cancer drug screening and for the identification of novel and effective treatment regimens.26
Here, in order to identify the genes involved in the cisplatin resistance of 2 ovarian cancer cell cells, SKOV-3 and OVCAR-3, derived from clinically drug-resistant patients with EOC, we utilized the DNA microarray to monitor the change in transcriptional levels of genes related to apoptosis after cisplatin treatment and to validate the change in the levels of proteins corresponding to the identified genes.
MATERIALS AND METHODS
1. Cell lines and cell culture
Two ovarian cancer cell lines, NIH: OVCAR-3 and NIH: SKOV-3, were obtained from the American Type Culture Collection. Cells were cultured in RPMI-1640 medium (Gibco, Carlsbad, CA, USA) supplemented with 10% (v/v) fetal bovine serum (Invitrogen, Carlsbad), 100 U/mL penicillin G, and 100 µg/mL streptomycin at 5% CO2 and 37℃.
2. Cell proliferation analysis
The 2 cell lines in the exponential growth phase were diluted to 3×10³ cells in 200 µL of the complete culture medium, seeded into a 96-well plate, and cultured in an incubator at 5% CO2 and 37℃. When the cells reached 20% to 30% confluence, cisplatin at final concentrations of 0, 10, 50, 100, 200, and 500 nM was added, and the cells were cultured for 0, 6, 12, 24, 48, and 72 hours. At each time point, 100 µL of culture medium was aspirated from each well, and 20 µL of a mixture of MTS solution (Promega, Madison, WI, USA) and an electron-coupling reagent (phenazine ethosulfate) was added. The absorbance of each well was measured at 490 nm using a 96-well plate reader (Tecan Systems, San Jose, CA, USA). The absorbance of the cisplatin-treated groups against the absorbance of the untreated group was converted to a normalized survival percentage, and the cisplatin concentration that could suppress cell proliferation to 50% was estimated at each time point. MTS assay for cell survival under cisplatin treatment was carried out independently 3 times for each cell line.
3. Fluorescence-activated cell sorting analysis
Cells in culture undergoing exponential growth were transferred to 75-cm2 flasks, and cisplatin was treated at final concentrations of 0, 10, 50, 100, 200, and 500 nM. Cells were harvested after 12 hours, centrifuged at 125 g for 5 minutes, and resuspended to 1×10⁶ cells/mL in 1× phosphate-buffered saline (PBS). For each cell line, 2 aliquots were prepared for the control and experimental groups. The suspended cells were washed with twice PBS at 4℃ and resuspended in 1× binding buffer of a fluorescein isothiocyanate (FITC) annexin V apoptosis detection kit (BD Bioscience, San Jose, CA, USA) to a final concentration of 1×10⁶ cells/mL. Annexin V-FITC (5 µL, 1×) and propidium iodide (PI; 5 µL, 50 µg/mL) were added to 100 µL of each cell aliquot in a test tube. Each tube was vortexed lightly and incubated at 25℃ in the dark for 15 minutes. Subsequently, 400 µL of 1× binding buffer was added to each tube. Flow cytometry was performed, and the progress of apoptosis was estimated using ModFit (Verity Software House, Topsham, ME, USA). Three independent fluorescence-activated cell sorting (FACS) trials were carried out for each cell.
4. Preparation of labeled cDNA
When cells were cultured in the log phase, they were transferred to a 75-cm2 culture flask, engrafted for 48 hours, and subsequently treated with cisplatin at a final concentration of 50 nM for 0, 3, 6, 9, and 12 hours. The cells were detached with 0.25% trypsin and 0.02% ethylenediaminetetraacetic acid. The total RNA was extracted using the RNeasy Mini kit (Qiagen, Seoul, Korea), and the quality of the extracted RNA was assessed by gel electrophoresis with a formaldehyde agarose gel. RNA extraction was performed independently 3 times for each cell line. The extracted RNA was labeled using an amino-allyl cDNA labeling kit (Ambion, Austin, TX, USA).
5. Hybridization and quantification
Dendron-modified slides provided by NSB-Postech (Seoul, Korea) were used for the DNA microarray.27 The 70-mer gene-specific probes for 374 apoptosis-associated genes (Operon, Huntsville, AL, USA) were spotted on the DSC-activated slide. For hybridization, Cy3-labeled cDNA was added to a hybridization buffer, denatured at 90℃ for 5 minutes, and incubated in the hybridization station (solutions, GeneTAC, Midland, ON, Canada) at 40℃ for 12 hours. The slide was washed with solution containing 1× standard saline citrate (SSC) and 0.1% sodium dodecyl sulfate (SDS) at 40℃ for 2 minutes, then washed with the same solution at 40℃ for 5 minutes, and then washed in a solution containing 0.1× SSC and 0.1% SDS at 25℃ for 10 minutes. Finally, the slide was washed twice with 1× SSC at 25℃ for 2 minutes and dried under a stream of nitrogen gas. A confocal laser scanner (ScanArray Lite; GSI Lumonics, Nepean, ON, Canada) was used for the acquisition of the fluorescence signal of the microarray slide. The fluorescence signal was quantified using ImaGene (Bio-Discovery, El Segundo, CA, USA).
6. Western blot analysis
Cells treated with 50 nM cisplatin for 12 hours and untreated cells were homogenized in a cell lysis buffer (RIPA buffer; ELPIS-biotech, Daejeon, Korea) supplemented with a protease inhibitor cocktail (Complete Mini; Roche, South San Francisco, CA, USA). The soluble proteins were obtained by centrifugation at 14,000× g and quantified using a Bio-Rad protein assay kit (Bio-Rad, Hercules, CA, USA). Samples of 80 µg per lane were analyzed by SDS-polyacrylamide gel electrophoresis, blotted on the nitrocellulose membrane, then blocked with 5% skim milk in tris-buffered saline containing 0.5% Tween20 (TBST) at room temperature for 1 hour. All monoclonal antibodies for CARD4, CASP3, DAD1, EMP3, FASTK, IGFBP6, TNFRSF11A, TNFRSF18, and GAPDH were purchased from Sigma-Aldrich (St. Louis, MO, USA). As a horseradish peroxidase-linked secondary antibody, a rabbit anti-goat IgG antibody (Sigma-Aldrich) was used for electrochemiluminescence detection (Amersham, Uppsala, Sweden). The developed bands on an X-ray film (Agfa, Mortsel, Belgium) were quantified using the NIH Image/J program (available at http://rsbweb.nih.gov/ij/).
7. Analysis of DNA microarray data
A fluorescence intensity that was greater than 3 times the standard deviation of the background (or noise) level was accepted as a signal that would be further processed. The background level was measured from 10 random points over the solid surface except in the gene spot area. The fluorescence intensity of spots with a coefficient of variation (CV) value (a ratio of the standard deviation to the mean) less than 0.5 was considered to be reproducible and was accepted for subsequent normalization with the LOWESS method as described previously.28 A similar pattern of transcriptional levels was clustered by Gene Cluster 3.0 and graphically visualized by TreeView 1.6 (both programs were obtained from http://rana.lbl.gov/EisenSoftware.htm).
RESULTS
1. Comparison of IC50 to cisplatin
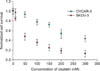
IC50 values for SKOV-3 cells after treatment with cisplatin for 12, 24, 48, and 72 hours were 80.2, 47.2, 6.8, and 5.7 nM, respectively. In the case of OVCAR-3 cells, the IC50 value for the 12-hour treatment was estimated to be greater than 500 nM, whereas the IC50 values after 24, 48, and 72 hours were 209.7, 167.8, and 18.5 nM, respectively. The normalized survival of each cell line was plotted as a function of the concentration of cisplatin over 24 hours as shown in Fig. 1.
2. FACS analysis for apoptotic cell death
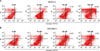
The percentage of cells in the apoptotic region of the quadrant in FACS analysis was assessed to be 5.0, 4.8, 7.7, and 19.9% when SKOV-3 cells were treated for 12 hours with 0, 10, 50, and 100 nM of cisplatin, respectively (Fig. 2). It was confirmed that the apoptotic fraction increased in proportion to the concentration of cisplatin added. In contrast, percentage of cells in the apoptotic region was assessed to be 0.6, 3.8, 6.9, and 9.5% when OVCAR-3 cells were treated for 12 hours with 0, 10, 50, and 100 nM of cisplatin, respectively. When an identical amount of cisplatin was added to the 2 ovarian cancer cell lines, more apoptotic cells were observed in SKOV-3 than in OVCAR-3.
3. Measurement of change in transcript levels by DNA microarray
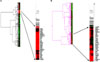
When the expression level of GAPDH mRNA was set to 1.0, all detection signals were normalized with respect to the fluorescence intensity of GAPDH. When the mRNA levels of SKOV-3 after treatment with 50 nM cisplatin for 3, 6, 9, and 12 hours were clustered and compared to the expression level of each gene of untreated cells as the control (Fig. 3), the changes in the expression levels after 3 hours and 12 hours were significantly different, whereas the changes after 6 hours and 9 hours were similar. In contrast, the changes in the expression levels of genes in OVCAR-3 treated with 50 nM cisplatin for 3, 6, 9, and 12 hours were similar after 3 and 9 hours.
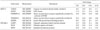
When genes with a CV value of fluorescence intensity less than 0.5 were selected at each time point, the change in the transcriptional levels of each selected gene at the different time points was estimated as the ratio of the fluorescence intensity at that time point to that at 0 hour. The genes with more than a 10-fold increase in transcriptional level in the 2 cell lines are listed in Table 1. In the case of SKOV-3 cells, the CARD4, FASTK, TNFRSF11A, and TNFRSF18 genes, which are associated with apoptosis, were significantly over-expressed over the 4 time points compared to their levels at 0 hour. The IGFBP6 gene, which can suppress cell proliferation, was also over-expressed in the cisplatin-treated cells. In the OVCAR-3 cells, the CAPS3 and EMP3 genes, which are associated with apoptosis, and the EMP3 gene, which is related to cell death, were over-expressed, as was DAD1, an anti-apoptotic gene that was up-regulated upon treatment with cisplatin.
4. Change of protein levels upon cisplatin treatment
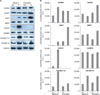
Four proteins, CARD4, FASTK, TNFRSF11A, and TNFRSF18, were more over-expressed in cisplatin-treated SKOV-3 cells than in untreated cells (Fig. 4). A substantial increase in the level of IGFB6 was not detected compared to untreated cells, which was not in agreement with the results of the DNA microarray. The over-expression of DAD1 was observed upon cisplatin treatment. In contrast, CASP3, TNFRSF11A, TNFRSF-18, and EMP3 were over-expressed in OVCAR-3 cells in response to cisplatin treatment, although the over-expression of TNFRSF11A and TNFRSF18 was not in accord with the change in their transcriptional levels. The level of DAD1 protein that could inhibit cellular apoptosis was substantially elevated upon treatment with cisplatin compared with untreated OVCAR-3 cells. The expression level of GAPDH protein was constant in the 2 cell lines regardless of cisplatin treatment.
DISCUSSION
We investigated the cisplatin resistance characteristics of 2 ovarian cancer cell lines, SKOV-3 and OVCAR-3, through FACS analysis and comparison of IC50 values. We also used immune-blotting to validate the 8 up-regulated transcripts identified by DNA microarray to monitor change in protein levels.
The 4.4-fold higher IC50 value of OVCAR-3 treated with cisplatin for 24 hours (Fig. 1) and the smaller number of apoptotic cells compared with SKOV-3 (Fig. 2) shows that OVCAR-3 is more resistant to cisplatin, leading to a higher survival capacity in the face of apoptosis-inducible DNA damage. Gao et al.26 reported that OVCAR-3 cells showed more resistance to paclitaxel, a mitotic inhibitor, by stabilizing microtubules, with an approximately 33-fold higher IC50 compared to SKOV-3 cells. The discrepancy in the fold change of IC50 values and the number of apoptotic cells might be attributable to the intrinsic difference between the MTS assay and FACS. Whereas the MTS assay can estimate the activity of mitochondria within cells to show colorimetric change proportional to the number of working enzymes in the mitochondria of cisplatin-treated cells, FACS enables the enumeration of dead cells stained with FITC-labeled annexin V in response to exposure to phosphatidyl serine in the cytosol membrane and PI-stained cells containing fragmented DNA.
The change in the expression levels of proteins for the genes up-regulated in response to cisplatin treatment could explain the higher resistance to apoptosis of OVCAR-3 compared to SKOV-3. What is interesting is that the 8 up-regulated genes in SKOV-3 and OVCAR-3 (Table 1) showed different regulation patterns of protein levels (Fig. 4). Among the proteins of interest, DAD1, a negative regulator of programmed cell death, was over-expressed in OVCAR-3 in response to an anti-cancer drug,29,30 whereas cisplatin-treated SKOV-3 cells showed a similar level of DAD1 as untreated OVCAR-3 cells. The 10-fold higher up-regulation in protein levels of FASTK31 and TNFRSF11A,32 both known as positive regulators of apoptosis, supports the higher sensitivity of SKOV-3 to cisplatin. A 10-fold up-regulation in the transcriptional levels of CARD4 and TNFRSF18 was observed in both the ovarian cancer cell lines tested, whereas CASP3 and IGFBP6 did not show a significant change in response to cisplatin treatment. The discrepancy between the transcriptional levels and protein levels might be explained by the further validation of the microarray data with immuno-blotting or immuno-histochemistry, as cellular events are mainly regulated by proteins rather than transcripts, and the differential turnover of each protein can lead to the low correlation.
Compared to conventional CSRA methods, DNA microarray ensures the high-throughput analysis of the transcript levels of cancer cells treated with a single or multiple anti-cancer drug(s), including several platinum-derivatives used to cure ovarian cancer. The dendron-coated surface used as the microarray platform in this study showed a low background level, providing high signal-to-noise ratio for the detection of apoptosis-associated genes.
In conclusion, genes up-regulated in 2 ovarian cancer cells in response to cisplatin treatment were identified by dendron-coated DNA microarray and their protein levels validated by conventional immuno-blotting. Our data suggest that the cisplatin-induced up-regulation of DAD1 in transcriptional and protein levels could contribute to the cisplatin resistance of OVCAR-3, whereas the up-regulation of FASTK and TNFRSF11A in SKOV-3 results in higher sensitivity to cisplatin. Microarray-based evaluation in combination with detection of protein levels would be useful for identifying the genes involved in chemotherapeutic resistance, predicting the efficacy of anti-cancer drugs, and improving the prognosis of cancer patients subjected to chemotherapy.
 XML Download