

 PDF
PDF ePub
ePub Citation
 Print
Print


INTRODUCTION
Acetylation of DNA-bound core histones and sequence-specific transcription factors is a fundamental mechanism of transcriptional regulation. Histone acetylation is typically associated with increased transcription1 and is regulated by two opposing classes of enzymes: histone acetyltransferases, which add acetyl groups to specific lysine residues of histone, and histone deacetylases (HDACs), which catalyze their removal. A second mechanism by which HDACs may regulate gene transcription is by regulating acetylation of DNA sequence-specific transcription factors. Examples include p53, E2F and Sp3, where deacetylation has been linked to reduced DNA binding or transcriptional activity.2-4
Through these mechanisms, HDACs are emerging as critical regulators of cell growth, differentiation, and apoptosis. Mariadason et al.5-7 have demonstrated that HDAC inhibitors such as sodium butyrate, trichostatin A (TSA), suberoylanilide hydroxamic acid (SAHA), and valproic acid induce cell cycle arrest, differentiation, and apoptosis in colon cancer cell lines in vitro. Takai at el.8 have shown that treatment with HDAC inhibitors dramatically and significantly increases the number of apoptotic cells in all nine ovarian carcinoma cell lines studied. These observations suggest a physiological role for transcriptional repression mediated by HDACs in maintaining cell proliferation and survival, and inhibiting differentiation. Correspondingly, the deregulation of HDAC-mediated transcriptional repression has been linked to tumorigenesis. Several tumors are already known to have higher HDAC activities than normal cells.9 HDAC is of interest as a novel anti-tumor therapeutic target.
To date, 18 members of human HDACs have been identified and categorized into four classes, based on homology to yeast HDACs and phylogenetic analysis.10,11 In general, class I HDACs (HDACs 1-3 and 8) are primarily located in the nucleus and are associated with transcriptional repressors and cofactors, although there might be exceptions such as HDAC3 which are reported to be also located in the cytoplasm.12 Class II HDACs (HDACs 4-7, 9 and 10) are large proteins that shuttle between the cytoplasm and the nucleus. The functions of most class III HDACs and class IV HDAC (HDAC 11) remains to be elucidated. Class I and class II HDACs are homologous to yeast RpD3 and Hda1, respectively, and are responsive to the already known HDAC inhibitors.13
In this study, we investigated the expression levels of HDAC1, HDAC2 and HDAC3 in primary human ovarian cancer (serous, mucinous and endometrioid cancers) tissues, through RT-PCR and immunoblot analysis. The expression levels of HDACs1-3 in ovarian cancer tissues were compared with those of normal ovarian tissues. The expression pattern was also topologically examined by an immunohistochemical method.
MATERIALS AND METHODS
1. Human ovarian tissue samples
Patient data were retrieved from those who had underwent surgery at the Department of Obstetrics and Gynecology in Asan Medical Center, from May 2006 to October 2007. According to the pathologic results, six patients were allocated randomly in each group of malignant serous, malignant mucinous and malignant endometrioid ovarian tumors. All patients were chemotherapy naive patients. Another six with normal ovarian tissues were included for comparison. These six patients had their normal ovaries removed for benign gynecological diseases. Two patients with ovarian cancer were diagnosed as stage IIC disease, and the rest were diagnosed as stage IIIC disease. All cancers were grade 3 histology. The mean ages of normal and cancer patients were 53.2±3.3 and 55.6±4.2, respectively. Immediately after removal, appropriate tumor tissues and normal ovarian tissues were quickly frozen at -70℃ until extraction of RNA and protein. Paraffin-embedded blocks were prepared for immunohistochemistry.
2. RNA isolation and RT-PCR
Total RNA was isolated from normal and cancer tissues using Trizol reagent according to manufacturer's instruction. Purity and the amount of RNA were measured using a spectrophotometer. Total RNA (1.0 µg) was used for reverse transcription, and each PCR reaction was carried out. The PCR primer sequence for HDAC1, HDAC2 and HDAC3 was as follows: HDAC1 sense, 5'-AACCTGCCTATGCTGATGCT-3', and antisense, 5'-CAGGCAATTCGTTTGTCAGA-3', HDAC2 sense, 5'-GGGAATACTTTCCTGGCACA-3, and antisense, 5'-ACGGATTGTGTAGCCACCTC-3', HDAC3 sense, 5'-TGGCTTCTGCTATGTCAACG-3', and antisense, 5'-GCACGTGGGTTGGTAGAAGT-3'. After the PCR reaction, the products were analyzed by electrophoresis on 1.2% agarose gel and visualized by ethidium bromide staining.
3. Western blot analysis
The frozen tissues were homogenized in lysis buffer. After sonification, the homogenate was centrifuged at 13,000 rpm for 20 minutes, and the supernatant was collected. Protein concentration was estimated using BCA protein Assay. Thirty µg of total protein was separated on SDS-polyacrylamide gel and transferred onto a nitrocellulose membrane according to standard procedures. The membranes were blocked with 5% nonfat dry milk in Tris buffered saline Tween-20 (TBST) and incubated with polyclonal antibody to each HDAC (1:1,000) for 2 hours. The membranes were washed 3 times with TBST followed by incubation with peroxidase conjugated secondary antibody (1:5,000) for 1 hour. The membranes were washed and the bands were visualized by enhanced chemiluminescence. After membranes were washed with stripping solution, β-actin was detected in order to serve as an internal loading control of cell lysates.
4. Immunohistochemistry
Sections of paraffin-embedded tissues placed on microscopic slides were deparaffinized and rehydrated with xylene and a graded series of ethanol. Sections were stained by sequential incubation with each HDAC antibodies at 1:100 dilution, followed by incubation in Texas red-conjugated goat anti- rabbit l gG at 1:200 dilution. After extensive washes with 0.3% Triton X-100 and in PBS, the sections were air dried, and cover slips were sealed with aqueous mounting medium. All sections were photographed with an inverted microscope. For quantitation, we collected the fluorescent images with a single rapid scan with identical parameters (such as brightness & contrast) for each samples. We determined weak, moderate, and strong staining in immunohistochemistry according to intensities of fluorescence.
RESULTS
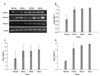
To investigate the mRNA levels of HDAC1, HDAC2 and HDAC3 in ovarian cancer tissues and normal ovarian tissues through RT-PCR, 18 ovarian cancer tissues including 6 serous cancer tissues, 6 mucinous cancer tissues and 6 endometrioid cancer tissues were used, and compared with 6 normal ovarian tissues. Increased expressions of HDAC1 mRNA and HDAC3 mRNA were detected both in 83% of cancer tissues (15 of 18) compared to normal ovarian tissues. Increased expression of HDAC2 mRNA was detected in 67% of cancer tissues (12 of 18) compared to normal ovarian tissues. As shown in Fig. 1, the relative densities of HDAC1 mRNA in serous, mucinous, and endometrioid cancer tissues were significantly higher than those in the normal tissues, respectively (p<0.05). Similar statistical results were obtained in the expression of HDAC3 mRNA in three the kinds of ovarian cancer tissues, compared with normal ovarian tissues (p<0.05). The relative density of HDAC2 mRNA in serous cancer tissues was also significantly higher than normal tissues (p<0.05). The relative density of HDAC2 mRNA was 9.78±2.92 in mucinous cancer tissues, 9.76±3.03 in endometrioid cancer tissues, and 5.76±3.7 in normal tissues. Although there was a trend towards higher levels of HDAC2 mRNA in the mucinous and endometrioid cancer tissues, there were no statistically significant difference compared with the normal tissues (p=0.078 and p=0.109, respectively).
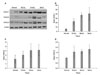
Western blot analysis showed that most of cancer tissues had elevated levels of expression of HDAC1, HDAC2 and HDAC3, in comparison to normal ovarian specimens. Increased expression of HDAC1, HDAC2, and HDAC3 proteins was detected in 94% (17 of 18), 72% (13 of 18) and 83% (15 of 18) of cancer tissue samples compared to normal ovarian tissue samples. As shown in Fig. 2, the relative densities of HDAC1 protein and HDAC3 protein in serous, mucinous and endometrioid cancer tissues were all significantly higher than those in the normal tissues (p<0.05). The relative densities of HDAC2 protein in serous and mucinous cancer tissues were also significantly higher than those in the normal tissues, respectively (p<0.05). The relative density of HDAC2 protein was 3.02±0.94 in endometrioid tissues, and 2.06±0.9 in normal tissues. Although the mean level of HDAC2 protein expression was 1.4-fold higher in the endometrioid cancer tissues than in the normal tissues, there was no statistically significant difference.
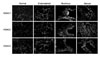
Immunohistochemical staining was performed to determine the expression of HDACs1-3. In Fig. 3, we observed moderate to strong staining of HDACs1, 2 and 3 in most of the tumor samples, while HDAC2 in one endometrioid tumor tissue showed weak expression. Normal ovarian tissues showed weak staining of HDACs1, 2 and 3. These results are consistent with the data obtained by Western blot and PCR.
DISCUSSION
Despite extensive investigation of the biological functions of HDACs, only a few studies have reported expression of HDACs in specific tumors. Osada et al.14 reported frequent overexpression (>2-fold) of HDAC1 and HDAC2 in non-small cell lung carcinomas compared with cells from adjacent normal tissues, and Zhu et al.15 showed that HDAC2 was overexpressed in human colon cancer compared with matched normal samples. In our study of human ovarian cancer tissues, HDACs1-3 were elevated in ovarian cancer at both transcriptional and translational levels.
HDACs are usually subunits of multiprotein complexes, for example the transcriptional corepressors mSin3, N-CoR, NuRD and SMRT, which recruit HDACs to transcription factors.16 HDAC1 and HDAC2 exist together in multiprotein complexes, and many transcription factors target HDAC1 and HDAC2 to specific promoters to repress transcription.17 HDAC3 is a component of the NCoR-SMRT co-repressor complex, which is distinct from co-repressor complexes that typically contain HDAC1 and-2.18 Through these corepressors, aberrant transcriptional repression may lead to oncogenic transformation.
Changes in HDAC expression levels could be involved in the underlying mechanisms of abnormal cellular proliferation.15,19,20 Kawai et al.20 showed that HDAC1 affects breast cancer progression by promoting cell proliferation in association with a reduction in both ER-a protein expression and transcriptional activity. Silencing of HDAC3 expression in colon cell lines resulted in growth inhibition, a decrease in cell survival, and increased apoptosis, similar effects were observed for HDAC1 and HDAC2.18 A study by Terao et al.21 indicated that sodium butyrate (HDAC inhibitor) had a significant growth-suppressing effect on human endometrial and ovarian carcinoma cells, irrespective of their p53 status. Takai et al.8 demonstrated that HDAC inhibitors exhibited antiproliferative activity and potently induced apoptosis in human ovarian carcinoma cells. These findings suggest that HDAC inhibitors may be particularly effective in the treatment of ovarian carcinoma.
In conclusion, the present study clearly demonstrated that HDACs1-3 are overexpressed in ovarian cancer and probably plays a significant role in ovarian carcinogenesis. Our results also indicate that a new HDAC inhibitor with less cellular toxicity may have potential as an anticancer agent. Further studies using larger numbers of samples and covering other HDACs are needed.
 XML Download