Abstract
Background
Blood cultures are essential in diagnosing and treating sepsis. There are several factors that affect the diagnostic yield of blood cultures such as the number of blood sampling episodes, the incubation period, the type and volume of culture media, and the amount of blood drawn. This study aimed to elucidate whether monitoring the volume of blood drawn with an educational intervention could affect the diagnostic quality of blood cultures.
Methods
We implemented quality monitoring for the blood volume drawn during blood culture testing for adults in an emergency room. We instructed the nurses in the emergency room to draw the optimal amount of blood and to reduce the number of blood culture sets from three to two. We analyzed and compared the amount of blood drawn, the rate of positive blood cultures, the contamination rate, and time to positivity (TTP) between 908 patients pre-in-tervention and 921 patients post-intervention.
Results
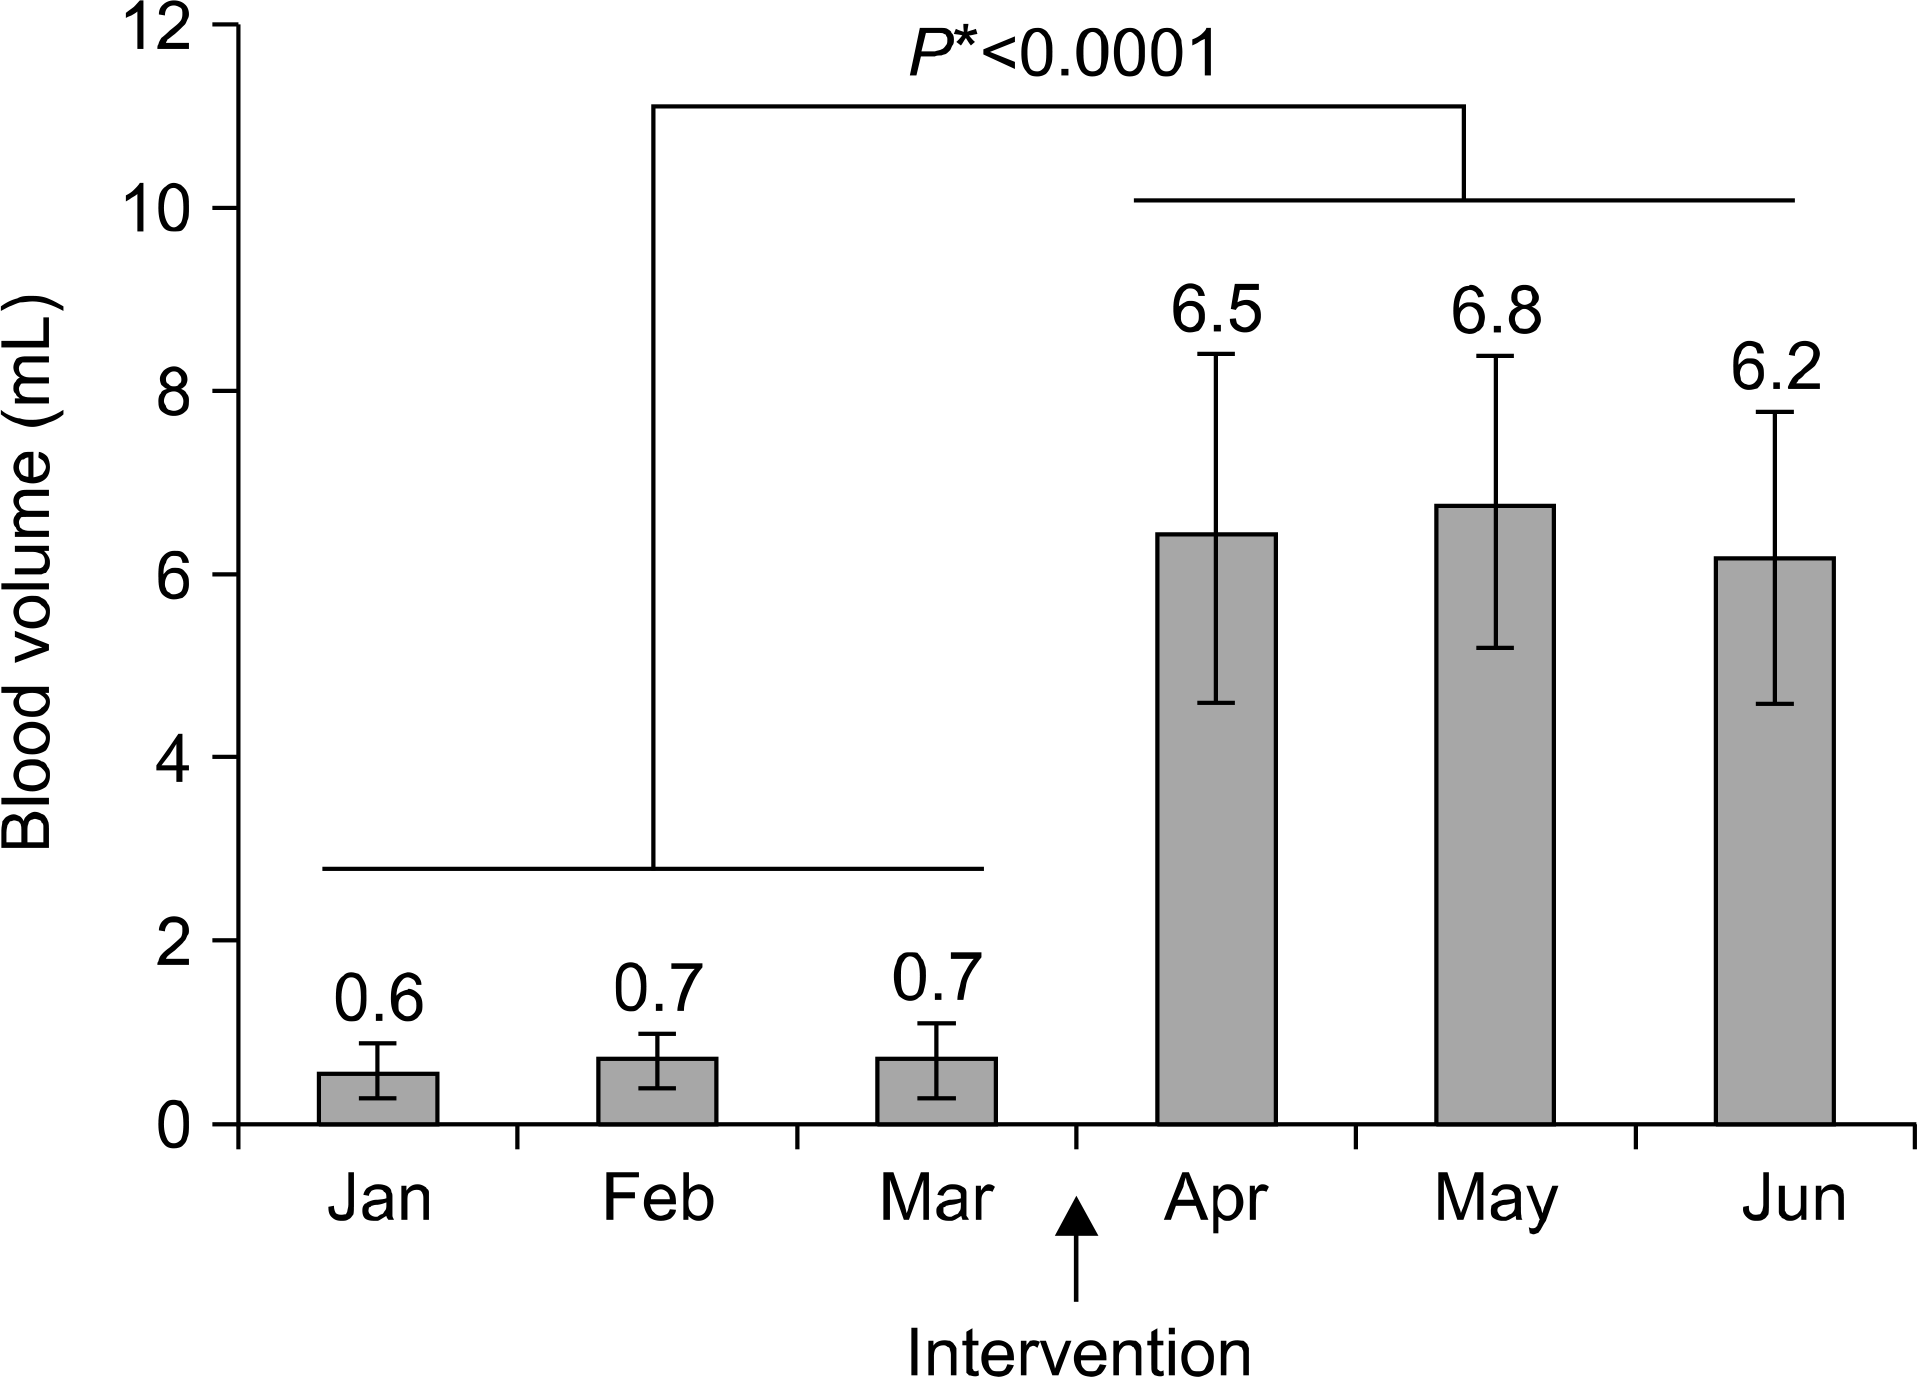
The amount of blood drawn increased from 0.7±0.3 mL per bottle (pre-intervention) to 6.5±1.7 mL per bottle (post-intervention) (P<0.0001). The rate of positive blood culture post-intervention (12.14%) was higher than that pre-intervention (6.65%) (P<0.0001). The contamination rate post-intervention (1.82%) was also significantly greater than that pre-intervention (0.60%) (P<0.0001). Except for anaerobes, there was no significant difference in the distribution of microorganisms between the pre- and post-intervention periods. The TTP for anaerobe bottles post-inter-vention was significantly shorter than that of pre-in-tervention (16.1±16.3 versus 18.6±18.3 h).
Go to : 
References
1. Dellinger RP, Levy MM, Rhodes A, Annane D, Gerlach H, Opal SM, et al. Surviving sepsis campaign: international guidelines for management of severe sepsis and septic shock, 2012. Intensive Care Med. 2013; 39:165–228.

2. Gonsalves WI, Cornish N, Moore M, Chen A, Varman M. Effects of volume and site of blood draw on blood culture results. J Clin Microbiol. 2009; 47:3482–5.

3. Garcia RA, Spitzer ED, Beaudry J, Beck C, Diblasi R, Gilleeny-Blabac M, et al. Multidisciplinary team review of best practices for collection and handling of blood cultures to determine effective interventions for increasing the yield of true-positive bacteremias, reducing contamination, and eliminating false-positive central line-associated bloodstream infections. Am J Infect Control. 2015; 43:1222–37.
4. Lamy B, Dargère S, Arendrup MC, Parienti JJ, Tattevin P. How to optimize the use of blood cultures for the diagnosis of bloodstream infections? A state-of-the art. Front Microbiol. 2016; 7:697.

5. Patel R, Vetter EA, Harmsen WS, Schleck CD, Fadel HJ, Cockerill FR 3rd. Optimized pathogen detection with 30-compared to 20-milliliter blood culture draws. J Clin Microbiol. 2011; 49:4047–51.
6. Mermel LA and Maki DG. Detection of bacteremia in adults: consequences of culturing an inadequate volume of blood. Ann Intern Med. 1993; 119:270–2.

7. Chang J, Park JS, Park S, Choi B, Yoon NS, Sung H, et al. Impact of monitoring blood volume in the BD BACTEC TM FX blood culture system: virtual volume versus actual volume. Diagn Microbiol Infect Dis. 2015; 81:89–93.
8. CLSI. Principles and procedures for blood cultures; approved guideline. CLSI document M47-A. Wayne, PA: Clinical and Laboratory Standards Institute;2007.
9. Shin JH, Song SA, Kim MN, Lee NY, Kim EC, Kim S, et al. Comprehensive analysis of blood culture performed at nine university hospitals in Korea. Korean J Lab Med. 2011; 31:101–6.

10. Bang HI, Lim HM, Jang EY, Park ES, Lee EJ, Kim TH, et al. Activities of quality improvement for blood culture at a university hospital. Ann Clin Microbiol. 2015; 18:88–93.

11. van Ingen J, Hilt N, Bosboom R. Education of phlebotomy teams improves blood volume in blood culture bottles. J Clin Microbiol. 2013; 51:1020–1.

12. Washington JA 2nd. Blood cultures: principles and techniques. Mayo Clin Proc. 1975; 50:91–8.
13. Weinstein MP, Murphy JR, Reller LB, Lichtenstein KA. The clinical significance of positive blood cultures: a comprehensive analysis of 500 episodes of bacteremia and fungemia in adults. II. Clinical observations, with special reference to factors influencing prognosis. Rev Infect Dis. 1983; 5:54–70.

14. Cockerill FR 3rd, Wilson JW, Vetter EA, Goodman KM, Torgerson CA, Harmsen WS, et al. Optimal testing parameters for blood cultures. Clin Infect Dis. 2004; 38:1724–30.

15. Bekeris LG, Tworek JA, Walsh MK, Valenstein PN. Trends in blood culture contamination: a college of American pathologists Q-Tracks study of 356 institutions. Arch Pathol Lab Med. 2005; 129:1222–5.

Go to : 
 | Fig. 1.Blood volumes in aerobic bottles submitted for blood culture during pre- and post-intervention periods. Error bars represent the standard deviation. *Comparison between pre- and post-intervention. |
Table 1.
Analysis of the blood culture volumes submitted from each department prior to intervention (January-March 2016)
Table 2.
Comparison of the true positive rate and contamination rate in bottles submitted for blood culture pre- and post-intervention
Table 3.
Comparison of the time to positivity (TTP) values between pre- and post-intervention
Table 4.
Distribution of microorganisms isolated from blood culture-positive patients pre- and post-intervention


 PDF
PDF ePub
ePub Citation
 Print
Print


 XML Download