초록
Background
Blood culture remains the definitive method for diagnosing bacteremia and fungemia. In this study, we investigated the incidence of bacterial and fungal infections along with the trends in antimicrobial susceptibility in blood cultures collected from 2008 to 2013.
Methods
We performed a retrospective analysis of blood cultures performed at Kyung Hee University Hospital, Seoul, South Korea, between 2008 and 2013 to determine the bacterial and fungal species isolated, and their antimicrobial susceptibilities. Additional analyses were performed comparing these results to that of a prior study examining blood cultures collected from 2003-2007.
Results
Of the 102,257 specimens collected, 8,452 (8.3%) were culture positive, with Staphylococcus ep-idermidis being the most common species isolated (17.3%), followed by Escherichia coli (16.9%), Staphylococcus aureus (8.1%), and Klebsiella pneumoniae (6.5%). Fungal species accounted for 3.7% of all isolates. Methicillin resistance was seen in 54.3% of S. aureus isolates. The frequencies of extended-spectrum β-lactamase (ESBL)-producing E. coli and K. pneumoniae were 13.1% and 10.3%; imipenem resistance was seen in 19.5% of Pseudomonas aeruginosa isolates.
Conclusion
Although the number of blood specimens analyzed increased steadily over the course of this study, the rate of positive blood cultures declined. The most common microorganisms isolated were co-agulase-negative staphylococci, E. coli, S. aureus, and K. pneumoniae, consistent with our prior analysis. This analysis of blood culture isolate frequencies and antibiotic susceptibilities can be used to inform antibiotic therapy decisions.
Go to : 
REFERENCES
1.Angus DC., Linde-Zwirble WT., Lidicker J., Clermont G., Carcillo J., Pinsky MR. Epidemiology of severe sepsis in the United States: analysis of incidence, outcome, and associated costs of care. Crit Care Med. 2001. 29:1303–10.

2.Kim SY., Lim G., Kim MJ., Suh JT., Lee HJ. Trends in five-year blood cultures of patients at a university hospital (2003~2007). Korean J Clin Microbiol. 2009. 12:163–8.

3.CLSI. Performance standards for antimicrobial susceptibility testing: twenty third informational supplement. CLSI document M100-S23. Wayne, PA: Clinical and Laboratory Standard Institute. 2013.
4.Koh EM., Lee SG., Kim CK., Kim M., Yong D., Lee K, et al. Microorganisms isolated from blood cultures and their antimicrobial susceptibility patterns at a university hospital during 1994- 2003. Korean J Lab Med. 2007. 27:265–75.
5.Kang SH., Kim YR. Characteristics of microorganisms isolated from blood cultures at a university hospital located in an island region during 2003-2007. Korean J Clin Microbiol. 2008. 11:11–7.

6.Ahn GY., Jang SJ., Lee SH., Jeong OY., Chaulagain BP., Moon DS, et al. Trends of the species and antimicrobial susceptibility of microorganisms isolated from blood cultures of patients. Korean J Clin Microbiol. 2006. 9:42–50.
7.Kim HJ., Lee NY., Kim S., Shin JH., Kim MN., Kim EC, et al. Characteristics of microorganisms isolated from blood cultures at nine university hospitals in Korea during 2009. Korean J Clin Microbiol. 2011. 14:48–54.

8.Kim SD., McDonald LC., Jarvis WR., McAllister SK., Jerris R., Carson LA, et al. Determining the significance of coagulase- negative staphylococci isolated from blood cultures at a commu-nity hospital: a role for species and strain identification. Infect Control Hosp Epidemiol. 2000. 21:213–7.
9.Abdul Rahman Z., Hamzah SH., Hassan SA., Osman S., Md Noor SS. The significance of coagulase-negative staphylococci bacteremia
.
Go to : 
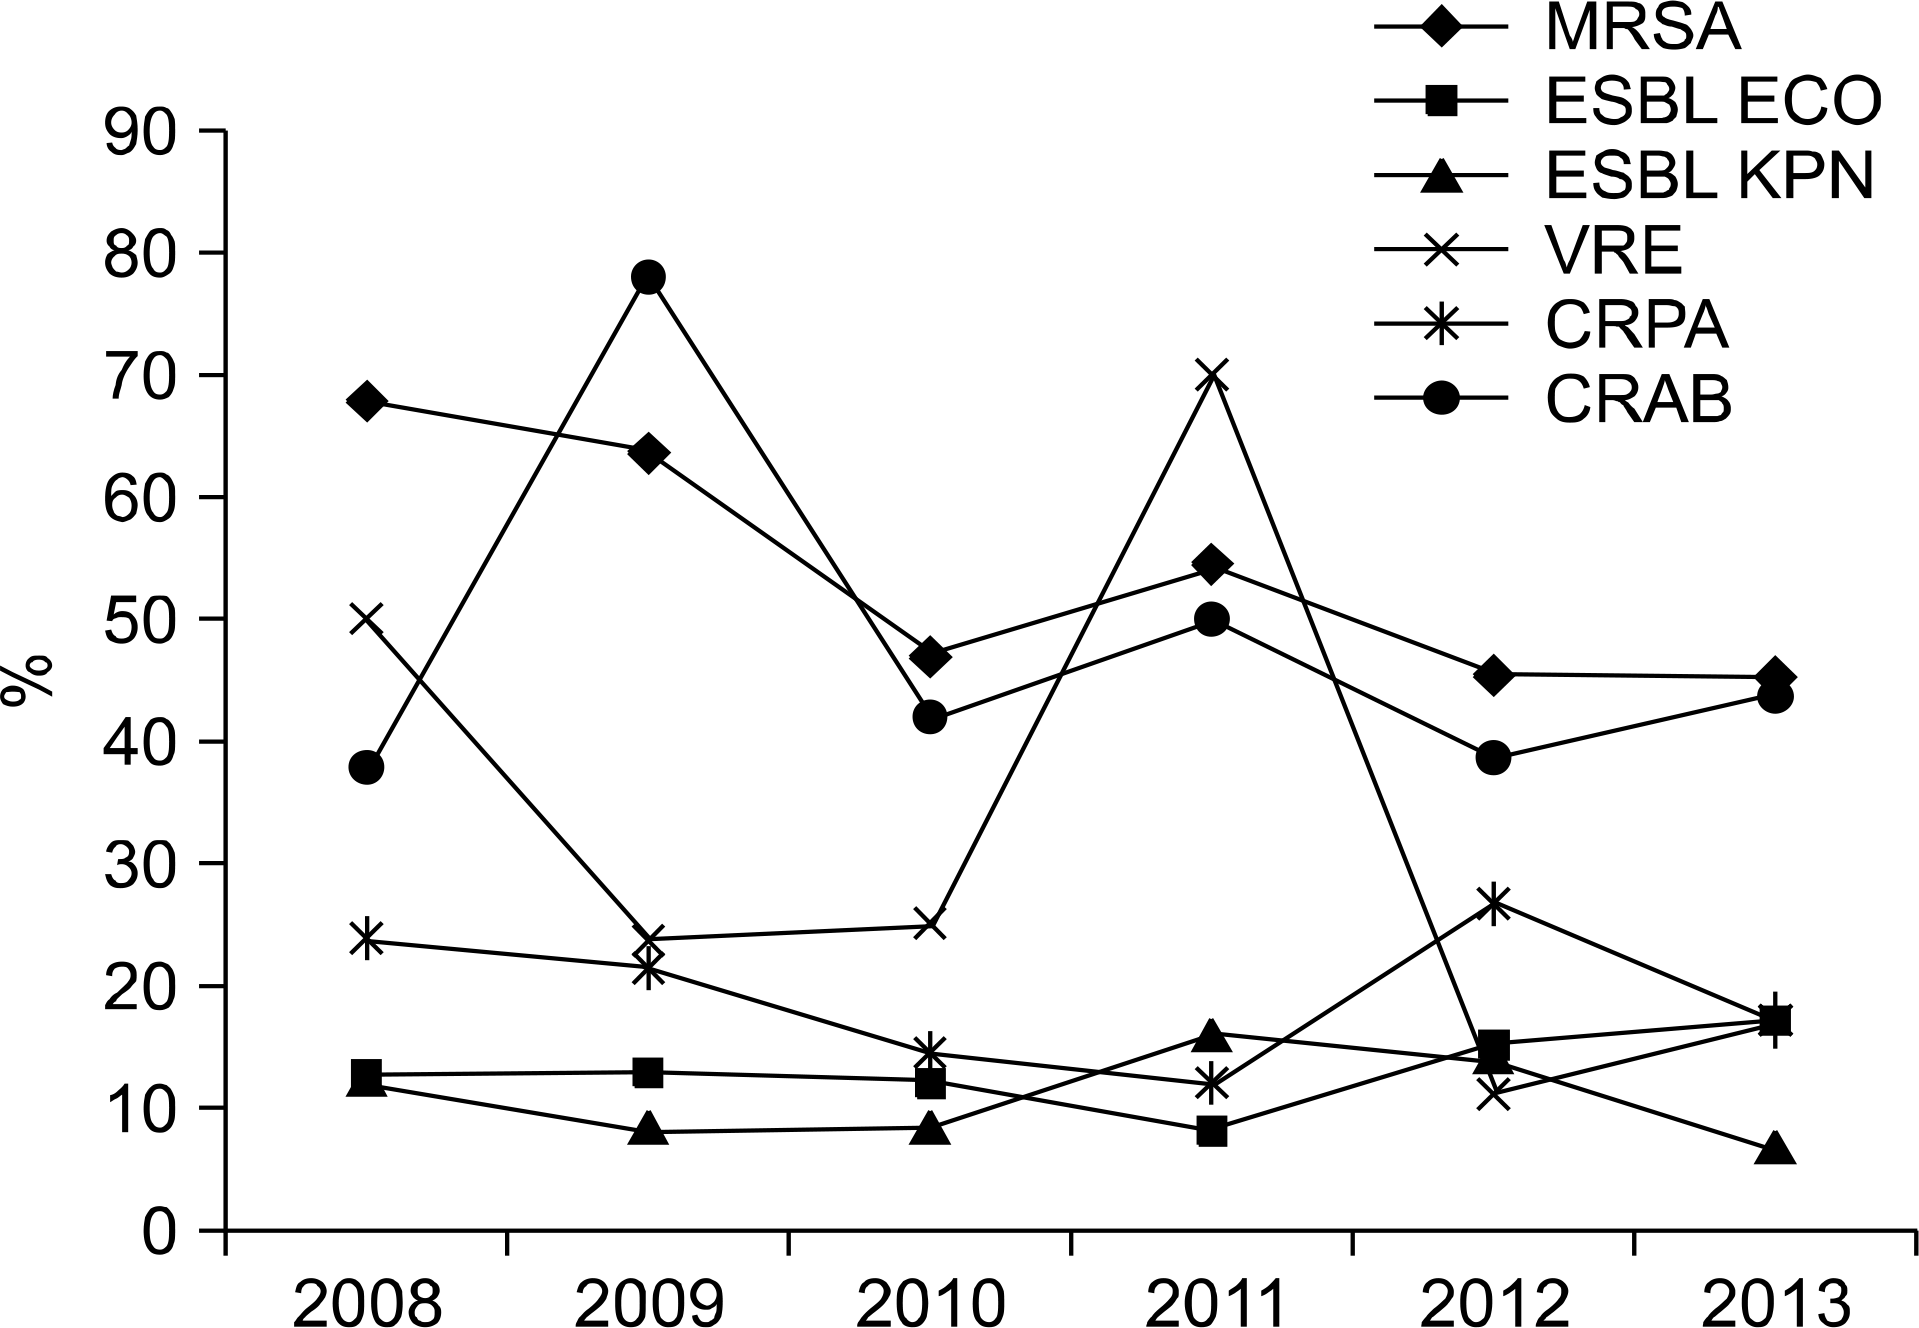
 | Fig. 1.Trends in antimicrobial resistance rates in S. aureus, E. coli, K. pneumoniae, E. faecium, P. aeruginosa and A. baumannii. Abbre-viations: MRSA, Methicillin-resistant S. aureus; ESBL ECO, Extended-spectrum β-lactamase-producing E. coli; ESBL KPN, Extended-spec-trum β-lactamase-producing K. pneumoniae; VRE, Vancomycin-re-sistant E. faecium; CRPA, Carbapenem-resistant P. aeruginosa; CRAB, Carbapenem-resistant A. baumannii. |
Table 1.
Classes of bacteria and fungi isolated by year
Table 2.
Significant bacterial isolates by year
Table 3.
Fungal isolates trend
Table 4.
Trend of vancomycin and ampicillin resistance in E. faecalis and E. faecium


 PDF
PDF ePub
ePub Citation
 Print
Print


 XML Download