

 PDF
PDF ePub
ePub Citation
 Print
Print


INTRODUCTION
As a result of biannually held endoscopy screening, the annual incidence of diagnosed cases of early gastric cancer (EGC) has increased, in Korea [12]. A recent survey revealed that the incidence of EGC had reached 60% [3]. For the treatment of EGC, some alternative treatment modalities, such as function-preserving gastrectomy of the endoscopic submucosal dissection (ESD), have been introduced and adopted instead of the standard radical gastrectomy [45].
Although the development of pre-operative diagnostic modalities has made ESD possible, definite surgical treatments are required for tumors (15% to 28% of cases) which are upgraded from their pre-ESD diagnosis [6]. Along with the depth of tumor invasion, the pre-operative clinical nodal status is a crucial factor in deciding a treatment strategy for EGC, due to the risk of lymph node (LN) metastases in 3.0%–4.9% of the mucosal cancers and in 23%–25% of the submucosal invasive cancers [78].
There are several pre-operative modalities to estimate patient LN status. Among them, multi-detector computed tomography (MDCT) is most widely used for evaluating clinical N-stage with LN size and shape [910]. To increase the accuracy for estimating the presence of LN metastasis, various studies have suggested different size criteria [1112]. Ahn et al. [9] set the criteria with the short-axis (SA) >8 mm, with a 95.2% predictive value and an 87.3% overall accuracy rate. A different study has defined size a criterion of >15 mm with a 98.6% positive predictive value and a 99.8% specificity [11]. However, definite size criteria have not been established. In general, as size cutoffs increase, specificity increases, though sensitivity decreases. Thus, it is challenging to establish optimal size criteria for deciding pre-operative LN status. Furthermore, although studies evaluating size criteria for deciding the status of LN metastasis, are widely performed, no study has been performed to evaluate the real length of the long-axis (LA) and SA of whole-retrieved LNs, regardless of metastasis status. This kind of baseline study can help further our knowledge about LNs and facilitate future LN-related studies.
For this reason, we planned to examine the LA and SA of whole-retrieved LNs and evaluate the distribution pattern of whole LNs in pathologically LN-positive (LNP) patients with EGC, and in matched LN-negative (LNN) patients. Furthermore, we aimed to observe whether the maximum-sized LN is the metastatic LN (MLN) because although studies have focused on examining this aspect, no study has revealed whether the maximum-sized LN was indeed the MLN.
MATERIALS AND METHODS
During the period from March 2009 to May 2015, 392 patients with pathologically confirmed EGC underwent gastric cancer surgery at the Yeouido St. Mary's Hospital in Korea. Among them, 38 patients had LN metastasis. Two patients were excluded from pathologic slide review because pathology slides were unavailable due to damage, in 1 patient, and the other patient was diagnosed with LN metastasis 18 months after ESD. The rest of the 36 patients were categorized into a LNP group, and 36 LNN patients were matched using propensity scores, for tumor depth, differentiation, and size. Pathology slides of 72 patients were reviewed and the size of all LNs were measured along their LA and SA manually. Patterns for LN size were evaluated and compared between MLNs and non-metastatic LNs (nMLNs). In addition, size distribution according to the LA and SA was analyzed to evaluate the difference in shapes between MLNs and nMLNs. Among LNP patients, whether the largest LN was an MLN or an nMLN was also evaluated. Finally, LN size was compared between groups according to anatomic location and the presence of metastasis. This study was approved by the institutional review board of Yeouido St. Mary’s Hospital (IRB number: SC15RISI0089).
Pathologic slide review
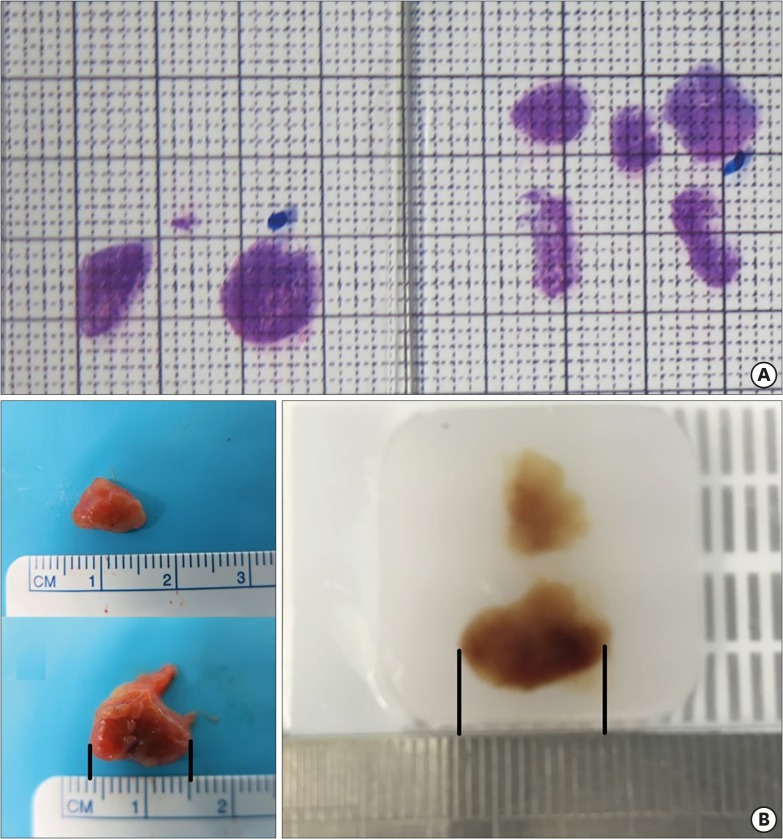
Photographs of all the pathologic slides, including LNs, were captured on a measurable sheet (Fig. 1A). After magnifying each LN photograph, the size of the LA and SA was measured. There was a minor size discrepancy between fresh LNs and formalin-embedded LNs (Fig. 1B). The LA was measured along the longest diameter of each of the LNs and SA was measured in the direction perpendicular to the LA.
RESULTS
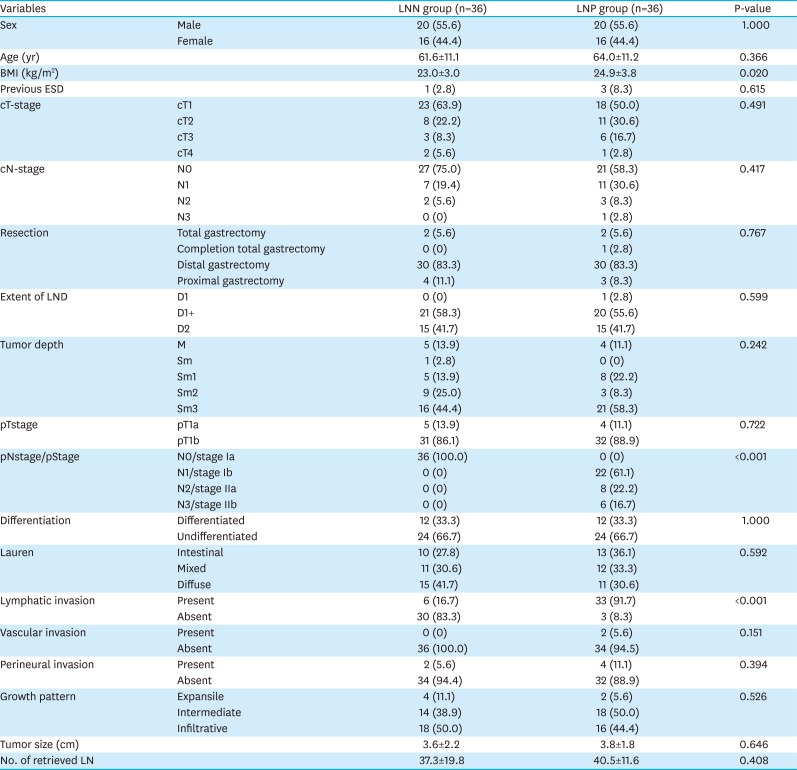
The clinicopathologic results indicated no difference in sex, age, clinical T- and N-stage, tumor differentiation, and size between the 2 groups. Surgical results indicated no difference in the type of approach, extent of gastric resection, and LN dissection. However, there were more lymphatic invasion cases observed in the LNP group than in the LNN group (Table 1).
Table 1
Clinicopathologic characteristic of all matched patients
Continuous variables were described as mean±standard deviation and nominal variables were described as numbers (%).
LNN = lymph node-negative; LNP = lymph node-positive; BMI = body mass index; ESD = endoscopic submucosal dissection; LND = lymph node dissection; M = mucosa; Sm = submucosa; LN = lymph node.
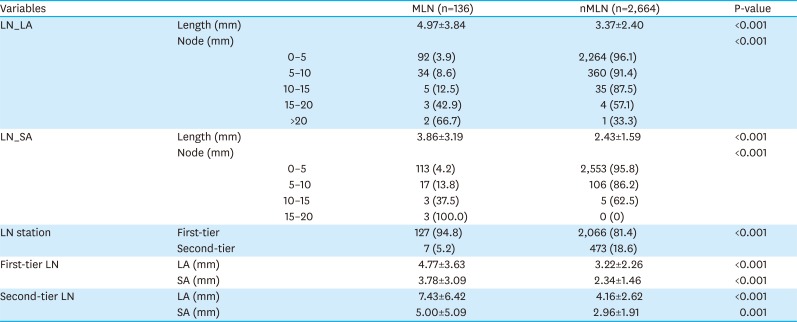
Pathologic slide review was carried out for 72 patients (LNP 36, LNN 36). Average retrieved LNs were 37.3±19.8 and 40.5±11.6 in LNN and LNP groups, respectively. The number of evaluated LNs was 2,800, including 136 MLNs and 2,664 nMLNs. The mean length of the MLNs was 4.97±3.84 mm along the LA and 3.86±3.19 mm along the SA. Length of the MLNs was significantly longer both along the LA and along the SA than of the nMLNs (Table 2). The mean of nMLN size was 3.37±2.40 mm along the LA and 2.43±1.59 mm along the SA. The mean size difference was 1.6 mm along the LA and 1.43 mm along the SA (Table 2).
Table 2
LN size of LA and SA according to various characteristics
Proportion of MLN according to size criteria
LNs were categorized by 5 mm-length cutoffs according to both the LA and SA (Table 2). As the length of the LA or SA increased, the proportion of MLN increased gradually. While number of MLNs composed 3.9% in LA and 4.2% in SA among all 0–5 mm-sized LNs, 2 of 3 LNs longer than 20 mm along the LA, and all the 3 LNs longer than 15 mm along the SA, were MLNs.
Size correlation of LA and SA according to the presence of metastasis
A histogram of LN size along the LA and SA showing size distribution data is depicted in Fig. 2. The LNs <5 mm group was the largest, followed by the 5–10 mm LNs group, in both MLNs and nMLNs. Among all MLNs, there were 7.4% (10/136) and 4.4% (6/136) of LNs that were larger than 10 mm according to the LA and SA, respectively.
Fig. 2
Distribution of LN size according to (A) LA of nMLNs, (B) LA of MLNs, (C) SA of nMLNs (D) SA of MLNs.
LN = lymph node; LA = long-axis; nMLN = non-metastatic lymph node; MLN = metastatic lymph node; SA = short-axis.
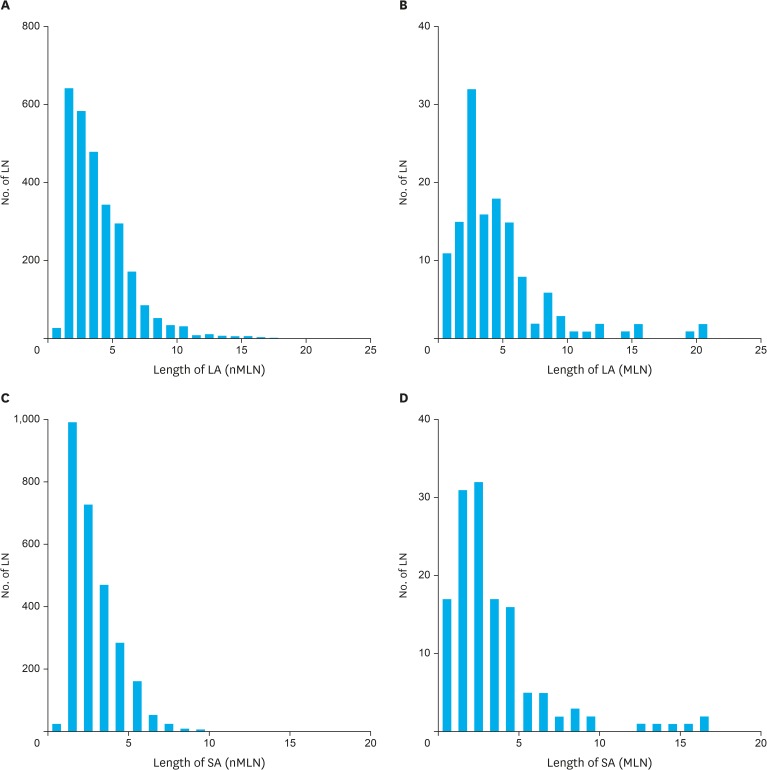
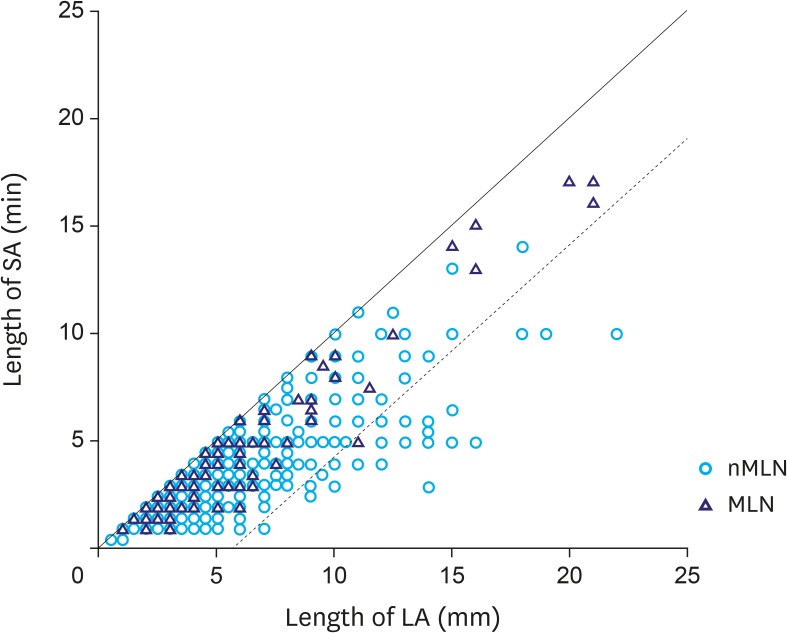
Fig. 3 shows the size correlation of all LNs along the LA and SA. In the size distribution graph, except one LN, most MLNs were distributed in the area where the size difference between the LA and SA was less than 5 mm.
Correlation of maximum size LNs and MLN
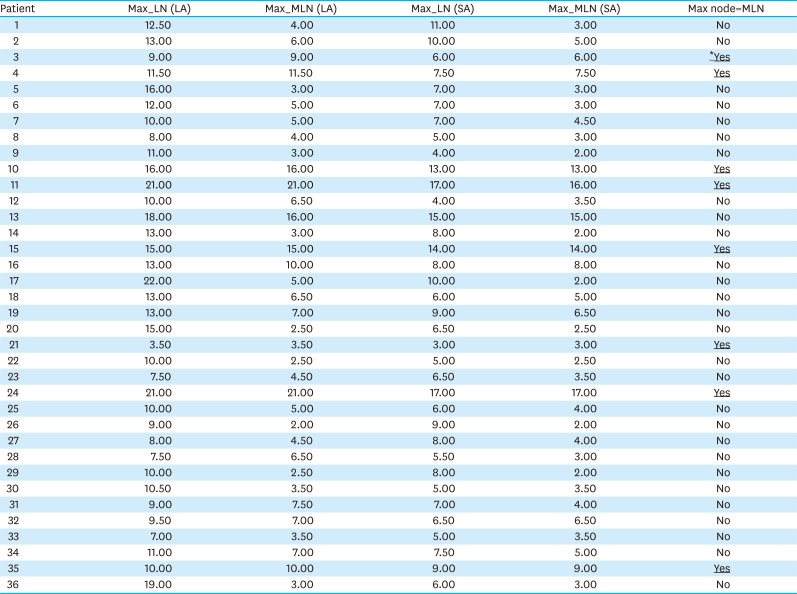
Among 36 patients in the LNP group, the largest LN was the MLN in 8 (22.2%) patients. The other 28 patients had maximum-sized MLNs shorter than the maximum-sized LNs among whole-retrieved LNs in each patient (Table 3).
Table 3
Status of maximum-sized LN in each LNP patient
Size difference between first- and second-tier LNs
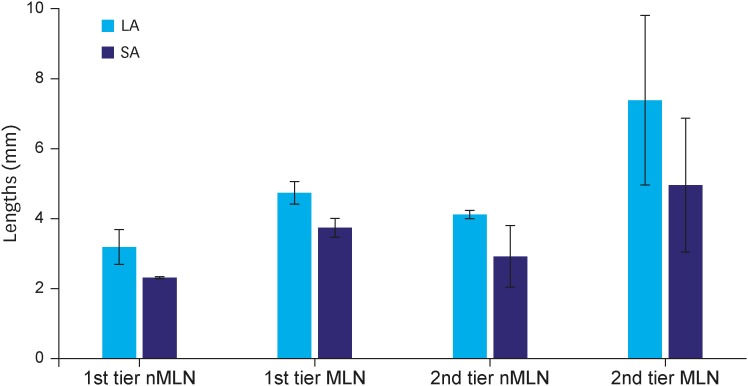
Whole LNs were divided into first- and second-tier LNs, based on size. Second-tier LNs had a longer diameter along both the LA and SA than did first-tier LNs. In addition, the mean length of MLNs was significantly longer than that of nMLNs in the LN area. Size difference was much higher in the second-tier group (Fig. 4). The mean difference between the MLNs in the first-tier group and nMLNs in the second-tier group was only 0.61 mm.
DISCUSSION
Pre-operative staging is mainly dependent on the size criteria as measured by MDCT [91013]. Several previous studies have attempted to elucidate the optimal size criteria for deciding whether specific LNs are metastatic. However, no study has reported the actual size of all retrieved LNs. Information about the actual size of MLNs and nMLNs may be crucial for LN-related studies.
In the present study, the size of MLNs was significantly larger than that of nMLNs, and as size of LNs increased, the proportion of MLNs among the whole LN within the same size criteria increased. When the size of the LN increased, the proportion of MLNs increased. In addition, LNs longer than 15 mm along the LA and SA showed a metastatic rate of 50% and 100%, respectively. However, the actual size difference between MLNs and nMLNs was only 1 mm, which may not have had clinical significance, during pre-operative evaluation or intra-operative estimation. Moreover, only 7.1% and 4.7% of LNs were longer than 10 mm along the LA and SA, respectively.
Various studies have reported diverse diagnostic criteria for estimating LN metastasis in gastric cancer patients, with pre-operative imaging modalities. The SA was more frequently used than the LA. Ahn et al. [9] reported a relatively high predictive value (95.2%) and overall accuracy (87.3%) with the criteria of: SA longer than 8 mm, rounded shape, and presence of necrosis. Yan et al. [12] also used SA and used different criteria for perigastric and extraperigastric LNs. However, accuracy for estimating the MLN size was only 49.2%. A different study has suggested a size criterion of 15 mm. [11] A larger size cutoff value increases the positive predictive value and specificity, but inevitably leads to decreased sensitivity and negative predictive value. Two-dimensional values have also been evaluated for estimating LNM, but have failed to present definite size criteria for estimating LNM [10]. For this reason, a previous study for pre-operatively predicting LNM used tumor characteristics rather than pre-operative MDCT findings for LN size evaluation [14]. Until now, no definite criteria have been established.
This study presents fundamental information. Previously, a Japanese study investigated the size of 3,142 positive LNs from 402 LNP patients [15]. In this study, authors mentioned the possibility of cancer metastasis in small-sized LNs, which is in line with that proposed in our study. However, all stages were included and only the maximum size was measured in the above-mentioned study. In the current study, we included only EGC patients and performed a comparison with the LNN group. Moreover, 2-dimensional size measurements provide information about LN shape. Fig. 3 shows the size distribution of the MLNs and nMLNs along the LA and SA. The circle and the triangle visible between the 2 lines in the figure refer to LNs with an LA-SA difference of no more than 5 mm. There is only one MLN that falls out of the above-mentioned area. In real clinical practice, LNs of ≤5 mm length can be rarely detected pre-operatively. For this reason, we performed subgroup analysis of LNs >5 mm. Proportion of LNs with a LA-SA difference of >5 mm was 43/400 (8.0%) among nMLNs, and 1/44 (2.3%) among MLNs. From our observations, it can be concluded that the shape of MLNs appears to be more rounded than that of nMLNs, which means that more elongated-shaped LNs are less likely to be MLNs.
This study illuminates another important aspect. During pre-operative evaluation, the maximum-sized LN is usually the structure of interest, since pre-operative LN size evaluation is difficult to define for all the LNs. However, among LNP patients, only 8 out of 36 patients had a maximum-sized LN as the MLN. Thus, estimation of clinical node status with maximum-sized LN would be erroneous and lead to sub-optimal disease treatment.
The size of the LNs in the second-tier group was larger than that in the first-tier group. Most MLNs in the first-tier group were shorter than 10 mm and MLNs in the second-tier group were significantly longer than those in the first-tier group. Considering that most MLNs were included in the first-tier area, pre-operative size criteria may be unreliable for estimating LN metastasis. The findings of the current study regarding LN size and shape may be summarized as follows: 1) the average size of MLNs was larger than that of nMLNs by a clinically non-significant difference in length; 2) majority of MLNs were shorter than 10 mm; and 3) even in the LNP group, only a small portion of maximum-sized LNs were MLNs. These findings show that pre-operative MDCT evaluation for nodal status is reliable only if definitive large LNs are detected.
The main limitation is thatthis study is retrospective in nature. For this reason, we had to evaluate the size of LNs via hematoxylin and eosin (H&E)-stained pathologic slides rather than actual LNs. This fact poses 2 problems. We were able to obtain only 2-dimensional measurements rather than 3-dimensional measurements. Consequently, it was not possible to accurately determine the LA and SA of the actual LNs. However, we attempted to make pathologic slides reflective of the widest cut section of each LN. For this reason, our measurements may closely represent actual LN size. Additionally, there can be a possible size discrepancy of up to 10% between fresh specimens and paraffin-embedded LNs [16]. Although we could not accurately estimate difference in size compared to that of whole LNs, there was about a 5% (11.0 → 10.5 mm) decrease observed in the study (Fig. 1B). Those discrepancies need to be considered.
It is not possible to propose a conclusive estimation protocol for LN metastasis, based on this study. However, to the best of our knowledge, this is the first study to evaluate the size of almost all retrieved LNs in EGC patients, and present fundamental information for LN-related gastric cancer studies.
In conclusion, there is a definite statistical size-discrepancy between MLNs and nMLNs. However, estimating the LN size with pre-operative MDCT findings has limitations, because most MLNs are shorter than 10 mm and only a small proportion of the LNP group had the largest LN as a MLN. Moreover, it would be more reliable to estimate the LN size based on differentiation of the primary tumor and a combination of size and shape of LNs.
 XML Download