

 PDF
PDF ePub
ePub Citation
 Print
Print


INTRODUCTION
In 2012, gastric cancer (GC) was the fourth and fifth most common type of cancer and the third and fourth leading cause of male and female deaths, respectively, worldwide [1]. Although the incidence of GC and mortality associated with this disease have gradually decreased in Japan and Korea, it still remains the second leading cause of death in Korea [2]. The mainstream treatment for GC is surgery in combination with adjuvant chemotherapy, and it is a minimal the effect of targeted agent and radiotherapy.
Enolase is a cytoplasmic enzyme that catalyzes the conversion of 2-phosphoglycerate to phosphoenolpyruvate in the glycolytic pathway. Mammalian enolase exists as three isoforms: alpha, beta, and gamma, all of which differ in their tissue-specific expression patterns [3]. The alpha-, which is the non-neuronal enolase, is expressed in all tissue types; the beta-, which is the muscle-specific enolase, is expressed in adult skeletal muscle; and the gamma-, which is the neuron-specific enolase (NSE), is expressed in nerves and cells of neuronal origin [45]. NSE is a well-established tumor marker for small cell lung cancer [6]. However, its level as a prognostic marker in GC has not been reported.
The aim of this study was to investigate whether NSE overexpression (NSE-OE) can serve as a prognostic factor in patients with GC.
MATERIALS AND METHODS
Stomach tissue samples for tissue microarray (TMA)
Surgically resected GC tissue specimens were obtained from 327 patients who underwent gastrectomy between January 1, 2004 and December 31, 2007. Medical and pathological reports were reviewed to determine clinicopathological parameters such as age, sex, histological subtype, presence of lymphatic invasion, invasion depth, presence of lymph node (LN) or distant metastasis, pathological stage, and recurrence. Clinical outcome was evaluated between the date of the surgery and the time of death, or until January 31, 2015. Cases lost to follow-up and non-GC-related deaths were regarded as censored data in the survival analysis. The study was approved by the Institutional Review Board of Gyeongsang National University Hospital (GNUHIRB 2009-54).
TMA analysis
Core tissue biopsy specimens (2 mm in diameter) were obtained from individual formalin-fixed and paraffin-embedded archived tissues (donor blocks). These were arranged in new recipient paraffin blocks using a trephine apparatus (Quick-RAY™; Unitma Co., Seoul, Korea). One tissue core from the area close to the invasive front was analyzed. TMA blocks were constructed for all 327 cases.
Immunohistochemistry (IHC)
IHC staining was performed using 4-μm thick tissue sections. Briefly, tissue sections were deparaffinized and rehydrated. The slides were then incubated in 3% H2O2 for 10 minutes to reduce nonspecific background staining due to endogenous peroxidase. For epitope retrieval, the specimens were heated for 20 minutes in 10 mM citrate buffer (pH 6.0) in a microwave oven (700 W). Background staining was blocked by incubating the samples in Ultra V Block solution (Lab Vision Corporation, Fremont, CA, USA) for 7 minutes at room temperature. The slides were then incubated for 1 hour at room temperature with a rabbit monoclonal antibody specific NSE (1:250; Abcam, Boston, MA, USA). Antibody binding was detected using the UltraVision LP detection system (Lab Vision Corporation) in accordance with the manufacturer's recommendations. Slides were developed using 3-3′-diaminobenzidine, followed by counterstaining with hematoxylin. Expression of NSE was determined and scored by a pathologist blinded to the clinicopathological data. Cytoplasmic staining was scored as the percentage of NSE-positive cells in the following manner: 1+ (1%–24% NSE-positive cells), 2+ (25%–49% NSE-positive cells), 3+ (50%–74% NSE-positive cells), or 4+ (75%–100% NSE-positive cells) [7]. A score of 0 was considered negative for NSE protein expression, while scores of 1+ to 4+ were considered as NSE-OE.
Western blot analysis
Western blotting was performed to evaluate NSE levels in fresh frozen tumor tissues at each of the tumor, node, and metastasis (TNM) stages I to IV (n=8) among TMA patients. Tissues were lysed in lysis buffer (25 mM Tris-HCl pH 7.6, 150 mM NaCl, 1 mM Na2EDTA, 1% NP-40, 1% sodium deoxycholate, and 1% protease inhibitor cocktail; Sigma-Aldrich, St. Louis, MO, USA), and protein concentrations were measured using the Bio-Rad Protein Assay Kit (Bio-Rad Laboratories, Inc., Hercules, CA, USA). The cell lysates were then separated on a 12% sodium dodecyl sulphate-polyacrylamide gel electrophoresis (SDS-PAGE) gel and transferred to a polyvinylidene difluoride (PVDF) membrane (EMD Millipore, Billerica, MA, USA). The membrane was incubated for 1 hour at room temperature in TBST solution (10 mM Tris-HCl pH 8.0, 150 mM NaCl, and 0.05% Tween 20; Sigma-Aldrich), supplemented with 5% non-fat dry milk and probed overnight at 4°C with appropriate primary antibodies (NSE, 1:10,000; Abcam). Bound antibodies were visualized using a suitable secondary antibody conjugated to horseradish peroxidase, and then with enhanced chemiluminescence reagents (ECL; ThermoFisher Scientific, Rockford, IL, USA). An antibody against glyceraldehyde-3-phosphate dehydrogenase (GAPDH; ThermoFisher Scientific) was used to normalize the quantity of the loaded samples.
Quantification of serum NSE levels
Blood samples were obtained from healthy volunteers (n=15) and patients with stomach cancer (n=33) before the operation by venipuncture, of which clotted at room temperature. The sera were collected following centrifugation and then frozen immediately at −70°C until analysis. Human enolase 2 (ENO2) was measured using commercially available enzyme-linked immunosorbent assay (ELISA) kits (R&D Systems, Minneapolis, MN, USA) according to the manufacturer's instructions. The kit uses a monoclonal antibody specific for ENO2 immobilized on a microplate to bind ENO2 in the standards and samples. Briefly, the microplate was incubated with standards and samples. After 2 hours of incubation, the excess sample or standard was washed out and the polyclonal antibody against ENO2 conjugated with horseradish peroxidase was added. After 2 hours of incubation, the excess antibody was washed out and substrate was added. Following a short incubation, the enzyme reaction was terminated and the absorbance was measured at 450 nm using a microplate reader.
Statistical analysis
Statistical analysis was performed using the PASW Statistics 18.0 software (IBM Corporation, Armonk, NY, USA). Data represents the mean±standard deviation. The significance of the difference was determined by χ2 test, Student's t-test, and binary logistic regression test. The Kaplan-Meier's method was used to analyze patient outcomes and overall survival. Statistical tests were either 2-sided or 1-sided, and P≤0.05 was considered statistically significant.
RESULTS
Patient demographics
The average age of the patients was 62.3 years with a male to female ratio of 1.9:1. The mean tumor size was 4.2±2.6 cm, and the mean number of metastatic LN was 2.3±5.5. The number of tumors for each TNM stage was as follows: stage I, 59.9% (n=185); stage II, 17.5% (n=54); stage III, 22.3% (n=69); stage IV, 0.3% (n=1). With regard to surgery type, a subtotal, total, and proximal gastrectomies were performed in 221, 69, and 19 patients, respectively. The mean period of follow-up was 55.3±23.2 months. Recurrence was observed in 18.4% of the cases (n=57), and cancer-related deaths occurred in 15.2% of the cases (n=47) (Table 1). NSE protein expression was detected by IHC in 309 out of 327 GC tissue specimens. The intensity of NSE expression in the cytoplasm of cancer cells varied, which was rated on the scale of 0–4 as described in the methods section. Out of 309 cases, 24.9% cases (n=77) scored 0, 24.3% (n=75) scored 1+, 21.7% (n=67) scored 2+, 22.3% (n=69) scored 3+, and 6.8% (n=21) scored 4+ for NSE expression (Fig. 1).
Table 1
Clinicopathological data of the patients in the TMA experiment
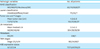
Fig. 1
Immunohistochemical analysis of NSE expression in GC tissues.
NSE = neuron-specific enolase; GC = gastric cancer.
The results of the IHC of TMAs from patients in the NSE-OE group (score 1+ to 4+) and NSE underexpression (NSE-UE) group (score 0) were compared.
Lower rates of tumor invasion, LN metastasis, and cancer recurrence in NSE-OE group
There were no differences between the NSE-OE and NSE-UE groups in terms of histology as per the World Health Organization criteria (P=0.34). In terms of tumor invasion, the NSE-OE group showed a significantly higher rate of early GC (EGC; T1, n=138, 84.7%) than advanced GC (AGC; T2-4, n=94, 64.4%, P<0.01), and the NSE-UE group showed a significantly higher rate of AGC (n=52, 35.6%) in comparison to EGC (n=25, 15.3%). In terms of LN metastasis, the NSE-OE group has a significantly higher incidence of cases with absence of metastasis (LN=0, n=166, 81.4%) when compared to cases presenting metastasis (LN ≥1, n=66, 62.9%, P=0.01). On the contrary, the NSE-UE group displayed a significantly higher rate of metastasis (LN ≥1, n=39, 37.1%) as compared to absence of LN in the group (LN=0, n=38, 18.6%, P=0.01).
In terms of TNM stages, the NSE-OE group showed a significantly higher rate of early cancer stage (stage I, n=155, 83.8%) than the advanced stages (stage II, n=37, 68.5%; stage III–IV, n=40, 57.1%, P<0.01). However, the NSE-UE group showed a significantly higher rate of advanced cancer stages (stage II, n=17, 31.5%; stage III–IV, n=30, 42.9%) as compared to the early stage (stage I, n=155, 83.8%, P<0.01).
The number of cancer-related deaths was lower in the NSE-OE group than in the NSE-UE group. The NSE-OE group showed a significantly higher percentage of survival (n=205, 78.9%) compared to cancer-related deaths in the group (n=27, 57.4%, P<0.01). However, the NSE-UE group showed a significantly higher rate of cancer-related death (n=20, 42.6%) as compared to survival in the group (n=57, 21.8%, P<0.01).
Cancer recurrence was also lower in the NSE-OE group. The NSE-OE group displayed a significantly higher percentage of cases with no recurrence (n=199, 79%) as compared to cases with cancer recurrence (n=33, 57.9%, P<0.01). The contrary was true for the NSE-UE group, which displayed a significantly higher rate of recurrence (n=24, 42.1%) as compared to cases with non-recurrence in the group (n=53, 21%, P<0.01) (Table 2).
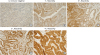
Table 2
Comparison of the clinicopathological features of NSE-UE and NSE-OE groups by IHC of 319 patients with GC
NSE-UE = neuron-specific enolase underexpression; NSE-OE = neuron-specific enolase overexpression; IHC = immunohistochemistry; GC = gastric cancer; WHO = World Health Organization; WD = well-differentiated; MD = moderately differentiated; PD = poorly differentiated; SRC = signet ring cell carcinoma; EGC = early gastric cancer; AGC = advanced gastric cancer; LN = lymph node; TNM = tumor, node, and metastasis; ANOVA = analysis of variance.
*The significance of the differences was determined using the Student's unpaired t-test, but an asterisk indicated the use of the ANOVA test.
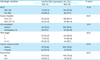
Longer survival times in NSE-OE group
Kaplan-Meier survival analysis was performed to compare the outcomes of patients in the NSE-OE and NSE-UE groups. The NSE-OE group (87.3±1.6 months; 95% confidence interval [CI], 84.1–90.5) had longer cumulative survival times as compared to the NSE-UE group (75.3±3.7 months; 95% CI, 68.0–82.7). The difference between the 2 groups was statistically significant (log-rank test, P<0.01) (Fig. 2).
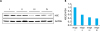
Higher NSE expression in lower TNM stage cancer tissues
Western blotting was performed to evaluate the NSE levels in fresh frozen tumor tissues at each of the TNM stages I to IV (n=8). We found upregulation of NSE expression in fresh GC tissues, with higher expression in lower stages compared to higher stage cancer tissues (Fig. 3).
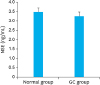
No difference of serum NSE levels between patients with GC and healthy volunteers
We compared the serum NSE levels of normal volunteers and NSE expression in the preoperative sera of patients with GC via ELISA. We observed that there were no significant differences in the serum NSE levels of normal volunteers and patients with GC, which were 3.4±0.8 (n=18) and 3.25±0.62 (n=35), respectively (P=0.28) (Fig. 4).
DISCUSSION
The aim of the present study was to investigate whether NSE-OE can serve as a prognostic factor for GC. We found via clinicopathological analyses that the NSE-OE group correlated with lower T stages, lower LN metastasis, lower TNM stages, lower number of cancer-related deaths, lower cancer recurrence, and longer survival times when compared to the NSE-UE group. However, there were no significant differences in the preoperative serum NSE levels of patients with GC and serum NSE levels of healthy volunteers.
Recently, attempts have been made to identify biomarkers that can be used to predict the survival or recurrence in patients with GC. However, a biomarker that can be used in clinical practice remains elusive [891011]. Human epidermal growth factor receptor 2 (HER2) is associated with aggressive behavior in 15%–25% of breast cancer cases, and approximately 10% of GC cases. Combined therapy with trastuzumab (a monoclonal antibody against HER2, Herceptin®; Genentech, Inc., South San Francisco, CA, USA) and conventional chemotherapy has proved to be more effective than conventional chemotherapy in treating GC [12]. There have been several reports that correlate prognosis with different factors such as epidermal growth factor receptor expression, gene copy number, microsatellite instability, histone modification pattern, and cyclin D1, p16, and p21 protein expression [1013141516].
Serum NSE level is a known prognostic marker for small cell lung cancer and non-small cell lung cancer in advanced stage lung cancer and neuroendocrine tumor [1718]. Since NSE leaks out of neurons during necrosis, NSE is also an important prognostic marker for neuronal damage-related diseases such as cerebral infarction, cerebral hemorrhage, subarachnoid hemorrhage, epilepsy, brain trauma, cerebral anoxia, encephalitis, and Creutzfeldt-Jakob disease [19]. However, none of the previous studies has analyzed serum NSE concentrations in patients with GC. We found that NSE is overexpressed in GC tissue, though there were no differences in serum NSE levels between health volunteer and patient with GC. There were also no differences in NSE serum levels between EGC and AGC.
NSE is a key enzyme of the glycolytic pathway and is expressed in neuroendocrine cells. Therefore, there is a possibility that NSE-overexpressing gastric carcinomas arise from neuroendocrine cells that undergo oncogenic transformation. It is possible that the NSE-OE group forms differentiated tumors unlike the NSE-UE group. It is suspected that differentiation of the gland is significantly different from that of the neuroendocrine gland. Patients with well-differentiated cancer showed better prognosis than those with poorly differentiated cancer.
TMA allow for large-scale analyses of human tissues and, through the use of consecutive sections, permit the assessment of multiple proteins in almost all morphologically identical regions of the tumor [20]. We measured the expression of NSE via cytoplasmic staining and presented it as the percentage of NSE-positive cells. Some studies used immunofluorescence analysis and calculated the florescence expression density, whereas most of the NSE studies in lung cancer measured serum NSE levels using radioimmunoassay or ELISA.
One of the limitations of the present study is that NSE is not an independent prognostic factor in multivariate analysis. However, to our knowledge, this is the largest IHC study evaluating NSE expression in human tissues and serum with a particular emphasis on GC.
In conclusion, patients with NSE-OE in their GC tissues show better prognostic results than the NSE-UE group. Therefore, NSE is a potential candidate biomarker in patients with GC, although further studies are needed to confirm these results.
 XML Download