This article has been
cited by other articles in ScienceCentral.
Abstract
Purpose
The aim of this study was to establish an anthropometric reference of the stomach for gastric cancer surgery and a modeling formula to predict stomach length.
Materials and Methods
Data were retrieved for 851 patients who underwent total gastrectomy at the Seoul National University Hospital between 2008 and 2013. Clinicopathological data and measurements from a formalin-fixed specimen were reviewed. The lengths (cm) of the greater curvature (GC) and lesser curvature (LC) were measured. Anthropometric data of the stomach were compared according to age, body weight, height (cm), and body mass index. To predict stomach length, two multiple regression analyses were performed.
Results
The mean lengths of the GC and LC were 22.2±3.1 cm and 16.3±2.6 cm, respectively. The men’s GC length was significantly greater than the women’s (22.4±3.1 cm vs. 21.2±2.9 cm, P=0.003). Patients aged >70 years showed significantly longer LC than those aged <50 years (16.9±2.9 cm vs. 15.9±2.4 cm, P=0.002). Patients with body weights >70 kg showed significantly longer GC than those with body weights <55 kg (23.0±2.9 cm vs. 21.4±3.2cm, P<0.001). In the predicted models, 4.11% of the GC was accounted for by age and weight; and 4.94% of the LC, by age, sex, height, and weight.
Conclusions
Sex, age, height, and body weight were associated with the length of the LC, while sex and body weight were the only factors that were associated with the length of the GC. However, the prediction model was not sufficiently strong.
Keywords: Organ size, Stomach, Stomach neoplasms
Introduction
The main treatment of gastric cancer is surgical resection and lymph node dissection. The extents of gastrectomy and lymph node dissection for gastric cancer are determined based on the primary tumor location according to the Japanese Gastric Cancer Association (JGCA) guideline.
1 The location and size of the stomach were reported to be dependent on several factors.
234 In addition, the shape of the stomach is dynamic
5; thus, preoperative localization of gastric cancer has limited accuracy. Studies regarding the relationship between the size of the stomach and that of a lesion are limited. The JGCA guideline recommends that the minimal resection margin, as measured from the tumor invasion area, be ≥2 cm for early-stage cancers; ≥3 cm for locally advanced cancers (Borrmann types I and II); and ≥5 cm for invasive advanced cancers (Borrmann types III and IV).
1 A previous study on stomach size compared Westerners and Asians.
6 This comparative study between Japanese and Americans was performed to identify the gastric characteristics of the two groups. The Japanese subjects had a longer and more floating stomach. As this study was conducted many years ago, its data are inadequate for application in modern times. Although the gastric cancer incidence in Asian countries is high, anthropometric data regarding the stomach size of Asian patients with gastric cancer are lacking.
As national screening for gastric cancer has been popular especially in Korea, the incidence of early-stage gastric cancer has increased rapidly.
78 Recently, a large-scale randomized trial reported that laparoscopy-assisted distal gastrectomy is safe for patients with clinical stage I gastric cancer and has a benefit of lower occurrence rate of wound complications than conventional open distal gastrectomy.
9 In laparoscopic gastrectomy, a metric reference of the stomach may minimize the difference between preoperative estimation and actual length of interest, and can preoperatively predict the extent of resection in gastric cancer surgery.
The aim of this study was to analyze the anthropometric reference of the stomach for patients with gastric cancer, investigate relevant factors, and predict stomach length by using a modeling formula.
Materials and Methods
We retrospectively reviewed the medical records of 851 patients with histologically confirmed gastric cancer who underwent total gastrectomy at Seoul National University Hospital between 2008 and 2013. Remnant total gastrectomy was excluded. We analyzed clinical data in terms of age, sex, height, body weight, and body mass index (BMI), and pathological data in relation to the lengths of the stomach. The lengths of the greater curvatures (GCs) and lesser curvatures (LCs) were compared according to sex, patient age, body weight, height, and BMI. The subjects were divided as follows: into four groups by age (<50 years, 50~60 years, 61~70 years, and >70 years), into three groups by height (<160 cm, 160~170 cm, and >170 cm), into three groups by body weight (<55 kg, 55~70 kg, and >70 kg), and into five groups by BMI according to the International Classification of Diseases of the World Health Organization (<18.5 kg/m
2, 18.5~22.9 kg/m
2, 23.0~24.9 kg/m
2, 25.0~29.9 kg/m
2, and >30.0 kg/m
2). TNM stage was described according to the seventh edition of the American Joint Cancer Committee/International Union Against Cancer staging system.
10 This study was approved by the Institutional Review Board of Seoul National University Hospital (IRB No. 1410-095-619).
After gastric cancer surgery, the specimen was opened along the counterpart of the lesion for intraoperative inspection and delivered to the department of pathology. The stomach specimens were fixed in formalin, and the lengths of the GCs and LCs were measured by the pathologist without pin fixation. The lengths of the lesser and GCs were measured as follows: 1) If the specimen was opened along the GC, the length of the straight line between the esophagogastric junction and the pylorus was measured for the LC and that between the pylorus and the apex of the fundus for the GC. 2) If the specimen was opened along the LC, the length of the straight line between the esophagogastric junction and the pylorus was measured for the GC and the length of the circumference line between the pylorus and the esophagogastric junction along the cut side for the LC (
Fig. 1). To predict the lengths of the GCs and LCs of the stomach, two multiple regression analyses were performed with age, sex, height, body weight, and T stage as independent variables. BMI was not included in the regression analysis because it was a variable derived from height and weight, and had weak correlations with the GCs and LCs, and lower association with the GCs and LCs than body weight.
To examine the validity of the models, 112 new patients who underwent total gastrectomy between 2014 and 2015 were predicted by using the models, and the predictions were compared with the lengths measured on the specimens. To identify the correlation among measurements from fresh stomach tissue specimens, the conventional method, and fresh tissue specimens before fixation in formalin, 20 new patients who underwent total gastrectomy were prospectively evaluated.
Statistical analysis was performed with IBM SPSS Statistics ver. 21.0 (IBM Co., Armonk, NY, USA). To examine the pattern and correlation between the anthropometric and clinical data, Pearson correlation coefficients were calculated. A multiple regression analysis was separately performed to predict the lengths of the GCs and LCs, with age, sex, height, weight, and T stage as independent variables. All P-values were two-sided, and statistical significance was defined as a P-value of <0.05.
Results
1. Patient characteristics
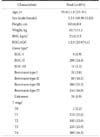
Of the 851 patients who underwent total gastrectomy, 587 patients were men and 264 patients were women (
Table 1). Their mean age was 59.4±11.8 years; mean height, 163.6±8.0 cm; mean body weight, 62.7±11.1 kg; and mean BMI, 23.4±3.3 kg/m
2. According to the difference between the men and women, the mean height, body weight, and BMI were 167.1±5.7 cm and 155.6±6.7 cm, 65.8±10.5 kg and 55.7±9.2 kg, and 23.5±3.2 kg/m
2 and 23.0±3.7 kg/m
2 in the men and women, respectively. The difference in BMI was not as significant as the differences in body weight and height (P=0.023). More patients had advanced cancer, with 220 patients (25.9%) having early-stage stomach cancer and 631 patients (74.1%) having advanced-stage stomach cancer. Of the patients, 300 patients (35.3%) had Borrmann type III cancer, 309 patients (36.3%) had T4 stage cancer, and 218 patients (25.6%) had T1 stage cancer.
2. Stomach dimension
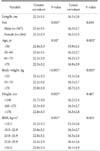
The mean lengths of the GC and LCs were 22.2±3.1 cm and 16.3±2.6 cm, respectively. The mean difference between the lengths of the lesser and GCs was approximately 6 cm. The length of the GC was significantly longer in the men than in the women (22.4±3.1 cm vs. 21.2±2.9 cm; P=0.003). The LC significantly increased in length with age as follows: 15.9±2.4 cm, 16.2±2.7 cm, 16.2±2.5 cm, and 16.9±2.9 cm for ages <50 years, 51 to 60 years, 61 to 70 years, and >70 years, respectively (P=0.002). For body weight, the patients who had significantly longer GCs were heavier, with lengths of 21.4±3.2 cm, 22.2±3.0 cm, and 23.0±2.9 cm for weights <55 kg, 55 to 70 kg, and >70 kg, respectively (P<0.001). The same pattern was observed in the LC (P=0.001). The GC was significantly longer for the taller patients, with lengths of 21.7±3.0 cm, 22.3±3.0 cm, and 22.8±3.3 cm for heights <160 cm, 160 to 170 cm, and >170 cm, respectively (P=0.003). The length of the GC significantly increased as BMI increased, except for BMIs of 25.0 to 29.9 kg/m
2 (P=0.001;
Table 2). The length of the GC showed significant correlations with height, body weight, and BMI (correlation coefficients=0.1360, 0.1864, and 0.1370, respectively; P<0.0001). The length of the LC showed significant correlations with age and body weight (correlation coefficients=0.1334 and 0.1120, respectively; P<0.0001 and P=0.0011).
3. Predictive model
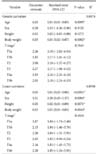
The regression formula for predicting stomach size was as follows: GC=17.47+0.02×age+0.06×body weight; LC=3.32+0.05×age+0.98×sex+0.05×height+0.03×body weight (
Table 3).
To examine whether the predictors of the length of the GC are sex related, the correlation between sex and each of the other independent variables were tested, but none showed significant correlation as follows: age (P=0.3099), height (P=0.8488), body weight (P=0.4640), and T stage (P=0.5537). The length of the GC increased by 0.03 cm as age increased by 1 year (P=0.0095) and increased by 0.05 cm as body weight increased by 1 kg (P=0.0002). Both findings were statistically significant. The GC was longer in the men than in the women by 0.30 cm (P=0.3720), and the length increased by 0.03 cm as height increased by 1 cm (P=0.1273). However, these findings were not statistically significant. In combination, age, sex, height, body weight, and T stage accounted for 4.74% of the variance of the GC (R
2=0.0474). For the LC, correlations between sex and each of the other independent variables were also tested to examine whether predictors would be sex related. However, sex did not significantly correlate with any of the following variables: age (P=0.6026), height (P=0.6827), body weight (P=0.5899), and T stage (P=0.8812). The length of the LC increased by 0.05 cm as age increased by 1 year (P<0.0001), increased by 0.05 cm as height increased by 1 cm (P=0.0071), and increased by 0.03 cm as body weight increased by 1 kg. It was longer in the men than in the women by 1.01 cm (P=0.0004). Thus, all the aforementioned variables were significant predictors of stomach length. In combination, age, sex, height, body weight, and T stage accounted for 5.98% of the variance of the length of the LC (R
2=0.0598). Predictive models were derived on the basis of the findings (
Table 4). With the predicted models, 4.11% of the GC was accounted for by age and body weight (R
2=0.0411), and 4.94% of the LC was accounted for by age, sex, height, and body weight (R
2=0.0494). The results showed significant differences between predicted and observed values. The limit of agreement was about 5 for the GCs and LCs (
Fig. 2). We validated the correlation between the regression formula and the actual stomach lengths by adding 29 new cases. Unlike the LC, the GC showed correlation between the regression formula and the actual stomach lengths (correlation coefficient=0.533, P=0.003 vs. correlation coefficient=0.150, P=0.437;
Fig. 3).
Discussion
In our study, the length of the GC was 22.2±3.1 cm and that of the LC was 16.3±2.6 cm. Stomach size was affected by sex, BMI, and age. The men had longer stomachs than the women. The GC of the stomach was affected more by BMI and was significantly longer in the patients with more severe obesity.
In contrast to our results, those of previous investigations by Csendes and Burgos
11 showed the stomach size, stomach volume, and body weight of 30 patients with obesity and that the lengths of the LC were 15.1±1.61 cm and 14.8±2.27 cm (P=0.661), and the lengths of the GC were 37.4±3.48 cm and 32.6±2.90 cm in the control and obese patient groups, respectively. These results show that the patients with obesity had significantly smaller GCs (P≤0.001). They also reported that as the BMI increased, the GC tended to become shorter, whereas the LC tended to become longer.
This study had a few limitations. This was a single-center retrospective study. Another limitation of our study was the fixation of the organ specimens in a fixing solution (e.g., formalin), which generally decreases organ volume and weight. Hwang et al.
12 investigated changes in the sizes of the ovary and fallopian tubes after formalin immersion and reported that after fixation, the length of the fallopian tube significantly decreased to 93% and that of the ovarian ligament significantly decreased to 84% of the corresponding measurements taken before fixation, whereas the cross-sectional area of the ovary greatly increased.
In our study, we measured the GCs and LCs after organ specimens had been fixed in formalin; thus, the GCs and LCs in an actual stomach are expected to be longer than the values reported herein. In a 1979 prospective descriptive study conducted to determine the extent of gastrectomy, Csendes et al.
13 reported that the length of the LC was 20 cm and that of the GC was 40 cm in a patient with a duodenal ulcer, but added a caveat that the measurements might not be accurate because they were measured during an operation without gastrectomy. In our study, the mean length of the GC was 22.2±3.1 cm, which is shorter than what was previously reported. This discrepancy might be due to the different measurement method used in our study, which did not include the length between the angle of His and the apex of the GC. During partial gastrectomy that includes distal gastrectomy or pylorus-preserving gastrectomy, the clinical significance of the GC is mainly focused on the length between the apex of the fundus and pylorus. The length between the angle of His and the apex of the fundus rarely influences the decision on the extent of resection of the stomach. We overcame the discrepancies in measurements and prospectively evaluated 20 new patients who underwent total gastrectomy. For the GC, the ratio of fresh tissue specimen to pathologic specimen was 1 is to 0.69, and that of the conventional method to the pathologic specimen was 1 is to 0.72 (
Table 5). Our sample size was too small to apply the results to all cases.
Compared with a previous simple comparative study, this study easily provided a more practical formula to determine the extent of gastrectomy, even at an outpatient clinic. The prediction model developed in this study showed low predictive ability. Nevertheless, our study revealed that stomach length was associated with objective factors, including sex, height, and body weight, which can be simply measured without invasive examination. Future studies should consider various factors and collect prospective information from fresh tissue samples.
In conclusion, the length of the LC was 16.3±2.6 cm and that of the GC was 22.2±3.1 cm. The length of the LC was associated with sex, age, height, and body weight, while the length of the GC was significantly associated with sex and body weight. However, the prediction model was not strong enough for calculation of actual stomach lengths.
Figures and Tables
Fig. 1
The lengths of the GC and LC were measured. (A) Opening along the GC, the length of the straight line between the esophagogastric junction and the pylorus was measured for the LC and that between the pylorus and the apex of fundus for the GC. (B) Opening along the LC, the length of the straight line between the esophagogastric junction and the pylorus was measured for the GC and the length of circumference line between the pylorus and the esophagogastric junction along the cut side for the LC. GC = greater curvature; LC = lesser curvature.

Fig. 2
To examine the validity of the prediction models, 112 new patient cases who underwent total gastrectomy from 2014 to 2015 were predicted by the models, and the predictions were compared with the lengths measured on the specimens. (A) The length of GC compared to the difference between predicted and observed values. (B) The length of LC compared to the difference between predicted and observed values. The limit of agreement was about 5 in GC and LC. GC = greater curvature; LC = lesser curvature.

Fig. 3
External validation of the prediction model using 29 new cases who underwent total gastrectomy. The correlation between actual size and the regression formula analyzed by pearson correlation coefficient. The greater curvature than lesser curvature showed the correlation between the regression formula and actual stomach.

Table 1
Characteristics of total gastrectomy patients

Table 2
Comparison of stomach lengths (n=851)

Table 3
Prediction model for the lengths of the greater and lesser curvatures of the stomach

Table 4
Results of the multivariate analysis of the independent influencing factors on the lengths of the greater and lesser curvatures of the stomach of the patients with gastric cancer and the prediction model

Table 5
Comparison of stomach length among fresh tissue specimens, the conventional method, and pathologic specimens (n=20)


 PDF
PDF ePub
ePub Citation
 Print
Print


 XML Download