

 PDF
PDF ePub
ePub Citation
 Print
Print


Introduction
Gastric cancer and colorectal cancer are the most common gastrointestinal cancers in the world; in 2012, gastric cancer had the fourth highest incidence among all solid cancers worldwide; colorectal cancer had sixth highest.1 Furthermore, not only is the incidence of colorectal cancer high in Western countries, in some Asian countries, the incidence of gastric cancer is also high.23 For example, the incidence rates of gastric and colorectal cancer were fourth and second highest, respectively, among all solid cancers in Japan; moreover, they are fourth and third highest, respectively, in Korea. It has also been reported that the co-incidence of these two malignancies tends to be higher than the single incidence rates in the healthy population.456
Because of the high incidence of colorectal neoplasm in patients with gastric cancer, as well as the possible effect of gastrectomy on clinicians' ability to perform colonoscopy, Yoo et al.7 suggested that colonoscopy be used as a routine, preoperative diagnostic test in patients with gastric cancer.89
Colonoscopy becomes more difficult after gastrectomy, probably due to postoperative adhesion, anatomical distortion, or intolerance to oral colon-cleansing fluid. However, the influence of gastrectomy on surgeon's ability to conduct colonoscopy may differ depending on the type of approach (open vs. laparoscopic), the extent of the surgery, or the type of anastomosis, which may be made across the transverse colon (as in a Billroth-II or Rouxen-Y anastomosis), or only in the upper area of the colon (as in a Billroth-I anastomosis).
Colonoscopy is an effective and relatively safe tool for diagnosing and treating synchronous colorectal neoplasm.1011 However, it is not clear whether the procedure should be performed routinely before all gastrectomies, because it is occasionally associated with serious complications and a low cost-benefit ratio; in addition colonoscopy is not an urgent examination during the preoperative period. Instead, preoperative colonoscopy may be considered in selected patients only when their postoperative colonoscopy is expected to be difficult.
The present study aimed to evaluate the influence of gastrectomy on the performance of a subsequent colonoscopy, to identify the surgical factors that increase the difficulty of the colonoscopy, and to select the patients who would benefit from a preoperative colonoscopy before a gastrectomy to treat gastric cancer.
Materials and Methods
We retrospectively reviewed the medical records of 482 patients who had a history of gastrectomy due to gastric cancer and had undergone a colonoscopy between 2011 and 2014.
To determine whether a previous gastrectomy influenced the subsequent colonoscopy, the patients were compared with a control group (n=2,892), which was generated from among all colonoscopy cases during the same period using 1:6 matching by age, sex, and the experience level of endoscopist (faculty vs. fellow). Patients with a history of abdominal or pelvic surgery, abdominal or pelvic malignancy, inflammatory disease, or irritable bowel syndrome were excluded during the matching process.
To evaluate the influence of a prior gastrectomy on subsequent colonoscopy, the gastrectomy group was compared with the control group in terms of (1) the insertion time (minutes) taken to reach the cecum, (2) the proportion of cases (%) wherein surgeons failed to reach the cecum, and (3) the bowel clearance score 1 (very poor) to 5 (excellent), which was routinely recorded by endoscopists. Based on these parameters, we generated a comprehensive parameter to define difficult/incomplete colonoscopy performance, taking into account (1) insertion time >775 seconds, which corresponded to the 15th percentile in the control group; (2) failure of cecal intubation; and (3) very poor (score of 1/5) bowel preparation scale.
After the patients and the control group had been compared, we conducted a risk factor analysis in the gastrectomy group to identify the surgical factors that further increased the difficulty of performing a postoperative colonoscopy. We analyzed both patient and surgical factors including age, sex, surgical approach (open vs. laparoscopy), cancer stage, extent of gastrectomy (partial gastrectomy including distal gastrectomy, pylorus-preserving gastrectomy, and proximal gastrectomy vs. total gastrectomy), extent of lymph node dissection (<D2 vs. D2), and reconstructive anastomosis methods in terms of their relationship with the transverse colon. A Billroth-I gastroduodenostomy, gastrogastrostomy, and esophagogastrostomy were categorized as anastomoses above the transverse colon, and a Billroth-II gastrojejunostomy and Rouxen-Y anastomosis were categorized as anastomoses across the transverse colon. Finally, the following parameters were analyzed as possible risk factor: (1) the time elapsed between the gastric surgery and the colonoscopy; (2) the presence of postoperative intra-abdominal complications, including peritoneal abscess and leakage; and (3) receipt of adjuvant chemotherapy.
Statistical analyses were performed using the IBM SPSS Statistics ver. 22 (IBM Co., Armonk, NY, USA). Chi-square and t-tests were used to compare the gastrectomy group with the control group. Linear regression analysis was used to evaluate the relationship between insertion time and the duration after gastrectomy. Multivariate linear and binary logistic regression analyses were performed to assess the independent effect of each variable. A P-value of less than 0.05 was regarded as significant.
The study protocol was approved by the Institutional Review Board of Seoul National University Hospital (H-1406-114-590), and the study was performed in accordance with Good Clinical Practice Guidelines and the Declaration of Helsinki.
Results
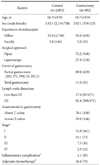
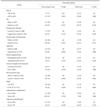
A total of 482 patients who underwent a gastrectomy were matched to 2,892 subjects in the control group, with a mean age of 58.75 years and a male:female ratio of 2.92:1. In both groups, the colonoscopies were performed by fellows (with or without faculty upervision) in 95% of cases. Basic information regarding surgical procedures, stage of disease, postoperative intra-abdominal inflammatory complications, and adjuvant chemotherapy is shown in Table 1.
Both the insertion time and the failure rate were significantly higher in the gastrectomy group than in control group. There was no significant difference in the proportion of cases with "very poor" clearance (colon clearance score of 1) between the groups. However, when the proportion of patients with either "very poor" or "poor" (scores of 1 and 2) colon clearance was evaluated, the clearance status of the colon in the gastrectomy group was poorer than that in the control group. The proportion of cases of "difficult/incomplete colonoscopy" (insertion time >775 seconds [12.9 minutes]), insertion failure, or very poor colon clearance was significantly higher in the gastrectomy group (Table 2).
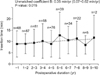
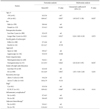
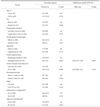
Univariate and multivariable analyses were performed in the gastrectomy group to identify risk factors for increased insertion time, cecal intubation failure, or "very poor" preparation score. Postoperative duration >5 years, total gastrectomy, and D2 dissection were risk factors for prolonged insertion time in the univariate analysis; postoperative duration >5 years and total gastrectomy were independent risk factors in the multivariate analysis (Table 3). The mean insertion time slowly increased (0.35 min/yr) with greater time after gastrectomy (Fig. 1).
No specific risk factors could be identified for failure of the cecal intubation or very poor clearance of the colon (Table 4, 5).
For a comprehensively defined difficult/incomplete colonoscopy, total gastrectomy was the only risk factor in both univariate and multivariate analyses, with an odds ratio of 1.96 compared with partial gastrectomy (Table 5). The proportions of difficult/incomplete colonoscopies were 21.3%, 26.3%, and 39.6% in the control, gastrectomy, and total gastrectomy subgroups, respectively (Table 2).
Surgical approach (open or laparoscopic), intra-abdominal inflammatory complications, or adjuvant chemotherapy did not influence colonoscopy performance in gastrectomy patients. Furthermore, in the gastrectomy group, no colonoscopy-related complications, such as perforation or bleeding, were identified.
Discussion
This study showed that a prior gastrectomy can influence subsequent colonoscopy performance in terms of insertion time, failure rate, and poor clearance of the bowel; a total gastrectomy and prolonged duration after gastrectomy can further increase the difficulty of the colonoscopy.
The following parameters have been suggested as risk factors, for difficult colonoscopy: female gender, old age, obesity, inadequate bowel cleansing, irritable bowel syndrome, inflammatory bowel disease, peritonitis, and complicated diverticular disease.811121314151617 Several studies have addressed whether a history of abdominal surgery increases the difficulty of colonoscopy.813141516 However none of these studies took into account the details of the surgical procedures in gastrectomy. Thus, to our knowledge the present study was the first to analyze the relationship between difficult colonoscopy and detailed patient and surgical factors related to a prior gastrectomy.
We used the insertion time, failure rate, and poor clearance rate as surrogate indicators of difficult colonoscopy; although many parameters can measure the difficulty of colonoscopy, it was difficult to determine universal parameters that do so. Moreover, to allow a comprehensive understanding using all if these parameters of how prior gastrectomy influences subsequent colonoscopy, we defined the concept of "difficult/incomplete" colonoscopy. Previous studies, in which the procedure was mainly performed by experienced faculty members, have suggested a cut-off value for insertion time of 10 minutes.815 Considering that the majority of colonoscopy procedures in the present study were performed by fellows at our institution a teaching hospital, we set the cut-off value for insertion time according to the percentiles in the control groups of previous studies (approximately the 15th percentile in our series, corresponding to 12.9 min [775 s]).
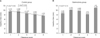
Poor clearance was not directly related to the technical difficulty of the colonoscopy in the present study. Therefore, it may be that the difficulty of difficulty of the colonoscopy is increased in patients who have undergone gastrectomy because they have difficulty drinking lots of fluid to prepare the bowel. Indeed correlation was found between insertion time and bowel preparation status in the non-surgical group, but not in the gastrectomy group (Fig. 2). Therefore, there may be factors that increase the difficylty of colonoscopy other than poor bowel preparation status. Alternatively patients who have undergone a gastrectomy may have poor tolerance to oral bowel cleansing solution because their upper gastrointestine has low capacity; this indirect effect of gastrectomy may influence the difficulty of observation, as well as the completeness of the colonoscopy. By the way of support for this hypothesis, a higher proportion of poor clearance (scores of 1 and 2) was found in the gastrectomy group. However, for reasons of clinical relevance, we used only "very poor clearance" to define difficult/incomplete colonoscopy: no significant difference was observed between the groups in terms of the proportion of such cases. These results indicate that investigators should develop the duration and/or methods of bowel preparation so that they are optimized for colonoscopy after gastrectomy.
The following mechanisms may explain how a gastrectomy increases the difficulty of subsequent colonoscopy: anatomical distortion and fixation of the colon, which are caused by postoperative adhesion; extensive surgical dissection; changes in the anatomical space around the removed organ; tension of the anastomosis limb across the transverse colon. A laparoscopic approach is known to generate fewer adhesions than open surgery.18 However, in the present study, no difference was observed in the difficulty of colonoscopy performance between the laparoscopy and open surgery groups. Likewise, postoperative inflammatory complications and adjuvant chemotherapy, which are related to adhesions, were not correlated with any indicators of a difficult colonoscopy.
A possible mechanism for the increased difficulty during passage through the transverse colon is decreased laxity of the transverse colon which renders shortening of colon difficult.819 From the literatures and our own experience, we assume that gastrectomy distorts and affects the laxity of the transverse colon, and that this effect may be greater in the case of total gastrectomy, because both the tension of the jejunal loop, as well as the wide empty space that remains after surgery can aggravate the distortion and the acute angulation of the transverse colon.
Fortunately, there are no colonoscopy-related complications in the gastrectomy group, perhaps because endoscopists took a more cautious approach in this group; indeed, this may also have caused the gastrectomy group to have higher failure rate than the control group. In addition, gastrectomy may not affect the sigmoid colon, which is the most frequent area of perforation20 generally, and which is affected by hysterectomy;21 instead, it may affect the transverse colon.
In the current study, we hypothesized that reconstruction methods crossing the transverse colon confer greater difficulty in colonoscopy than an anastomoses made above the transverse colon. However, our results showed that anastomosis methods were not directly correlated with the difficulty of colonoscopy, although total gastrectomy, in which all anastomoses are made in Roux-en-Y manner across the transverse colon, was associated with significantly greater difficulty in colonoscopy according to all indicators (Table 2). It may be that the results differed between total gastrectomy and anastomosis across the transverse colon because the tension of the Roux-limb is higher, and because the transverse colon is more displaced by total gastrectomy than by the Roux-en-Y or Billroth II anastomosis of a distal gastrectomy. Additional factors, such as displacement and fixation of the transverse colon to the empty space from which the stomach was removed, as well as a more exposed retroperitoneal area, may contribute to the overall difficulty of a colonoscopy after total gastrectomy. The majority of the Billroth II anastomoses in our series, and all of the Roux-en-Y anastomoses, were performed in the "antecolic" manner, in which a small bowel loop crosses anterior to the transverse colon. In this way, we could not compare the antecolic with the retrocolic anastomoses; in the latter, the small bowel limb passes though the mesocolon and behind the transverse colon.
Interestingly, the insertion time did not decrease with increased the duration after surgery; this result was inconsistent with our initial hypothesis that adhesions diminish over time and that, for this reason, the difficulty of colonoscopy also decreases. This finding suggests that, provided that patients can tolerate the oral bowel cleansing solution, colonoscopy need not to be delayed for several years to allow the adhesions to shrink or resolved.
Although a prior gastrectomy significantly increased the difficulty of subsequent colonoscopy, the absolute difference in each parameter was not large enough to justify a routine colonoscopy before every gastrectomy. Specifically, increases of 1 minute in insertion time, 1.8% in the failure of cecal intubation, and 5% in the comprehensively defined difficult/incomplete colonoscopy parameter were observed after a gastrectomy. However, these differences were larger in the case of a total gastrectomy, which increased the proportion of difficult/incomplete colonoscopy cases by 18.3% (from 21.3% in the control group to 39.6% in the total gastrectomy). Therefore, preoperative colonoscopy could be considered and discussed with patients who are scheduled for total gastrectomy, provided that the patients are proper candidates for a screening colonoscopy according to guidelines, or that they will require a follow-up colonoscopy in the near future. In South Korea, the guidelines recommended colonoscopy 5 years in individuals from 50 years old to 70 years old, as well as patients with symptoms indicating colon cancer.22 In addition, considering the difficulties of the procedure, colonoscopy in patients who have undergone gastrectomy should be performed by an experienced colonoscopist.
This study had some limitations. We only assessed the difficulty and completeness of colonoscopy using parameters related to insertion and clearance. For a more comprehensive analysis, a prospective cohort study should be carried out that focuses on the detailed difficulties of the various procedures, including a subjective evaluation of the patients' experiences.121314 Additionally, we were unable to determine the number of patients who had not undergone a colonoscopy because they were intolerant to the oral bowel-cleansing solution. This group of patients may support the need of the preoperative colonoscopy between the surgeon and patient. Finally, splenectomy may also increase the difficulty of colonoscopy, because the former can cause more angulation in the splenic flexure of the colon. However, we could not determine the effect of a splenectomy because only a limited number of splenectomy cases were included in our series.
In conclusion, a history of gastrectomy can increase the difficulty of subsequent colonoscopy in terms of the insertion time, failure of cecal intubation, and preparation of the bowel. This information may be helpful to clinicians when they are deciding on treatment strategy in patients who require gastrectomy particularly total gastrectomy and are candidates for screening or follow-up colonoscopy. A preoperative colonoscopy may be desirable in such patients; in postoperative case, all procedure of colonoscopy should be performed by expert endoscopists because history of gastrectomy makes colonoscopy difficult.

 XML Download