

 PDF
PDF ePub
ePub Citation
 Print
Print


Introduction
Tumor markers (TMs) are defined as circulating substances that can be measured quantitatively and that have a causal relationship with malignant neoplasia.1 Although primary neoplasms are the main sources of TMs, other organs influenced by the cancer may be origin sites for TMs.2 Since TMs reflect the cellular, biochemical, molecular, and genetic alterations caused by cancer, they have clinical value that can be roughly divided into two categories: determination of prognosis and diagnosis of cancer.1,3 With regard to prognosis, TMs should reflect the progression of the cancer after initial treatment as well as the response to subsequent treatments with agents such as chemotherapy.4 For diagnostic utility, TMs must be able to distinguish between benign disease and malignancy. Additionally, TMs may have step-wise threshold values that correlate with cancer stage.5
There are currently no specific TMs for gastric cancer. In the absence of an established marker, carcinoembryonic antigen (CEA) and carbohydrate antigen 19-9 (CA19-9) are the most commonly used alternatives.6,7,8,9 Although these two markers are currently widely used to reflect the state of gastric cancer, the specific degree of disease progression that is accompanied by a significant increase in CEA and CA19-9 has not been determined.9,10 Additionally, values for these two markers at each stage of progression have not been specified. The aim of this study was to determine the stage of progression at which CEA and CA19-9 increase, and to establish values for these markers at each stage.
Materials and Methods
1. Study group
There were 3,206 gastric cancer patients who underwent surgery at the Uijeongbu and Seoul St. Mary's Hospitals between 1989 and 2006. After exclusion of patients who received neoadjuvant chemotherapy or who had other organ malignancies, this study included 1,733 patients with pre-operatively measured CEA and CA19-9 values. Demographic data and results of follow-up were obtained retrospectively from the Gastric Cancer Patient Registry of the Uijeongbu and Seoul St. Mary's Hospitals.
Regular follow-up visits were conducted according to our standard protocol (every 3 and 6 months for advanced and early gastric cancer, respectively, for the first 3 years; every 12 months thereafter), and the mean follow-up period for the 1,733 enrolled patients was 75.6±59.7 months (range, 0.2~259.7 months). Survival rates were repeatedly determined using registration data from the Korea National Statistical Office and medical records.
The Institutional Review Board of the Ethics Committee of the College of Medicine at The Catholic University of Korea approved this study (XC13RIMI0124U).
2. Classification of progression
Pathological stages in the present study were reclassified according to the seventh edition of the American Joint Committee on Cancer tumor node metastasis staging system. The degree of cancer progression was categorized into five groups. The serosa-unexposed (SU) group included patients with a T-stage up to T3, meaning their tumors had invaded subserosal tissue. The serosa-exposed (SE) group included patients that were stage T4a, meaning their tumors had invaded the serosa. The direct invasion (DI) group included patients that were stage T4b, indicating their tumors had invaded into adjacent structures. The localized seeding (P1) group included patients with seeding in the greater omentum or the peritoneum above the transverse colon. The extensive seeding (P2) group included patients with seeding in the diaphragm or the peritoneum below the transverse colon.
3. Statistical analysis
Differences between groups were analyzed using chi-square tests or Fisher's exact tests for proportions and analysis of variance with the least significant difference and Tukey's b test for continuous variables. Survival curves were estimated using the Kaplan-Meier method with a log-rank test for univariate analysis. Pearson correlation coefficients were calculated to assess correlations. Statistical analyses were performed using SPSS software, version 13.0 (SPSS Inc., Chicago, IL, USA). Values of P<0.05 were considered to indicate statistical significance.
Results
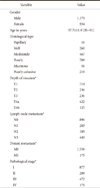
The characteristics of enrolled patients are described in Table 1. In ascending order of progression, there were 1,166 patients (67.3%) in the SU group, 363 (20.9%) in the SE group, 59 (3.4%) in the DI group, 51 (2.9%) in the P1 group, and 94 (5.4%) in the P2 group.
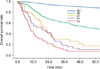
The 5-year survival rates were 88.4% for the SU group, 50.1% for the SE group, 17.1% for the DI group, 10.5% for the P1 group, and 6.7% for the P2 group (Fig. 1). The survival rates for each stage were significantly different, except between the DI and P1 groups (17.1% vs. 10.5%, P=0.344).
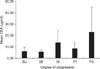
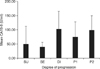
The mean CEA value was 5.80±64.0 µg/ml for the SU group, 5.48±16.1 µg/ml for the SE group, 13.36±40.9 µg/ml for the DI group, 8.06±19.3 µg/ml for the P1 group, and 22.82±106.7 µg/ml for the P2 group (Fig. 2). The mean CA19-9 value was 49.40±928.9 U/ml for the SU group, 38.97±129.3 U/ml for the SE group, 101.67±193.2 U/ml for the DI group, 73.77±158.9 U/ml for the P1 group, and 98.57±212.4 U/ml for the P2 group (Fig. 3). The mean values of both markers were not significantly different between the SU and SE groups (CEA: 5.80±64.0 µg/ml vs. 5.48±16.1 µg/ml, P=0.927; CA19-9: 49.40±928.9 U/ml vs. 38.97±129.3 U/ml, P=0.857). CEA levels increased significantly in the P2 group compared to the other groups (P=0.002), and CA19-9 was significantly increased in groups DI and P2 compared to the other groups (P=0.025, 0.007, respectively).
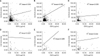
To investigate the relationship between the two markers, CEA and CA19-9 levels were compared in all patients and within each group. CEA and CA19-9 levels were poorly correlated when we analyzed the group of all patients and the SU group (all patients: r=0.065, P=0.025; SU group: r=0.075, P=0.032). There were no correlations between the two markers in the SE, DI, and P1 groups (SE group: r=0.067, P=0.311; DI group: r=-0.081, P=0.633; P1 group: r=0.292, P=0.084). There was a fair correlation between CEA and CA19-9 levels in the P2 group (r=0.494, P<0.001; Fig. 4).
Discussion
CEA is an oncofetal protein involved in cell adhesion and the inhibition of apoptosis. Normal serum CEA levels range from 0.0 to 2.5 µg/ml. Conditions such as inflammatory bowel disease, pancreatitis, liver cirrhosis, and chronic obstructive pulmonary disease can cause borderline CEA elevation, resulting in levels from 2.5 to 5.0 µg/ml. For cancer, the main clinical use of CEA is in colorectal cancer patients.11,12,13 CA19-9 is a mucin-type glycoprotein that has a normal range of up to 37 U/ml. The main clinical use of CA19-9 is in pancreatic cancer patients. CA19-9 is also elevated in conditions such as benign biliary tract disease and pancreatitis.14,15,16 These markers can be readily analyzed using blood samples and relatively inexpensive methods.
As mentioned above, CEA and CA19-9 are used as alternative TMs in gastric cancer, and many studies have reported that these markers have clinical value in gastric cancer.6,8,17 These markers have little value as screening tools or as diagnostic markers. However, the levels of both CEA and CA19-9 correlate with tumor burden, so the degree of elevation of these markers reflects cancer progression. Thus, these markers are most commonly used to monitor cancer growth and response to therapy. Although CEA and CA19-9 are relatively inaccurate in early disease, the levels of the markers correlate with advanced stages of cancer progression.7
Tumor burden increases through the sequence of cancer progression, so TM levels also increase. There are two distinct modes of progression in gastric cancer: local invasion and peritoneal seeding.18,19 In some cases, local invasion is advanced, but there is no peritoneal dissemination. In contrast, some cases show peritoneal dissemination with no local invasion. In the present study, gastric cancer patients were categorized into five groups according to tumor burden: (1) SU group, marginal tumor burden; (2) SE group, minor tumor burden; (3) DI group, one subtype of major tumor burden; (4) P1 and (5) P2 groups, other subtypes of major tumor burden. For both markers, levels did not correlate with serosal exposure of the tumor. However, marker levels were significantly higher in the P2 group. Additionally, CA19-9 had a peak average level of 101.67 U/ml in the DI group, which was significantly higher than the other groups, with the exception of the P2 group. These results indicate that CEA and CA19-9 are useful for prediction of extensive peritoneal seeding, not localized carcinomatosis. Additionally, CA19-9 is valuable for assessing local invasion of gastric cancer.
Radiological evaluation sometimes has limited value in pre-operative staging, even in very advanced gastric cancer where there is suspicion of DI or peritoneal seeding.20,21 In such cases, a staging laparoscopy is recommended to determine a more accurate diagnosis and to decide the therapeutic plan.21 However, a staging laparoscopy is an invasive procedure that requires general anesthesia. The findings of this study can be used to predict cancer progression in cases where the condition of the patient makes a staging laparoscopy infeasible. For instance, some advanced gastric cancer cases have ambiguous radiological findings, such as a small amount of ascites or a blurred border between the stomach and an adjacent organ. If patients in these cases have increased levels of CEA and CA19-9, this information could help doctors choose a treatment plan, such as palliative treatment or neoadjuvant chemotherapy.
We conducted a correlation analysis to evaluate the clinical application of the combination of the two markers in gastric cancer patients. There was a fair correlation between the two markers in the P2 group; therefore, a combined increase in both markers would be expected to predict extensive peritoneal seeding. Insignificant correlations were found between the markers in the SE, DI, and P1 groups. Among these groups, only the DI group had a tendency towards an inverse relationship between the levels of the two markers. This result indicates that increased CA19-9 alone suggests adjacent organ invasion by the gastric cancer.
A drawback of the present study was the lack of a cut-off value. Although the mean values for CEA in the P2 group and for CA19-9 in the DI and P2 groups were significantly higher than the values for the other stages, receiver operating characteristic curve analysis did not identify cut-off values for the two markers in the DI and P2 groups (data not shown). These results may have been obtained because of the low organ specificity of these markers, or because of the wide variation in their levels (as indicated by the standard deviations).
In conclusion, CEA and CA19-9 levels are useful for predicting the presence of extensive peritoneal seeding, but not P1. Additionally, CA19-9 can be used to assess DI of adjacent organs by gastric cancer. However, the levels of these markers were not associated with serosal exposure. Although cut-off values at each tumor progression stage could not be determined in the present study, determination of the combined levels of the two markers will facilitate decision making about treatment strategies for far-advanced gastric cancer.
 XML Download