

 PDF
PDF ePub
ePub Citation
 Print
Print


Introduction
DNA methylation is an important epigenetic alteration process that occurs during malignant transformations. It includes global hypermethylation and also the hypermethylation of CpG islands confined to the regulatory regions of most human genes.1 Aberrant promoter methylation of cancer-related genes is detected in gastric tumors, suggesting a connection to the induction/promotion of gastric cancer.2,3 The three most-studied genes for promoter hypermethylation in gastric carcinoma are p16, E-cadherin, and hMLH1.4 Of these genes, p16 (CDKN2a/INK4a) is an important tumor suppressor gene, and its protein is considered to be a negative regulator of G1 phase progression.5 In addition, E-cadherin (CDH1) is a transmembrane glycoprotein expressed on epithelial cells, and is also responsible for calcium-dependent homotypic cell adhesion.6 Cell-cell and cell-matrix interactions play a crucial role in neoplastic transformation and metastasis.7,8 Hypermethylation of the DNA mismatch repair gene, hMLH1, on chromosome 3p21 has been found in gastric tumors.9 DNA methylation is regulated by a family of DNA methyltransferases (DNMTs), including DNMT1, DNMT2, DNMT3a, DNMT3b, and DNMT31. DNMT1 has been implicated in S-phase replication foci and acts primarily as a maintenance methyltransferase.10 Enhancer of zeste homolog 2 (EZH2), a polycomb group protein, is a human homolog of the Drosophila protein. Overexpression of EZH2 is associated with poor prognosis or increased cancer risk in a variety of epithelial cell-derived digestive tumors, including esophageal cancer, gastric cancer, and colorectal cancer.11 In gastric cancer, high EZH2 expression is correlated with p53 expression and is significantly associated with distant metastases.12 Since aberrant promoter CpG island methylation is often present in non-neoplastic tissues with Helicobacter pylori-related gastritis,13 it is likely that gastric inflammation induces aberrant DNA methylation and gastric carcinogenesis.
Gastrokine 1 (GKN1) has been isolated from the gastric mucosal cells of several mammalian species, including the rat.14 GKN1 protects the antral mucosa and promotes healing by facilitating restitution and proliferation after injury.15 In addition, GKN1 also protects the intestinal mucosal barrier by acting on specific tight junction proteins and stabilizing peri-junctional actin.16 In our previous studies, we observed frequent loss of GKN1 expression in gastric cancers and identified tumor suppressor activities of GKN1 by inhibiting cell proliferation through regulation of epigenetic alteration.17
Here, we hypothesized that GKN1 is a candidate biomarker for gastritis and hypermethylation of tumor suppressor genes in the gastric mucosa. We examined the methylation status of the p16, CDH1, MINT1, MINT2, MINT31, and hMLH1 genes and the expression level of GKN1, EZH2, miR-185, c-Myc, and DNMT1 in 55 non-neoplastic gastric mucosal tissue samples. Our results implicate GKN1 as a candidate biomarker for determining the degree of gastritis and methylation status in gastric mucosa.
Materials and Methods
1. Samples
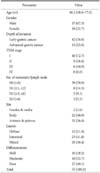
This study examined a total of 55 patients with sporadic gastric cancer who underwent a gastrectomy between 2011 and 2012 at Seoul St. Mary Hospital, The Catholic University of Korea. Patients with a history of familial gastric cancer were excluded. The clinicopathologic characteristics of the study population are listed in Table 1. Remote non-neoplastic mucosal tissue (≥5 cm distance) from the patient was used in this study. In addition, gastric mucosal tissues adjacent to each frozen specimen were also fixed in formalin and stained with hematoxylin-eosin. Histological assessment was performed independently by two pathologists. According to the updated Sydney system,18 a gastritis score of 0 (absent), 1 (mild), 2 (moderate), or 3 (marked) was assigned for each of the following parameters: activity (granulocytic infiltration), inflammation (lymphocytic and plasma cell infiltration), intestinal metaplasia and glandular atrophy. When the specimens were grade 2 or more, histological findings of granulocyte infiltration and mononuclear cell infiltration were diagnosed as inflammation positive. Atrophy was defined as the loss of appropriate glands; periodic acid Schiff staining was used to identify intestinal metaplasia. The study design was approved by the Institutional Review Board of The Catholic University of Korea, College of Medicine (CUMC09U089).
2. Measurement of GKN1, CagA, EZH2, DNMT1, and c-Myc expression
Expression of GKN1, CagA, EZH2, DNMT1, and c-Myc protein was examined in the 55 gastric mucosal tissues by western blot analysis. Each tissue sample was ground to very fine powder in liquid nitrogen using a mortar and pestle and then suspended in ice-cold Nonidet p-40 lysis buffer supplemented with a 1X protease inhibitor mix (Roche Molecular Biochemicals, Mannheim, Germany). The cell lysates were separated by 10% polyacrylamide gel electrophoresis and blotted onto a Hybond-polyvinylidene difluoride transfer membrane (Amersham Pharmacia Biotech, Piscataway, NJ, USA), which was subsequently probed with antibodies against GKN1, CagA, EZH2, DNMT1, c-Myc, or GAPDH. The protein bands were detected using enhanced chemiluminescence western blotting detection reagents (Amersham Pharmacia Biotech). Expression levels of the proteins in the western blots analysis were defined by densitometry. A ratio <0.8 was considered indicative of reduced protein expression.
3. Measurement of miR-185 expression
Total RNA from the 55 frozen gastric mucosal tissues was extracted and quantified. Reverse transcription polymerase chain reaction was performed using a SYBR Green Q-PCR Master Mix (Bio-Rad, Hercules, CA, USA), according to the manufacturer's protocol. miR-185 expression was quantified by quantitative real-time reverse transcription polymerase chain reaction (QPCR) and normalized to human U6 snRNA. The following primer sequences were used: adaptor for miR-185 RT: 5'-GTCGTATCCAGTGCAGGGTCCGAGGTATTCGCACTGGATACGACTCAGGAA-3', miR-185 forward: 5'-CAATGGAGAGAAAGGCAGTTCC-3', reverse: 5'-AATCCATGAGAGATCCCTACCG-3' and U6 forward: 5'-ATTGGAACGATACAGAGAAGATT-3', reverse: 5'-GGAACGCTTCACGAATTT-3'. Data are reported as relative quantities according to an internal calibrator using the 2-ΔΔCT method.19 The standard curve method was used for quantification of the relative amounts of gene expression products. This method provides unit-less normalized expression values that can be used for direct comparison of the relative amount of RNA in different samples. Reduced expression of miR-185 was defined as a ratio <0.5 in QPCR. For statistical analysis, the expression levels of the proteins and miR-185 in HFE-145 non-neoplastic gastric mucosal epithelial cells were used as a control.
4. Methylation-specific PCR (MSP)
The methylation status of the promoter region of the six CpG island methylation phenotype (CIMP) panel markers (p16, MINT1, MINT2, MINT31, CDH1, and hMLH1) was determined using sodium bisulfite treatment of the DNA followed by MSP, as described in the literature with minor modifications.20 Briefly, DNA was incubated in 0.2 M NaOH at 42℃ for 30 minutes in a total volume of 50 µl. After adding 350 µl of 3.6 M sodium bisulfite containing 1 mM hydroquinone at pH 5.0, the samples were incubated for 16 hours at 55℃ in the dark. The modified DNA was recovered with 5 µl glassmilk (BIO 101, Irvine, CA, USA) and 800 µl of 6 M NaCl. The glassmilk with the modified DNA was washed three times with 70% ethanol at room temperature, treated with 0.3 M NaOH and 90% ethanol, and washed twice with 90% ethanol. The DNA was finally eluted from the dried pellet with 30 µl of 1 mM Tris-HCl (pH 8.0) for 15 minutes at 55℃. Five microliters of the bisulfite-modified DNA was subjected to methylation-specific PCR (MSP) using two sets of primers for the methylated and unmethylated six CIMP panel markers. PCR was performed in a total volume of 30 µl, which contained 5 µl of the template DNA, 0.5 µM of each primer, 0.2 µM of each dNTP, 1.5 mM MgCl2, 0.4 units Ampli Taq gold polymerase (Perkin-Elmer, Waltham, MA, USA), and 3 µl of 10× buffer. The reaction solution was initially denatured for 1 minute at 95℃. Amplification was carried out for 40 cycles of 30 s at 95℃, 30 s at 52 to 65℃, and 30 s at 72℃, followed by a final 5 minutes extension at 72℃. Each PCR product was loaded directly onto 2% agarose gels, stained with ethidium bromide, and visualized under ultraviolet illumination. Sequences of the primers and annealing temperatures are described in Table 2. CIMP status was classified as CIMP-negative if none of the analyzed genes were hypermethylated, CIMP-low (L) if <50% of genes were hypermethylated, and CIMP-high (H) if ≥50% of genes were hypermethylated.
5. Statistical analyses
Pearson and Student's t-tests were used to analyze the correlation between expression of GKN1, miR-185, DNMT1, and EZH2, and the methylation status of the CIMP panel of markers. A P-value <0.05 was considered to be the limit of statistical significance. To further evaluate the diagnostic usefulness of the markers based on dichotomous classification, receiver operating characteristic (ROC) curve analysis was used. A ROC curve is a plot of the true-positive fraction versus the false-positive fraction evaluated for all possible cutoff point values.
Results
1. Association between GKN1 expression and the degree of gastritis
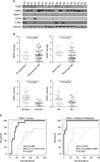
Based on histological analysis of the non-neoplastic gastric mucosal tissues, granulocytic and mononuclear cell infiltrations, atrophy, and intestinal metaplasia were found in 11 (20%), 42 (76.4%), 18 (32.7%), and 20 (36.4%) of the 55 cases, respectively. Reduced expression of GKN1 and the presence of H. pylori CagA protein were found in 20 (36.4%) and 26 (47.3%) of the 55 gastric mucosal samples, respectively (Fig. 1A). When we compared the expression level of GKN1 to the degree of gastritis, GKN1 expression was significantly reduced in the cases with mononuclear cell infiltration (P=0.0332), atrophy (P<0.0001), and intestinal metaplasia (P=0.0079) (Fig. 1B). However, altered GKN1 expression did not significantly correlate with granulocytic infiltration (P=0.4889). Interestingly, GKN1 predicted atrophy and intestinal metaplasia risk with an area under the ROC curve (AUC) value of 0.865 and 0.973, respectively (Fig. 1C).
2. GKN1, miR-185, DNMT1, EZH2, and c-Myc expression
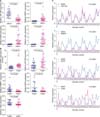
Next, we examined the expression levels of the GKN1, miR-185, DNMT1, EZH2, and c-Myc expression in the 55 non-neoplastic gastric mucosal tissue samples. In agreement with our previous data,17 expression levels of miR-185 were lower in the cases with reduced GKN1 expression, whereas expression levels of DNMT1, EZH2, and c-Myc proteins were higher in the gastric mucosal tissues with reduced GKN1 expression (Fig. 2A). Statistically, GKN1 protein expression showed a positive correlation with miR-185 expression (P=0.0001) and an inverse relationship with expression of DNMT1 (P<0.0001), EZH2 (P<0.0001), and c-Myc (P<0.0001). In addition, H. pylori CagA protein was inversely associated with miR-185 (P=0.0014) expression and positively associated with expression of DNMT1 (P=0.0002), EZH2 (P=0.0016), and c-Myc (P=0.0366) (Fig. 2B). In each case, GKN1 protein expression was closely related to the expression of miR-185, DNMT1, EZH2, and c-Myc (P<0.0001) (Fig. 2C).
3. Methylation status of CIMP panel markers
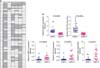
Bisulfite-modified DNA methylation analysis of the selected six genes was performed in the 55 non-neoplastic gastric mucosal tissues, which yielded high quality DNA. Based on MSP, the highest methylation frequency was detected for CDH1 in 45 (81.8%) of gastric mucosal tissue samples. The methylation frequencies of the other five genes were 56.4% for CDKN2A (31 cases), 58.1% for MINT1 (32 cases), 36.4% for MINT2 (20 cases), 5.4% for MINT31 (3 cases), and 3.6% for MLH1 (2 cases). Among the included cases, at least one gene was methylated in 53 (96.4%) cases and no methylation in any of the examined genes was observed in two cases (Fig. 3A). When we classified the methylation status into CIMP-L and CIMP-H, 30 (54.5%) and 23 (41.9%) cases were CIMP-L and CIMP-H, respectively. In addition, when we compared the methylation status to the expression of GKN1, miR-185, DNMT1, EZH2, and c-Myc, the GKN1 and miR-185 expression was reduced in the CIMP-H cases, whereas expression of DNMT1, EZH2, and c-Myc were up-regulated (Fig. 3B). Statistically, there was a close relationship between the methylation status and expression of GKN1 (P<0.0001), miR-185 (P<0.0001), DNMT1 (P=0.0004), EZH2 (P<0.0001), and c-Myc (P<0.0001).
Discussion
Inflammation has been recognized to be the key risk factor in the development of many types of cancers. In particular, promoter hypermethylation in tumor-related genes is frequently detected in premalignant gastric lesions.13 H. pylori infection and the resultant chronic inflammation in the gastric mucosa is a major step in the initiation and development of gastric cancer.21 In addition, aberrant DNA methylation is one of the major inactivating mechanisms of tumor suppressor genes and is strongly associated with H. pylori infection.22,23 Previously, we demonstrated that GKN1 suppresses gastric carcinogenesis through the regulation of epigenetic alteration in a miR-185 dependent manner.17 However, the precise relationship between gastritis and GKN1 has not been evaluated. Here, we investigated whether altered GKN1 expression is associated with the severity of gastritis and DNA methylation in non-neoplastic gastric mucosa.
Chronic inflammation of the stomach initiates histopathologic progression of chronic gastritis to gastric atrophy, intestinal metaplasia, dysplasia and finally gastric cancer.24 Interleukin (IL)-1β activates the transcription factor nuclear factor-kappa B (NF-κB) pathway in myeloid cells by binding to its receptor, IL-1RI.25 A number of reports have demonstrated that NF-κB is key in linking inflammation to cancer.26 Previously, we reported that GKN1 expression suppresses activation and nuclear translocation of NF-κB by inhibiting the degradation and phosphorylation of IκB and inactivating IKKα/β.27 Here, to investigate whether GKN1 is involved in gastric mucosal inflammation, we examined the expression level of GKN1 in 55 non-neoplastic gastric mucosal samples from patients with sporadic gastric cancer and compared GKN1 expression with the degree and characteristics of gastritis. The reduction or loss of GKN1 expression was found in 20 of 55 (36.4%) gastric mucosal tissues and was inversely associated with DNMT1, EZH2, and c-Myc expression (Fig. 1, 2). In addition, H. pylori CagA protein was detected in 26 of 55 (47.3%) gastric mucosae and its expression was negatively associated with GKN1 and miR-185 (Fig. 2). GKN1 expression was significantly reduced in gastric mucosa with mononuclear cell infiltration, atrophy, and intestinal metaplasia (Fig. 1B). When we analyzed the ability of GKN1 to discriminate patients with gastritis using an ROC curve, GKN1 predicted gastric mucosal atrophy and intestinal metaplasia risk with an AUC value of 0.865 and 0.973, respectively (Fig. 1C). Thus, our data implicates GKN1 as playing an important role in gastric mucosal inflammation, and suggests GKN1 as a candidate biomarker for atrophy and intestinal metaplasia in the gastric mucosa. Since subjects with normal and healthy gastric mucosa have no significant cancer risk, the ability to differentiate between individuals with healthy and diseased gastric mucosa is clinically relevant for identifying patients possibly at risk. Further studies are necessary to clarify these initial observations and to develop a diagnostic and screening tool using GKN1 as a cost-effective gastritis marker to assess gastric juice and biopsy tissue samples.
Epigenetic alterations, such as CpG island methylation of the promoter region in cancer-associated genes, are regarded as one of the major mechanisms of the development and progression of gastric carcinoma.12 The fraction of DNA molecules with aberrant methylation in gastric mucosae has been correlated with gastric cancer risk,28,29 indicating that methylation in non-cancerous tissues is related to gastric carcinogenesis. Previously, we observed the frequent loss of GKN1 expression in gastric cancers and tumor suppressor activities of GKN1 by inhibiting cell proliferation through epigenetic regulation.17 Thus, to determine whether GKN1 also plays a pivotal role in DNA methylation in non-neoplastic gastric mucosa, we analyzed the expression level of miR-185, DNMT1, EZH2, and c-Myc and the expression of CIMP using six CIMP panel markers, including p16, MINT1, MINT2, MINT31, E-CDH, and hMLH1 in gastric mucosae. At least one gene was methylated in 53 (96.4%) cases. Of these, 30 (54.5%) and 23 (41.9%) cases were CIMP-L and CIMP-H, respectively (Fig. 3A). The reduction or loss of GKN1 and miR-185 expression was inversely correlated with DNMT1, EZH2, and c-Myc expression (Fig. 1), and closely associated with the methylation status of the CIMP markers (Fig. 3B). Interestingly, expression of DNMT1 (P=0.0002), EZH2 (P=0.0016), and c-Myc (P=0.0366) was positively associated with H. pylori CagA protein (Fig. 2) and methylation status (Fig. 3B). These results strongly indicate that GKN1 may play an important role in epigenetic regulation in the gastric mucosal epithelium, and further support that GKN1 functions as a hypomethylating agent by achieving its biological target effect as a DNMT1 inhibitor.17
In conclusion, GKN1 expression was significantly reduced in gastric mucosa with mononuclear cell infiltration, atrophy, and intestinal metaplasia; and was inversely correlated with expression of DNMT1, EZH2, c-Myc proteins and the methylation status of CIMP markers in non-neoplastic gastric mucosa. These observations provide evidence that GKN1 may be a predictive and diagnostic biomarker for the degree of gastritis and the methylation status in non-neoplastic gastric mucosa. In addition, our data also further support that GKN1 plays an important role in the multistep process of gastric carcinogenesis.30 Further studies with larger sample sizes are necessary to rationalize and optimize the use of GKN1 as a diagnostic biomarker for gastritis and methylation status in non-neoplastic gastric mucosa.
 XML Download