

 PDF
PDF ePub
ePub Citation
 Print
Print


Abstract
Purpose
The study aims were to examine motivation factors for behavioral modification among individuals with metabolic syndrome at each stage of behavioral change.
Methods
The correlational research design was used to explore motivation factors of self-efficacy, perceived benefits, perceived barriers, and emotional salience to explain health behaviors. Total of 239 patients with metabolic syndrome completed the structured questionnaire and the data were analyzed by SPSS/WIN 22.0 for ANOVA and multiple regression analysis.
Results
The average age of participants were 59 years old, and 52.3% perceived their health relatively worse than others. The motivation and health behaviors except for smoking cessation were significantly different at each stage of planning, preparation, and action-maintenance. The motivation factors explained 25% of variance in health behavior at planning stage, 38% at preparation stage, and 31% at action-maintenance stage. Self-efficacy and perceived barriers were significant pre-dictors at the planning and action-maintenance stages, while self-efficacy was a significant predictor at preparation stage.
Conclusion
The performance of health behaviors was significantly different at the stages of change along with a different set of motivation factors. Nursing strategies should focus on cognitive and emotional motivation factors to lead initiation and maintenance of behavioral modification in individuals with metabolic syndrome.
Go to : 
REFERENCES
1.Panel NCEPE. Third report of the national cholesterol education program (NCEP) expert panel on detection, evaluation, and treatment of high blood cholesterol in adults (Adult Treatment Panel III) final report. Circulation. 2002. 106(25):3143–421.
2.Hong AR., Lim S. Clinical characteristics of metabolic syndrome in Korea, and its comparison with other Asian countries. Journal of Diabetes Investigation. 2015. 6(5):508–15. https://doi.org/10.1111/jdi.12313.
3.Jeong KS. Korea health statistics 2015. Korea national health and nutrition examination survey (KNHANES VI-3). Seoul: Korea Centers for Disease Control & Prevention;2016 December. Report No.: 11-1351159-000027-10.
4.Seong SC. 2016 National health screening statistical yearbook. Seoul: National Health Insurance Service;2017. November. Report No.: 11-B550928-. p. 000048–10.
5.Bianchi C., Penno G., Daniele G., Benzi L., Del Prato S., Miccoli R. Optimizing management of metabolic syndrome to reduce risk: focus on life-style. Internal and Emergency Medicine. 2008. 3(2):87–98. https://doi.org/10.1007/s11739-008-0122-6.

6.Koh G., Woo JT. Prevention of metabolic syndrome. Journal of the Korean Medical Association. 2005. 48(12):1188–94. https://doi.org/10.5124/jkma.2005.48.12.1188.
7.Jellinger PS., Handelsman Y., Rosenblit PD., Bloomgarden ZT., Fonseca VA., Garber AJ, et al. American association of clinical endocrinologists and American college of endocrinology guide-lines for management of dyslipidemia and prevention of cardiovascular disease. Endocrine Practice. 2017. 23(Suppl 2):1–87. https://doi.org/10.4158/EP171764.APPGL.
8.Park JK., Kweon S., Kim Y., Jang MJ., Oh K. Dietary behaviors re-lated to metabolic syndrome in Korean adults. Korean Journal of Community Nutrition. 2012. 17(5):664–75. https://doi.org/10.5720/kjcn.2012.17.5.664.
9.Oh EG., Bang SY., Hyun SS., Chu SH., Jeon YJ., Kang MS. Knowledge, perception and health behavior about metabolic syndrome for an at risk group in a rural community area. Jour-nal of Korean Academy of Nursing. 2007. 37(5):790–800. https://doi.org/10.4040/jkan.2007.37.5.790.
10.Bassi N., Karagodin I., Wang S., Vassallo P., Priyanath A., Massaro E, et al. Lifestyle modification for metabolic syndrome: a systematic review. The American Journal of Medicine. 2014. 127(12):1242. .e1-10.https://doi.org/10.1016/j.amjmed.2014.06.035.
11.Tougas ME., Hayden JA., McGrath PJ., Huguet A., Rozario S. A systematic review exploring the social cognitive theory of self- regulation as a framework for chronic health condition inter-ventions. PLoS One. 2015. 10(8):e0134977. https://doi.org/10.1371/journal.pone.0134977.
12.Song R. Analyzing motivational factors to predict health behaviors among older adults. Journal of Korean Academy of Adult Nursing. 2006. 18(4):523–32.
13.Rosenstock IM., Strecher VJ., Becker MH. Social learning theory and the health belief model. Health Education and Behavior. 1988. 15(2):175–83. https://doi.org/10.1177/109019818801500203.
14.Kang JS., Kang HS., Yun EK., Choi HR. Factors influencing health behavior compliance of patients with metabolic syndrome. Korean Journal of Adult Nursing. 2012. 24(2):191–9. https://doi.org/10.7475/kjan.2012.24.2.191.
15.Beer JS. What do we know about emotional influences on social cognition? A social neuroscience perspective. Emotion Review. 2017. 9(2):172–80. https://doi.org/10.1177/1754073916650492.
16.Williams DM., Evans DR. Current emotion research in health behavior science. Emotion Review. 2014. 6(3):277–87. https://doi.org/10.1177/1754073914523052.
17.Prochaska JO., Velicer WF. The transtheoretical model of health behavior change. American Journal of Health Promotion. 1997. 12(1):38–48. https://doi.org/10.4278/0890-1171-12.1.38.
18.Al-Otaibi HH. Measuring stages of change, perceived barriers and self efficacy for physical activity in Saudi Arabia. Asian Pacific Journal of Cancer Prevention. 2013. 14(2):1009–16. https://doi.org/10.7314/apjcp.2013.14.2.1009.
19.Hwang HJ., Lee EN., Choi EJ. Discriminating factors of stages of change for exercise among patients with metabolic syndrome. Journal of Muscle and Joint Health. 2014. 21(1):46–54. https://doi.org/10.5953/JMJH.2014.21.1.46.
20.Faul F., Erdfelder E., Buchner A., Lang AG. Statistical power analyses using G∗Power 3.1: tests for correlation and regression analyses. Behavioral Research Methods. 2009. 41(4):1149- 60.https://doi.org/10.3758/BRM.41.4.1149.
21.Velicer WF., Prochaska JO., Fava JL., Norman GJ., Redding CA. Smoking cessation and stress management: applications of the transtheoretical model of behavior change. Homeostasis. 1998. 38(5-6):216–33.
22.Song R., June KJ., Ro YJ., Kim CG. Effects of motivation-enhancing program on health behaviors, cardiovascular risk factors, and functional status for institutionalized elderly women. Jour-nal of Korean Academy of Nursing. 2001. 31(5):858–70. https://doi.org/10.4040/jkan.2001.31.5.858.
23.Song R., June KJ., Kim CG., Jeon MY. Comparisons of motivation, health behaviors, and functional status among elders in residential homes in Korea. Public Health Nursing. 2004. 21(4):361–71. https://doi.org/10.1111/j.0737-1209.2004.21410.x.
24.Kang KJ., Yu SJ. Health behavior and influencing factors in patients with coronary artery disease admitted to hospital. Jour-nal of Korean Academy of Fundamental of Nursing. 2010. 17(1):16–25.
25.Köpetz CE., Lejuez CW., Wiers RW., Kruglanski AW. Motivation and self-regulation in addiction: a call for convergence. Perspectives on Psychological Science. 2013. 8(1):3–24. https://doi.org/10.1177/1745691612457575.
26.Vancampfort D., Moens H., Madou T., De Backer T., Vallons V., Bruyninx P, et al. Autonomous motivation is associated with the maintenance stage of behaviour change in people with af-fective disorders. Psychiatry Research. 2016. 240:267–71. https://doi.org/10.1016/j.psychres.2016.04.005S.
Go to :
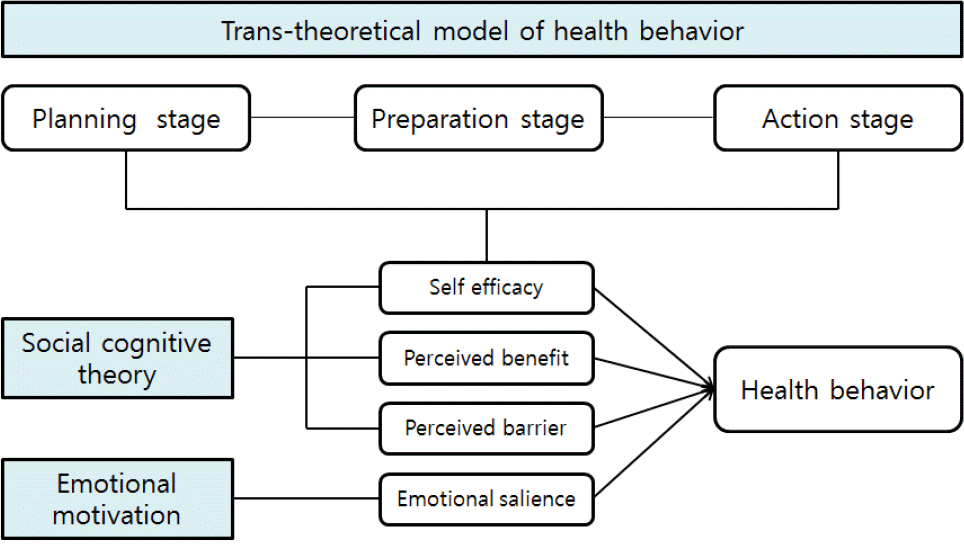
Table 1.
General Characteristics of Participants according to the Stages of Behavioral Change (N=239)
| Variables | Categories | Planning (n=84) | Preparation (n=74) | Action (n=81) | Total (N=239) | x2 or F (p) |
|---|---|---|---|---|---|---|
| n (%) or M± SD | n (%) or M± SD | n (%) or M± SD | n (%) or M± SD | |||
| Age (year) | 59.83±12.75 | 57.76±11.87 | 59.44±10.77 | 59.06±11.82 | 0.67 (.513) | |
| Years of formal education received | 11.42±4.20 | 12.54±3.72 | 12.00±3.32 | 11.96±3.78 | 1.75 (.176) | |
| Gender | Male | 38 (45.2) | 31 (41.9) | 46 (56.8) | 115 (48.4) | 2.86 (.145) |
| Female | 46 (54.8) | 43 (58.1) | 35 (43.2) | 124 (51.9) | ||
| Perceived economic status | High | 3 (4.1) | 3 (4.5) | 4 (4.9) | 10 (4.2) | 3.75 (.440) |
| Middle | 59 (70.2) | 58 (78.4) | 65 (80.2) | 182 (76.2) | ||
| Low | 22 (26.2) | 13 (17.6) | 12 (14.8) | 47 (19.7) | ||
| Marital status | Married | 61 (72.6) | 52 (70.3) | 68 (84.0) | 181 (75.7) | 7.86 (.248) |
| Single/others | 23 (27.4) | 22 (29.8) | 13 (16.0) | 58 (24.3) | ||
| Chronic illness† | Arthritis | 19 (22.6) | 17 (23.0) | 17 (21.0) | 53 (22.2) | 1.97 (.741) |
| Neuralgia | 12 (14.3) | 2 (2.7) | 4 (4.9) | 18 (7.5) | 8.76 (.013) | |
| Respiratory disease | 5 (6.0) | 6 (8.1) | 4 (4.9) | 15 (6.3) | 0.68 (.710) | |
| Vascular disease | 22 (26.2) | 20 (27.0) | 29 (35.8) | 71 (29.7) | 2.19 (.334) | |
| Others | 8 (9.5) | 1 (1.4) | 10 (12.3) | 19 (7.9) | 6.82 (.033) | |
| Family history† | Diabetes | 24 (28.6) | 18 (24.3) | 30 (37.0) | 72 (30.1) | 3.11 (.210) |
| Hypertension | 29 (34.5) | 32 (43.2) | 31 (38.3) | 92 (38.5) | 1.26 (.531) | |
| Cardiovascular disease | 8 (9.5) | 4 (5.4) | 10 (12.3) | 22 (9.2) | 2.24 (.326) | |
| Others | 7 (8.3) | 5 (6.8) | 4 (4.9) | 16 (6.7) | 0.76 (.683) | |
| Risk factors of metabolic syndrome† | Central obesity | 69 (82.1) | 65 (87.8) | 67 (82.7) | 201 (84.1) | 1.13 (.568) |
| High triglycerides | 52 (61.9) | 51 (68.9) | 46 (56.8) | 149 (62.3) | 2.43 (.296) | |
| Low HDL cholesterol | 47 (56.6) | 40 (54.1) | 40 (49.4) | 128 (53.6) | 0.56 (.755) | |
| Insulin resistance | 47 (56.6) | 38 (51.4) | 48 (60.0) | 134 (56.1) | 0.72 (.696) | |
| High blood pressure | 69 (82.1) | 57 (78.1) | 66 (81.5) | 193 (80.8) | 0.15 (.924) | |
| Health perception compared to peers | Much worse | 19 (22.6) | 6 (8.1) | 8 (9.9) | 33 (13.8) | 13.14 (.107) |
| Worse | 34 (40.5) | 29 (39.2) | 29 (35.8) | 92 (38.5) | ||
| Similar | 24 (28.6) | 27 (36.5) | 31 (38.3) | 82 (34.3) | ||
| Better/much better | 7 (8.3) | 11 (16.3) | 13 (16.1) | 32 (13.4) | ||
| Smoking status | Never | 47 (56.0) | 46 (62.2) | 44 (54.3) | 137 (57.3) | 4.35 (.361) |
| Quit | 16 (19.2) | 17 (23.0) | 23 (28.4) | 56 (23.4) | ||
| Current smoker | 21 (24.9) | 11 (14.9) | 14 (16.3) | 46 (19.2) | ||
| Exercise habits | None or rarely | 57 (71.2) | 21 (25.3) | 6 (7.9) | 84 (35.1) | 151.99 (<.001) |
| Irregularly | 21 (26.3) | 45 (54.2) | 8 (10.5) | 74 (31.0) | ||
| Regularly >2 times a week | 2 (2.5) | 17 (20.5) | 62 (81.6) | 81 (33.9) | ||
Table 2.
Performance of Health Behaviors according to the Stages of Behavioral Change (N=239)
Table 3.
Motivation Factors according to the Stages of Behavioral Change (N=239)
Table 4.
Motivation Factors to Predict Health Behaviors according to the Stages of Behavioral Change (N=239)
 XML Download