Abstract
Objectives
To evaluate variations in matrix metalloproteinase (MMP) expression levels according to the disc location in patients with sequestrated lumbar disc herniation.
Summary of Literature Review
MMPs are considered to be the major catabolic enzymes in the intervertebral disc. MMPs have been known to be the primary mediators of extracellular matrix (ECM) degradation, to play major roles in disc degeneration by changing the collagens and the extracellular matrix, and to be involved in the processes of apoptosis and autoresorption of herniated disc materials by inducing inflammatory cytokines.
Materials and Methods
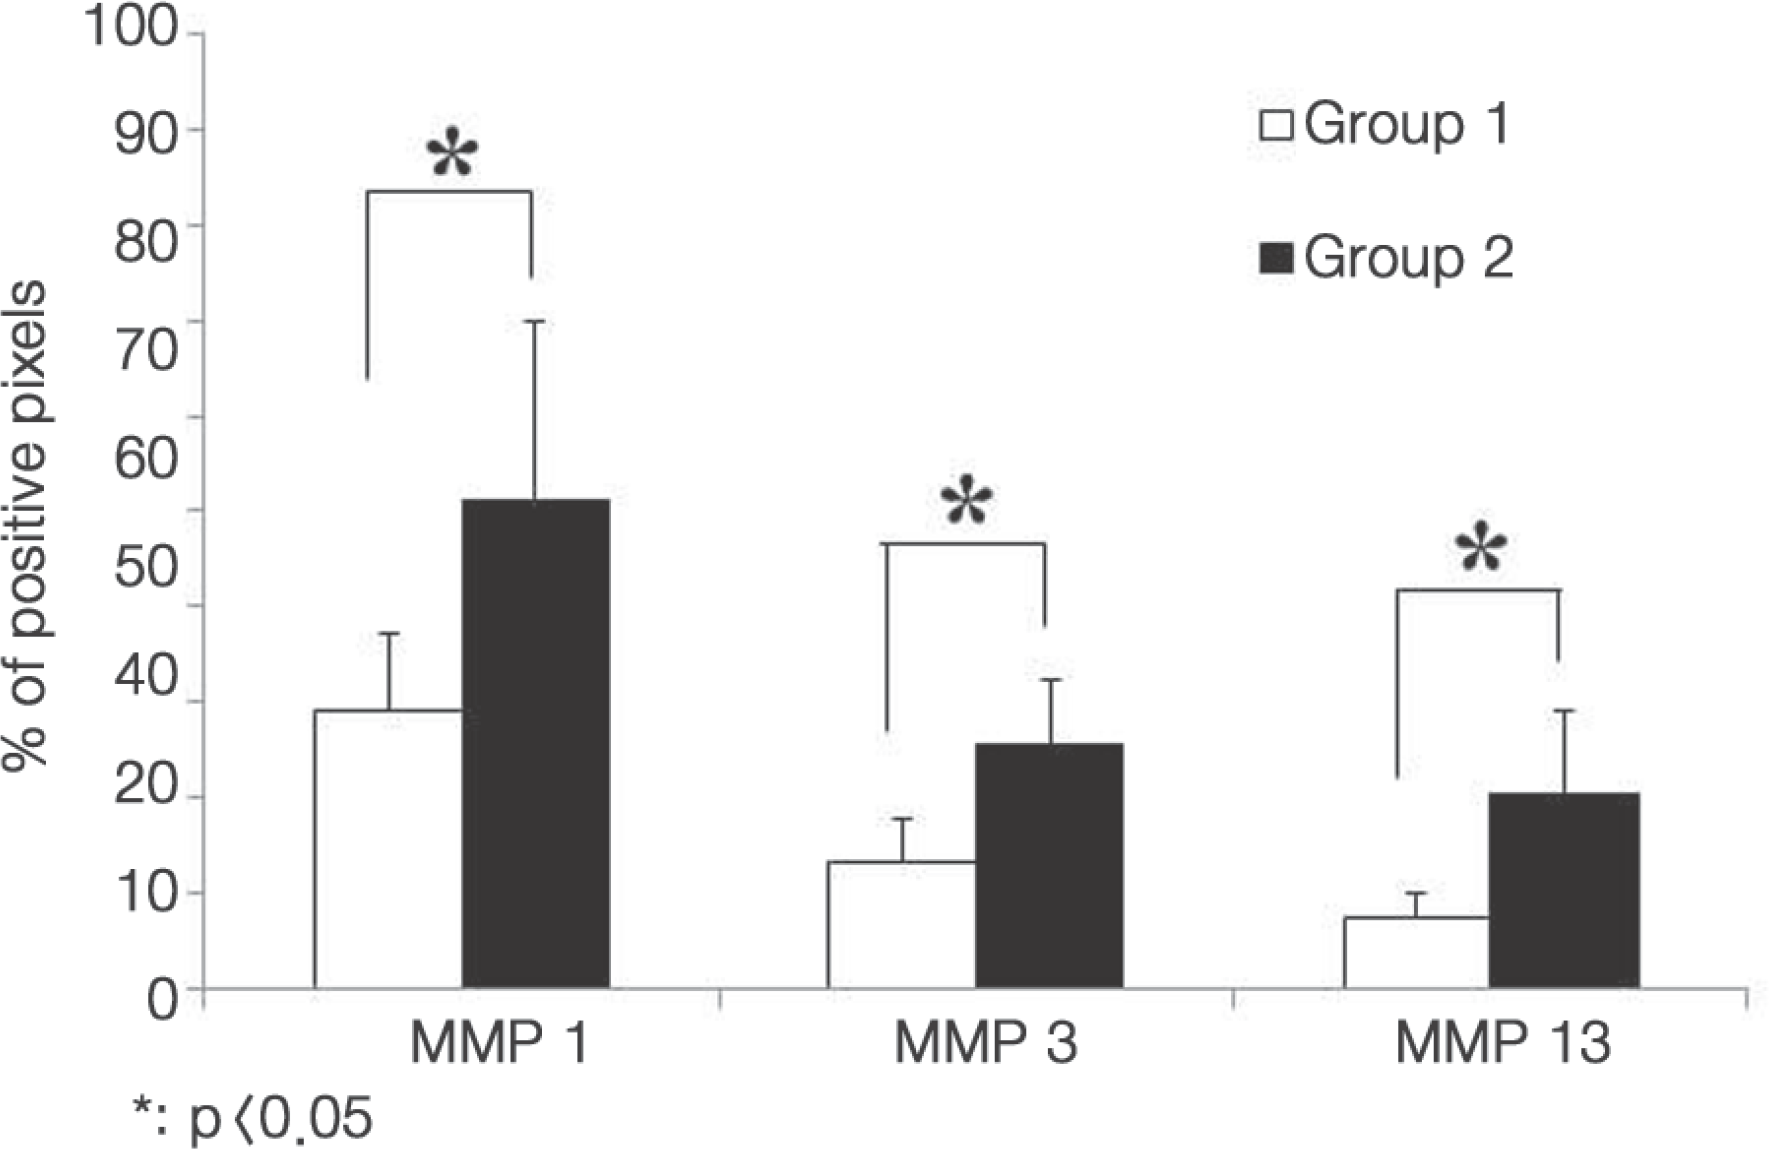
The sequestered and contained disc materials were removed from seven patients with sequestered lumbar disc herniations. The materials from the contained discs were classified into group 1 and those of the sequestered discs into group 2. Immunochemistry tests were conducted for the tissues of both groups. The expression levels of MMP-1, 3, and 13 were checked using a fluorescence microscope. The amount of expression of each MMP was calculated using the percentage of expressed cells and analyzed statistically.
Go to : 
REFERENCES
1. Visse R, Nagase H. Matrix metalloproteinases and tissue inhibitors of metalloproteinases: structure, function, and biochemistry. Circ Res. 2003; 92:827–39.
2. Cawston T, Carrere S, Catterall J, et al. Matrix metalloproteinases and TIMPs: properties and implications for the treatment of chronic obstructive pulmonary disease. No-vartis Found Symp. 2001; 234:205–18.

3. Nagase H, Visse R, Murphy G. Structure and function of matrix metalloproteinases and TIMPs. Cardiovasc Res. 2006; 69:562–73.

4. Fillmore HL, VanMeter TE, Broaddus WC. Membrane-type matrix metalloproteinases (MTMMPs): expression and function during glioma invasion. J Neurooncol. 2001; 53:187–202.
5. McCawley LJ, Matrisian LM. Matrix metalloproteinases: they're not just for matrix anymore! Curr Opin Cell Biol. 2001; 13:534–40.
6. Vo NV, Hartman RA, Yurube T, et al. Expression and regulation of metalloproteinases and their inhibitors in intervertebral disc aging and degeneration. Spine J. 2013; 13:331–41.
7. Weiler C, Nerlich AG, Zipperer J, et al. 2002 SSE Award Competition in Basic Science: expression of major matrix metalloproteinases is associated with intervertebral disc degradation and resorption. Eur Spine J. 2002; 11:308–20.

8. Gruber HE, Ingram JA, Hanley EN Jr. Immunolocalization of MMP-19 in the human intervertebral disc: implications for disc aging and degeneration. Biotech Histochem. 2005; 80:157–62.

9. Le Maitre CL, Freemont AJ, Hoyland JA. Localization of degradative enzymes and their inhibitors in the degenerate human intervertebral disc. J Pathol. 2004; 204:47–54.

10. Richardson SM, Doyle P, Minogue BM, et al. Increased expression of matrix metalloproteinase-10, nerve growth factor and substance P in the painful degenerate intervertebral disc. Arthritis Res Ther. 2009; 11:R126.

11. Roberts S, Caterson B, Menage J, et al. Matrix metalloproteinases and aggrecanase: their role in disorders of the human intervertebral disc. Spine (Phila Pa 1976). 2000; 25:3005–13.
12. Bachmeier BE, Nerlich A, Mittermaier N, et al. Matrix metalloproteinase expression levels suggest distinct enzyme roles during lumbar disc herniation and degeneration. Eur Spine J. 2009; 18:1573–86.

13. Crean JK, Roberts S, Jaffray DC, et al. Matrix metalloproteinases in the human intervertebral disc: role in disc degeneration and scoliosis. Spine (Phila Pa 1976). 1997; 22:2877–84.

14. Le Maitre CL, Freemont AJ, Hoyland JA. Human disc degeneration is associated with increased MMP 7 expression. Biotech Histochem. 2006; 81:125–31.

15. Tsarouhas A, Soufla G, Katonis P, et al. Transcript levels of major MMPs and ADAMTS-4 in relation to the clinico-pathological profile of patients with lumbar disc herniation. Eur Spine J. 2011; 20:781–90.

16. Genevay S, Finckh A, Mezin F, et al. Influence of cytokine inhibitors on concentration and activity of MMP-1 and MMP-3 in disc herniation. Arthritis Res Ther. 2009; 11:R169.

Go to : 
Figures and Tables%
 | Fig. 1.Results of immunohistochemistry for specimens (100×). The bright areas indicate the increased fluorescence intensity for the expression of each MMP. The expression of MMP-1 (A), -3 (B), and -13 (C) in group 1 was observed. In group 2, the expression of MMP-1 (D), MMP-3 (E), and MMP-13 (F) was increased much more than that of group 1. |
 | Fig. 2.Variation in MMP expression in each group. Positive pixels indicate increased fluorescence intensity of more than 50%. The quantified expression of MMPs was calculated using the percentage of positive pixels with respect to the reference pixels. |
Table 1.
The Qualified Expressions of MMPs were Calculated by the Percentages of Positive Pixels to the Reference Pixels


 PDF
PDF ePub
ePub Citation
 Print
Print


 XML Download