Abstract
Objective
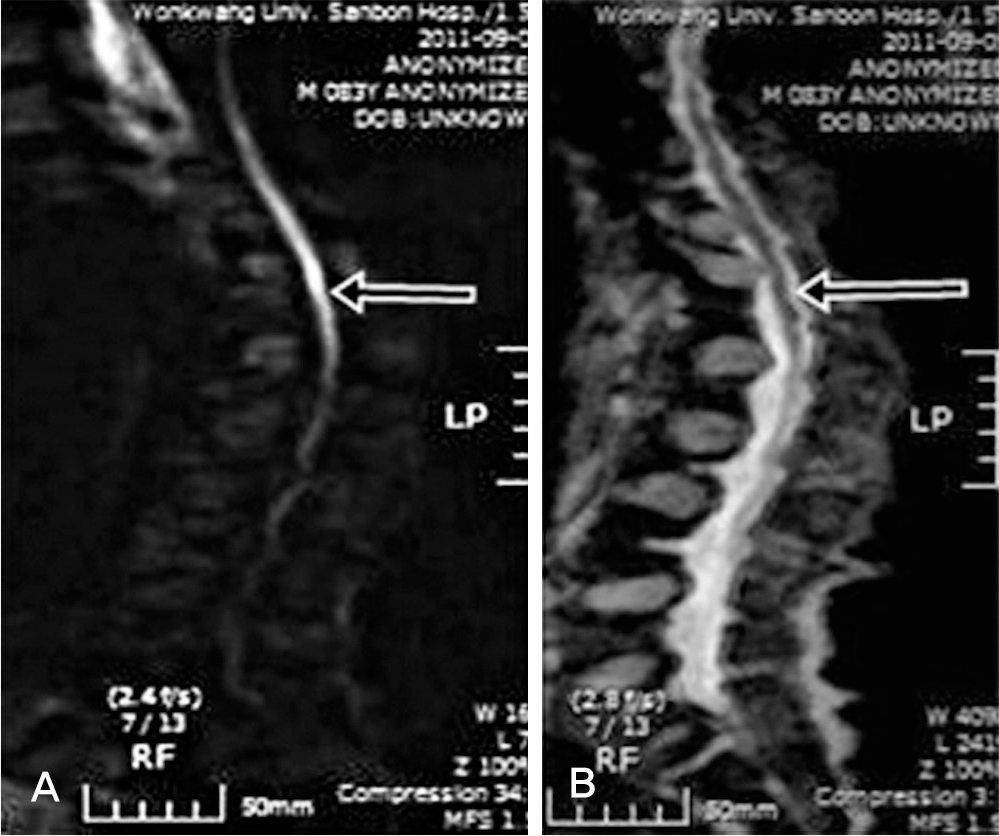
We present a rare case of acute spinal cord infarction and usefulness of diffusion weighted MR imaging.
Summary of Literature Review
T1-weighted and T2-weighted images are often normal in a patient with acute spinal cord infarction.
Material and Methods
An 82-year-old presented with acute onset of paraplegia and urinary retention. His symptoms developed 6 days ago without any trauma. He had a history of vertebroplasty due to compression fracture of 12th thoracic vertebral body 6 years ago. There was no evidence of spinal cord compression on routine T1-and T2-weighted MRI.
Go to : 
REFERENCES
1. Loher TJ, Bassetti CL, Lö vblad KO, et al. Diffusion-weight-ed MRI in acute spinal cord ischaemia. Neuroradiology. 2003; 45:557–61.

2. Thurnher MM, Bammer R. Diffusion-weighted MR imaging (DWI) in spinal cord ischemia. Neuroradiology. 2006; 48:795–801.

3. Weidauer S, Nichtweiss M, Lanfermann H, Zanella FE. Spinal cord infarction: MR imaging and clinical features in 16 cases. Neuroradiology. 2002; 44:851–7.

4. Zhang J, Huan Y, Qian Y, Sun L, Ge Y. Multishot diffusion-weighted imaging features in spinal cord infarction. J Spinal Disord Tech. 2005; 18:277–82.
Go to : 
 | Fig. 1.(A) T2-weighted sagittal image shows a strip like intramedullary high-signal intensity in the spinal cord. (B) and T1-weighted image shows no remarkable signal changes in the cord. (C) An axial T2-weighted image at the level of T12 show an symmetric intramedullary hyperintensy lesion. (D) An axial T1-weighted image at the level of T12 shows no abnormal signal changes. |


 PDF
PDF ePub
ePub Citation
 Print
Print


 XML Download