I. Introduction
II. Methods
1. Variable Extraction
Price: Information was gathered regarding whether the app is free or must be purchased.
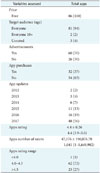
User group: Information was recorded about the target user group for whom the app was designed. The target user categories identified included everyone, everyone 10+, unrated.
Advertisements: Information was gathered on whether the apps supported internal advertisements. Results were recorded as Yes or No.
App purchases: Information was recorded on whether purchases could be made within the apps. Results were recorded as Yes or No.
App updates: Information was recorded on the most recent year in which updates to the available apps were made.
App ratings: Only apps having a rating of 4 and above were included and were further categorized into two groups based on ratings: 4 to 4.5 and higher than 4.5. The highest rating for apps on Google Play Store is 5. Our basis of choosing apps with a rating of 4 and above was to reflect the apps showing the highest user satisfaction rates.
Number of raters: Information was recorded about the number of ratings the apps had received.
Number of apps installed: Information was recorded about the number of times each app had been downloaded.
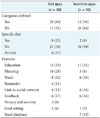
App highlight categories: Information was recorded about the various features of the diet and nutrition apps available in the Google Play Store.
2. Statistical Analysis
III. Results
1. Stratified Analysis of Unique Diet and Nutrition Apps (n = 72)
Based on ratings: The average rating of the diet apps (n = 36) was 4.4 in comparison to the average rating of 4.3 for the nutrition apps (n = 36). Similarly, the average number of ratings for the nutrition apps was much higher than that of the diet apps (29,091 vs. 22,394). The average range of installations for the nutrition apps was 5,000 to 10,000, which was much lower than the 100,000 to 500,000 range in both text and tables for the diet apps.
Based on recent updates: Results showed that 49% (n = 35) of the diet or nutrition apps had been most recently updated in 2017. Approximately 26% (n = 36) of both the diet and nutrition apps had been most recently updated in 2015 or earlier. A comparative analysis of the diet and nutrition apps showed that more of the diet apps (72%, n = 26) had been recently updated in comparison to the nutrition apps (66%, n = 24).
Based on target users: One hundred percent of the diet apps were targeted to everyone, as compared to 8% (n = 3) of the nutrition apps that were unrated (Table 2).
Based on advertisements: Similar percentages of diet (72%, n = 26) and nutrition apps (75%, n = 27) featured advertisements within the apps (Table 2).
Based on app purchases: Diet apps tend to have much higher in-app purchase capabilities as compared to the nutrition apps (36% vs. 19%) (Table 2).


 PDF
PDF ePub
ePub Citation
 Print
Print


 XML Download