

 PDF
PDF ePub
ePub Citation
 Print
Print


I. Introduction
A biosignal is any continually measured and monitored signal from the body, such as electrocardiograph (ECG), continually measured arterial blood pressure (ABP) or central venous pressure (CVP), and photoplethysmograph to measure peripheral oxygen saturation (SpO2). These data can provide important physiological data in real time with high resolution and are becoming increasingly important [1].
The data types described above can be used to predict or determine patient status. Because these data are mainly captured in intensive care units (ICUs), much research has focused on predicting patient outcomes, such as mortality within 24 hours, bleeding, urgent intubation, or sepsis [23]. Another type of study aimed to determine the serum potassium level without blood sampling by analyzing single-lead ECG signals [4].
A team working at the Laboratory for Computational Physiology of the Massachusetts Institute of Technology has collected and constructed a biosignal database named MIMIC and have made these data available to the public [56]. This database has contributed not only to biomedical research but also to electronic, engineering, and computer science research. However, the data source was limited to one institute, which hinders cross validation or implementation in other institutes. Therefore, we developed a biosignal database, the contents of which were gathered mainly from Korean populations.
Several issues must be overcome to develop an integrated biosignal database incorporating data from different ICUs and systems. First, different monitoring systems may be in use within the same institute. Moreover, one ICU might have a central monitoring system that can temporarily store raw waveform data. However, systems in other ICUs may lack the ability to store raw data. Second, monitoring systems are typically independent of Electronic Medical Records (EMRs). Therefore, if biosignal and EMR data cannot be mapped, their utility for biomedical research, such as the development of disease prediction models or the discovery of novel biomarkers, is limited.
We aimed to develop a biosignal database comprising data collected from different systems. Use of a unified data format enables biosignal data to be accessed without the need to consider its source. We demonstrated the utility of our system using two software applications.
II. Case Description
The study protocol was approved by the Ajou University Hospital Institutional Review Board (No. AJIRB-MEDMDB-16-155).
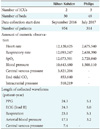
The study was performed in a tertiary teaching hospital with 1,185 beds in Suwon, Korea. The hospital has 12 ICUs with 205 beds, in which General Electronics, Nihon Kohden, and Philips patient monitoring systems are used. The Nihon Kohden (30 beds) and Philips (49 beds) systems were used in this study.
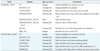
To integrate the data from the two monitoring systems, we defined a unified data format (Table 1) comprising (1) metadata, such as measurement location, time, type of biosignal etc., which are stored in a relational database, and (2) raw signal waveform data that cannot be stored in a relational database because of the high frequency of the measurements. For example, ECG signals are measured at 250 and 500 Hz by the Nihon Kohden and Philips systems, respectively. Therefore, raw waveform data are stored in CSV files. To reduce redundancy, we recorded only the measurement start time in the CSV file name, not the timestamp of each measurement. Because every 10-second data was recorded in a single row, the user can easily recognize the frequency at which the data were recorded. For example, if there are 2,500 values in a single row, it indicates that the data were recorded at 250 Hz. Therefore, data recorded at a specific time can be accessed using the file name and the location of the value in the file. Each file was separated in every 10-minute recording period.
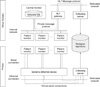
The Nihon Kohden system has a central monitoring system that collects and saves all signal waveform data for up to 5 days, and it transmits data using the HL7 message protocol (Figure 1). Temporarily stored waveform data were transferred to permanent storage using software based on the HL7 protocol.
The Philips system is also a central monitoring system; however, it does not have storage or transfer functions. To overcome this, we installed an RS232 interface board on each patient monitor to communicate with the data collection server in real time (Figure 1). Biosignal data are stored on the server temporarily, transformed into a unified format, and transferred to permanent storage every 10 minutes, as with the Nihon Kohden system.
From September 1, 2016 to August 31, 2017, we collected around 117 patient-years of biosignal data from 1,268 patients. Details on the data collected are provided in Table 2.
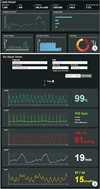
We developed two application software packages for our biosignal database: a dashboard that provides information on the current status of the database, and a data viewer (Figure 2). Both applications functioned as expected, and we experienced no issues with compatibility.
III. Discussion
We report here a system for collecting and storing biosignal data from different patient monitoring environments, unification of those data formats, and the utility of these data for further study or applications.
To be clinically useful, biosignal data should be linked to an EMR database. To achieve this, we used two strategies. First, ICU nurses enter the patient identification (ID) into the monitoring system, which is encrypted using the same algorithm applied to EMR data. Because IDs may be incorrect, our system can recognize the bed location where each device was installed along with the timestamp and link this with a specific patient ID.
The database can be used for prediction or determination of disease state (e.g., cardiac arrest or sepsis) or a specific value (e.g., serum potassium level) [24]. It will likely also contribute to drug post-market surveillance. Prolongation of the QT interval on ECG is a critical adverse drug event, but determining the relationship between a certain drug and QT prolongation is generally hampered by the lack of ECG data at the time of drug administration. However, our database can provide ECG data for a patient throughout their ICU stay.
We plan to develop diverse prediction and determination models using the database. We also plan to make the database (including both waveform and EMR data) available to the public to foster collaboration among researchers in various disciplines. We expect that our system will overcome the problems associated with MIMIC databases, such as the lack of cross validation data.
In this paper, we described the current status biosignal data collection in a tertiary teaching hospital in Korea, and introduced how we overcame it with our system. While biosignal data is an important source of artificial intelligence for health care [789], discussions are still ongoing to collect and store large volumes of biosignal data from different monitoring systems and to prepare them as data sets for future analysis [10]. We expect that this study could provide an opportunity advance these discussions.
Our system had several limitations. First, there is a 10-minute interval between data collection and storage in the repository, which is necessary for the unification of data formats from different monitoring systems. This limits the ability of the system to provide real-time analysis and feedback. However, this issue does not hamper the use of our system for research, such as the development of prediction algorithms. For practical application of the developed algorithm, the interval required for data collection and unification must be reduced. Second, data measurement and transmission involves the generation of noise or a faulty signal. We plan to develop a machine learning-based filtering model by tagging randomly sampled signals; this model will be capable of determining whether a signal is suitable for use. We aim to use this model to estimate the probability of a signal being unsuitable when the waveform data are made available to the public.
In conclusion, we developed a system for collecting waveform data from different patient monitoring systems, on which software applications can be run without compatibility problems due to the use of unified data format. The database will facilitate the development of diverse algorithms and contribute to improved patient health outcomes.
 XML Download