

 PDF
PDF ePub
ePub Citation
 Print
Print


I. Introduction
Based on data from the World Health Organization, cardiovascular disease is a major health problems in both developed and developing countries. Diagnosis to determine the level/type of coronary heart disease is very important, so that appropriate action can be taken. Intelligence systems can be used to provide diagnosis support. Research results have shown that the use of clinical decision support systems can help physicians deliver improved clinical practice [1] and also can reduce the occurrence of faulty diagnoses [2]. Intelligence diagnosis system development is in need of existing clinical data as training data, in this case, data specifically related to coronary heart disease. Unfortunately, the availability of data was minimal for a certain level/type compared the amount of data for the other level/type. The conditions have resulted in imbalanced data, and imbalanced data has become an interesting issue in bioinformatics [3] and machine learning.
Intelligence systems for clinical decision support have been developed, especially for the prediction and diagnosis of coronary heart disease, using a variety of computational intelligence algorithms. A coronary heart disease prediction system may be used to predict the incidence of coronary heart disease in the future. Predictions are made based on risk factors, such as age, cholesterol, blood pressure, sex, smoking habits, and history of diabetes. Prediction methods may use algorithms originally created for data mining or computational intelligence [45], or they may employ the standard Framingham risk score, SCORE, and PROCAM [6]. Diagnosis requires some the observation of symptoms as well as tests, such as electrocardiography, scintigraphy, and fluoroscopy. Much research has been done to develop diagnostic systems, and these studies have used several algorithms from computational intelligence, including the ensemble algorithm [789], neural networks (NN) [1011], fuzzy systems [121314151617], support vector machine (SVM) [181920], genetic algorithms [21], particle swarm optimization (PSO) [22] and other classification algorithms [2324]. Unfortunately, these studies have been limited to proposing model diagnosis systems with a system output of healthy or sick. Such systems use a binary classification approach and sue the dataset of coronary heart disease from the Univeristy of California Irvine (UCI) repository [25]. The dataset can be grouped into two levels, namely, healthy and sick, based on the observation of blood vessel constriction. If narrowing is more than 50% then the patient is classified as sick, and if it is less than 50% then the patient is classified as healthy. The amounts of data related to sick and healthy patients are relatively balanced, so the system intelligence preformance in these studies has been relatively good.
Referring to the dataset of the UCI repository, the data can also be grouped into several sub-types or levels, that is healthy, sick-low, sick-medium, sick-high and sick-serious [1426]. Further research was needed regarding the diagnosis of the level or type of coronary heart disease. Such research was conducted by Nahar et al. [27]. Their study on coronary heart disease diagnosis was based on computational intelligence, and the algorithms used included support vector machine optimization (SMO), AdaBoostM1, J48, naive Bayesian, IBK, and PART. In their approach, multiclass classification problems are converted to binary classification problems. The approach refers to the ability of the SMO classification algorithm, which is suitable for binary classification [27]. Implementation of the system is done by training and testing at every level of coronary heart disease. When the system is trained to recognize a healthy level, the healthy level is labeled positive, while the other levels (low, medium, high, and serious) are labeled negative. Thus, there are only two training labels, positive and negative. This applies equally in testing. For example, when testing the system at the medium level, the level is made positive, while the other is negative, regardless of whether the data is at the level of healthy, sick-low, sick-high or sick-serious.
Subsequent research was conducted by Akrami et al. [28], who used a concept similar to that used by Nahar et al. [27], which converted multiclass classification into binary classification. The differences between these studies is the method of 10-fold cross-validation. The research by Akrami et al. [28] used 10-fold cross-validation each run 100 times, while in the study by Nahar et al. [27] they were run just once. The next differences is the significant test methods used for classification using the t-test. The research by Akrami et al. [28] was able to improve the performance of the true positives rate (TPR) and F-measure parameters. The t-test results showed that the best performance classification method was SMO. The same approach was also adopted by Prabowo et al. [29]. The research also investigated the performance of the algorithm computational intelligence. This research differentiated between the research of Nahar et al. [27] and Akrami et al. [28]. The differences are the process of randomization before the 10-fold cross-validation. The process was repeated 10 times, so the end result was the average of the 10 times. The concept, which is similar to that of Nahar et al. [27] was also adopted by Setiawan et al. [30]. This research compared the performance of feature selection methods in classifying 5 levels of coronary heart disease using the naive Bayesian classification method and J48 (C4.5).
The studies that use the approach of converting multiclass classification to binary classification for the diagnosis of coronary heart disease achieved relatively good accuracy. Unfortunately, the parameters of good accuracy do not match with the parameters of TPR and F-measure. Both parameters were low for the diagnosis of sick-low levels, sick-medium, high-sick and sick-serious, indicating that the system only has the ability to have a high true negatives rate (TNR). Research conducted by Choi [31] demonstrated that the success of a classification method is determined by the data used for training and testing. Data that is not balanced between classes will result in imbalanced data. Imbalanced classification data can result in a good prediction accuracy of data class training with large numbers of members; however, the number of class members having little accuracy is not good [31].
Referring to previous research, this paper proposes an intelligence system to diagnosis coronary heart disease level by considering the imbalanced data and multiclass classification approach. To solve the imbalanced data problem of the distribution of data for each level of CAD, preprocessing is carried out with resampling, non-stratified random sampling, the synthetic minority over-sampling technique (SMOTE), deletion of data that does not match the range of attributes, and the elimination of duplicate data. The next step is dividing the CAD data for training and testing the concept of k-fold cross-validation. Classification is done by using the K-star algorithm, while the performance parameters are measured in terms of sensitivity, specificity, positive prediction value (PPV), negative prediction value (NPV), area under the curve (AUC), and F-measure.
II. Methods
1. Data and Data Processing
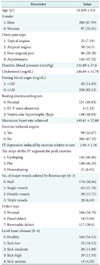
Research on intelligence systems for the diagnosis of coronary heart disease levels has used patient data from the UCI repository [25]. The coronary heart disease data was obtained from Roberto Detrano, MD, PhD, which is a collection of data from the VA Medical Center. Coronary heart disease is distributed into five levels or types, namely, healthy, sick-low, sick-medium, sick-high, and sick-serious [1421]. The data comprised 303 intances of data and 14 parameters, with one parameter as an indication of the level of heart disease on a scale of 0–4. The parameters used are shown in detail in Table 1.
2. Synthetic Minority Over-sampling Technique
As seen in Table 1, coronary heart disease data distribution among levels is imbalanced, so in this study data imbalanced was observed. This problem was solved by using the over-sampling approach. This sampling technique is based on research by Chawl et al. [32] and is known as SMOTE. This technique can increase the amount of data in the minority in the original data, by creating mock data to expand the area of decision-making to the minority class.
There are several step in the process of solving the data imbalance problem. In the first step, the existing data is resampled to estimate the accuracy of the statistical sample or provide a picture at random with replacement using data from a subset of the available data. The second step is done by SMOTE to balance the data of each class minority. The SMOTE parameter used in this study was k = 5 (nearest neighbors), and the value of the over-sampling rate was adjusted by the amount of data for each level, using the healthy level as a reference. This means that the healthy level established using SMOTE.
Result resampling and the SMOTE process resulted in some things against coronary heart disease data. First the resampling process produces a better data distribution, but it results in the duplication of coronary heart disease data. Second, the SMOTE process is used to obtain duplication of data, so the data becomes balanced. The SMOTE process also produces attributes whose values are not within the range of the attribute values. To overcome this, after the SMOTE and resmpling steps, the duplicate data is removed along with the data attributes whose values exceed the limit. After this process, the data is ready to classify with the K-star algorithm.
3. Model Intelligence System Based K-Star Classifier
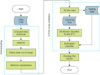
The model level intelligence system for the diagnosis of coronary heart disease is shown in Figure 1. Intelligence systems use classification algorithms, such as the multilclass K-star (K*). The K* algorithm can be defined as a clustering method that divides n data into k clusters, where each data entry in a particular cluster with an average viewing distance nearby. The K* algorithm is an instance-based learner algorithm that uses entropy to measure the distance [33]. The advantages of using entropy are that it provides a consistent approach to dealing with real-valued attributes, symbolic and missing values. The K* algorithm is similar to the k-NN algorithm, in that it uses entropy to measure the closeness of data.
4. Performance Evaluation of the K-Star Intelligence System Based on Classification
Performance evaluation of the system intelligence diagnosis of coronary heart disease was done by dividing the data into k subsets. Each subset contained the data of each class. Then, from the k-subsets, one subset was taken for testing, and k–1 subset was taken for training. This was done alternately so that each subset was used for testing. The k value used in this study for testing was k = 10, so the performance was the average result from 10 times training and testing. Performance was measured in terms of sensitivity, specificity, PPV, NPV, AUC, and F-measure. An explanation of each performance parameter is given as follows:
1) Positive prediction value (PPV) is the number of positive samples correctly categorized as positive divided by the total testing data sample classified as positive.

2) Negative Prediction Value (NPV) is the number of negative samples correctly categorized as negative divided by the total testing data sample classified as negative.

3) Sensitivity is the number of positive samples correctly categorized as positive divided by the total testing sample data testing positive
4) F-measure (F1) is the harmonic mean of sensitivity and PPV
III. Results
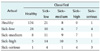
The diagnosis of coronary heart disease levels is a problem that can be solved through the concept of multiclass classification. This approach is appropriate because there are more than two levels of coronary heart disease. The proposed system uses a 5-level classification of coronary heart disease. Testing of the system was done in two stages before classification using the K* algorithm. In the first stage the R-SCOR-RD was not used, while in the second, the R-SCOR-RD was used. The test results produced without using the R-SCOR-RD generated a confused metrics table shown in Table 2.
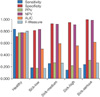
Table 2 was used to determine the values for sensitivity, specificity, PPV, NPV, AUC and F-measure. The calculation results are presented in Figure 2. The performance of the system without the R-SCOR-RD showed that data imbalance occurred. This is demonstrated by the significant performance difference between healthy level with sick-low levels, sick-medium, sick-high, and sick-serious. The differences between amounts of data for each level are relatively high, with ratios between the healthy level and other levels of 1:3, 1:3, 1:5, 1:5 and 1:13. Comparison of the results shows that the best accuracy is achieved with vast amounts of data compared with a small amount of data.
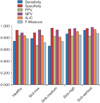
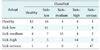
Furthermore, the performance of the proposed system using the R-SCOR-RD before the data were classified was also evaluated. Th results obtained by confusion matrix are shown in Table 3. From the results shown in Table 3, the parameters of performance, sensitivity, specificity, PPV, NPV, AUC, and F-measure were calculated. The calculation results shown in Figure 3. The performance for each level, for the parameters of precision, recall, F-measure and MCC had the same relative value for each level. The R-SCOR-RD process resulted in data ratios of 1:1.4, 1:2.1, 1:1.5, and 1:2.2. Thus, it can be seen that ratio of the amounts data for the healthy level to each other level decreases, while the number of instances of data increased from 303 to 361.
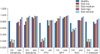
The test results obtained with R-SCOR-RD and without R-SCOR-RD are shown in Figure 4. There were performance differences for each level; only the healthy level showed the same relative performance.
IV. Discussion
In this section we will first discuss the comparison of the diagnosis system using the K* algorithm with R-SCOR-RD (proposed system) treatment and without R-SCOR-RD treatment. Second, we will discuss the comparison of the proposed system with those of previous studies which adopted binary and multiclass classification approaches. The first comparison is the system of diagnosis without conducting R-SCOR-RD before classification. Figure 4 shows that the differences in the parameters of sensitivity, specificity, PPV, NPV, AUC, and F-measure were significant. Based on the test results of statistical significance of the difference by using t-test produces p = 0.00757 (p < 0.05), meaning that there were significant differences before and after using the R-SCOR-RD. The significant difference is explained by the fact that despite the data imbalance problem, machine learning will yield good prediction accuracy classification of the training data classes with large numbers of members, while the number of class members has poor accuracy [31].
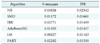
The next point of discussion is comparison with previous studies, which used binary classification approach. First, let us consider the research done by Nahar et al. [27] to compare multiclass classification algorithms with the binary classification approach. The parameters used for comparison are sensitivity (TPR), and F-measure. These two performance parameters were used in both studies and were adjusted to the variables used in both these studies. The comparison results are shown in Tables 4 and 5.
Based on Table 4, the TPR performance in the research by Nahar et al. [27] showed higher sensitivity values for the healthy level with all classification algorithms. That is, the amount of data for the healthy level was more than 3 times higher than the amounts of data for all other levels. As for the other levels, all showed relatively low values for all types of classification algorithms. The proposed system provides relatively similar sensitivity values for all levels, and better results were obtained than all the classification algorithms showed in the research by Nahar et al. [27]. This is shown in Table 6, which demonstrates the significance of the obtained test results. All algorithms had a p < 0.05.
Next is the F-measure parameter. If it refers to Equation (4), then the F-measure trend is not much different from the sensitivity because the F-measure influenced sensitivity (TPR) and PPV. The F-measure generate differed significantly from that observed by Nahar et al. [27], as shown in Table 6, where the p-value was less than 0.05.
The accuracy results of Nahar et al. [27] for all levels were very high for SMO algorithms in contrast to the low sensitivity values. High accuracy with low sensitivity indicates that the accuracy is high due to the high value components specificity (TNR). It is proportional to the difference between the amount of data that is labeled negative and the amount of data that is labeled positive. The condition can be said to indicate data imbalance.
In a future study, we will compare our work with a study done by Akrami et al. [28]. The study used the same concept as Nahar et al. [27], the binary classification approach. The study used 10-fold cross-validation, run as many as 100 times. The addition of this amount can improve system performance in terms of sensitivity and F-measure. When compared with the proposed system, Akrami et al. [28] achieved better results, but the resulting performance was still as good as that of category classification. Similar to the work by Prabowo et al. [29], improved results were obtained for sensitivity and F-measure when the process is done with randomize variable selection for every 10-fold and it is performed 10 times. When compared with the case when no variable selection is carried out, the performance of the propose system is still better in terms of sensitivity and F-measure.
Subsequent research was conducted by Setiawan et al. [30]. Their paper discussed benchmarking several feature selection methods for the diagnosis of coronary heart disease using the naive Bayesian method and J48 (C4.5). The approach also uses binary classification. Performance was measured in their study in terms of accuracy, so it cannot be seen whether specificity or sensitivity is stronger. The average accuracy, however, is similar to that of the proposed system.
In the studies conducted by Nahar et al. [27], Akrami et al. [28], Prabowo et al. [29] and Setiawan et al. [30], multiclass classification was converted to binary classification. Such conversion makes the those systems ineffective. As an illustration, if the system performs a diagnosis with new data, where the level of the data is not yet known, it will be difficult for the system to detect it. If the diagnosis is performed for each system level, it will be possible to have two or more positive or negative outputs, so no conclusion can be made.
The next comparison is with previous research using the multiclass classification approach. Salari et al. [26] proposed a hybrid system using the genetic algorithm, k-nearest neighbor, and backpropagation. That model performs relatively poorly (accuracy is still below 65%). The performance achieved by Salari et al. [26] was not very different from that achieved by Dominic et al. [34]. The study tested several methods of classification, namely naive Bayesian, decision tree, support vector machine, logistic regression, multilayer perceptron, and AdaBoostM1. Both of these studies achieved performance that is relatively low compared to that of the proposed system.
The use of sample preprocessing, SMOTE, and the deletion of data for attribute values exceeding the limit, as well as the elimination of duplicate data (R-SCOR-RD) is able to provide improved performance with the K* algorithm. The resulting performance showed an average sensitivity of 80.1%, specificity of 95%, PPV of 80.1%, NPV of 95%, AUC of 87.5%, and F-measure of 80.1%. The performance is better that that of other systems proposed in previous studies. Many previous studies have used the binary classification approach without consideration the data imbalance problem.


 XML Download