

 PDF
PDF ePub
ePub Citation
 Print
Print


I. Introduction
Recognition of the importance of health information technology (IT) developments, such as Electronic Medical Records (EMRs) and computerized practitioner order entry (CPOE), is increasing, and there is higher investment in health IT than ever before [1]. The United States federal government has made increasing investments in health IT a central part of its healthcare reform initiative to decrease health care costs. In 2009, the Health Information Technology for Economic and Clinical Health (HITECH) Act was signed as a part of the American Recovery and Reinvestment Act to promote the adoption and meaningful use of health IT [2]. The HITECH Act allocated almost US$20 billion to subsidize the adoption of health IT and could potentially result in an IT subsidy of US$2-10 million per hospital [2]. It has already been used to support health IT adoption for eligible providers since 2011.
To deliver healthcare to patients, hospitals require many resources. The complex set of administrative activities and patient treatment processes in the hospital setting makes procedures complicated. Thus, it is hard to track all patient records seamlessly. The complexity of the many processes that occur around a patient increases the likelihood of ordering duplicate or redundant tests, resulting in longer waiting times for providers and patients as well as higher cost. However, health IT may solve such problems by making patient information available where it is needed, supporting better health care decision making and better coordinated care, increasing processing speed, and reducing the likelihood of redundant testing [3].
The benefits of health IT adoption have been demonstrated by many studies [4-8]. Health IT may reduce hospital cost in many ways, through reduction of hospitals stays, redundant tests, medical errors, and administrative expenses. These studies have found a negative relationship between health IT adoption and cost. However, most previous studies on health IT adoption have been based on single leading institutions. This implies that, even if they have correctly measured the effects of health IT, the results are limited to the leading institutions that were involved in the studies. Thus, it is hard to generalize the results to all hospitals. Recently, researchers have examined the relationship between IT adoption and hospital performance using large samples of hospitals [9-20]. They found that health IT adoption could lead to significant benefits for hospitals. However, the results of these studies were inconsistent, which may result from their use of different data sets and different IT applications in each study.
Moreover, most of the previous studies have employed discrete values (0 or 1) of EMR or CPOE adoption as health IT measures [4-8,10-12,14,15,19]. While focusing on these IT measures may clarify the effects of specific IT practices, doing so ignores the fact that hospitals use many different types of IT inputs with different units having different impacts on output. Therefore, to measure the effect of health IT, there needs to be an aggregation across IT inputs [21]. Unlike previous studies focusing on specific IT applications, such as CPOE or EMR, we measure IT capital and IT labor as the dollar amount given on a hospital's balance sheet. This measure captures the overall spending on IT, not a specific application. Moreover, we considered data at the level of individual patients. Using this data, we could also examine the relationship between IT expenditure and cost across patient and disease characteristics. Findings on the effects of health IT expenditure on individual patient-level cost may help guide the development of policies and interventions to ensure the use of health IT. To this end, this study investigates the effect of health IT expenditure on cost at the individual patient level by using California Office of Statewide Health Planning and Development (OSHPD) data obtained from 2000 to 2007 [22]. A traditional cost function was used with hospital fixed effect by introducing health IT explicitly into the cost function and clustered error.
Go to : 
II. Methods
1. Data Source
We used the OSHPD data for 2000 to 2007. The OSHPD data is composed of two parts: hospital and patient. The hospital-level OSHPD data provides hospital characteristics, such as hospital ownership type, number of beds, system affiliation, and teaching status. The OSHPD data is noteworthy for its inclusion of information on health IT expenditure and depreciation, which we used to construct measures of health IT capital and labor [1]. Patient-level OSHPD data provides patient characteristics, total cost, length of stay, admission type, payer source, disposition of patients, and disease characteristics for all hospitalized patients.
We included only patients with routine discharges, including patients scheduled for follow-up care at a physician's office or sent home for hospice care. We excluded all patients transferred to the hospital from another facility, such as a skilled nursing or intermediate facility. Patients who were transferred from facilities near high-quality hospitals have more severe medical conditions, and if expenditure in health IT was correlated with unobserved patient severity, our estimated effect of health IT on cost would be biased [23]. The unit of analysis is the inpatient stay which means one stay from admission to discharge. The final sample included 5,930,955 inpatient stays in 294 unique hospitals.
2. Dependent Variable
The dependent variable (cost per inpatient stay) is defined as the total patient charge multiplied by hospital cost-to-charge ratio. Patient charge does not provide a meaningful resource reflecting the care provided because the cost for a given procedure varies from hospital to hospital. Thus, we employed the cost-to-charge ratio to calculate the cost of hospitals services. The cost-to-charge ratio approach is reportedly the closest to the provider's actual cost [24], and it has been used in several previous studies [20,25-27].
'Total patient charge' is defined as all charges for services rendered during the stay for patient care at the facility, based on the hospital's full established rates. Thus, it includes charges for daily hospital services, ancillary services, other services defined as patient care, prepayments (e.g., deposits and prepaid admissions), bundled ambulatory surgery, outpatient care, and/or observation costs as well as late revenue adjustments [22]. Also, because patient charges are reported only for the last 365 days of stay, an adjusted charge was calculated for individuals staying more than one year: adjusted charge = (patient charge / 365 days) × length of stay (OSHPD). Thus, the adjusted charge represents the amount billed for the stay at the full established rates.
'Cost-to-charge ratio' is defined as the relationship between the cost of providing services and the charges assessed by the hospital for services, and it is calculated by dividing the hospital's total operating expenses by gross patient revenue and total other operating revenue based on the American Hospital Association definition.
3. Independent Variables
As the key explanatory variable, health IT was measured as a dollar amount in both capital and labor related to IT. The OSHPD data places all IT expenditures within the data processing section of financial statements. Health IT capital and IT labor were extracted from each hospital's balance sheet [1]. Health IT capital was defined as
where physical capital represents the hardware, purchased service represents outsourced IT, and lease and rental indicates the licensing of software. The OSHPD data reports depreciation only of health IT physical capital. Thus, to reconstruct the actual physical capital, we used the 5-year straight-line method of depreciation [28].
IT labor was expenditure in data processing and was defined as
Both health IT capital adoption and IT labor employment were measured in dollars.
We also included, as the control variables, patient and disease characteristics, including age, sex, race, and diagnosis related group (DRG) or DRG weight-a measure of the usual amount of inpatient resources consumed by a patient of that type. The five categories of payer source were also included: 1) Medicare (reference), 2) medical, 3) private (payment covered by private, non-profit, or commercial health plans), 4) self-insurance (payment directly by the patient, personal guarantor, relatives, or friends), and 5) other (workers' compensation, indigent programs, other government, and any third-party payment not included above).
4. Analytic Strategy
We employed a traditional cost model with hospital fixed effect. To test the hypothesis that hospitals are using their IT capital and IT labor effectively, we introduced IT capital and labor into the cost function. If hospitals use their IT capital and IT labor efficiently, then IT capital and IT labor must have a negative effect on costs, such as non-IT expenditure. Thus, our model estimates patient cost as a function of IT capital, IT labor, and other patient, disease, and payer source. This is calculated as
where i represents a patient and j hospital; Y is the log of cost; PA represents the vector of patient characteristics, including age (1-17, 18-34, 35-64, 65 and over), sex (female or male), and race (white, black, Asian, and other); D is the log of DRG weight; LOS is the length of stay; and PM is the payer source (Medicare, medical, private, self, and other). Here, ITC and ITL represent the log of IT capital and the log of IT labor, respectively; τ represents time effect; ηj is the time-constant hospital effect; and eij denotes clustered errors. In analyses such as this, there is a clustered effect within hospitals. For example, the error terms for patients from the same hospital are likely to be correlated. In that case, ordinary least square estimates are still unbiased, but standard errors may be downward biased in the finite clustered sample. To address this issue of clustered error, we applied clustered error within hospitals.
Go to :
III. Results
Table 1 shows the characteristics of patient, payer source, DRG weight, and IT capital expenditure. Forty-three percent of patients belonged to the 35-64 age group, 54% were female, almost 60% were white, and 36% had medicare as a payer source. The average DRG weight was 1.127. The average patient cost was US$8,466 per stay. The average IT capital per bed was US$20,300, the average IT labor per bed was US$5,964, and sum of IT capital per bed and IT labor per bed was US$26,264.
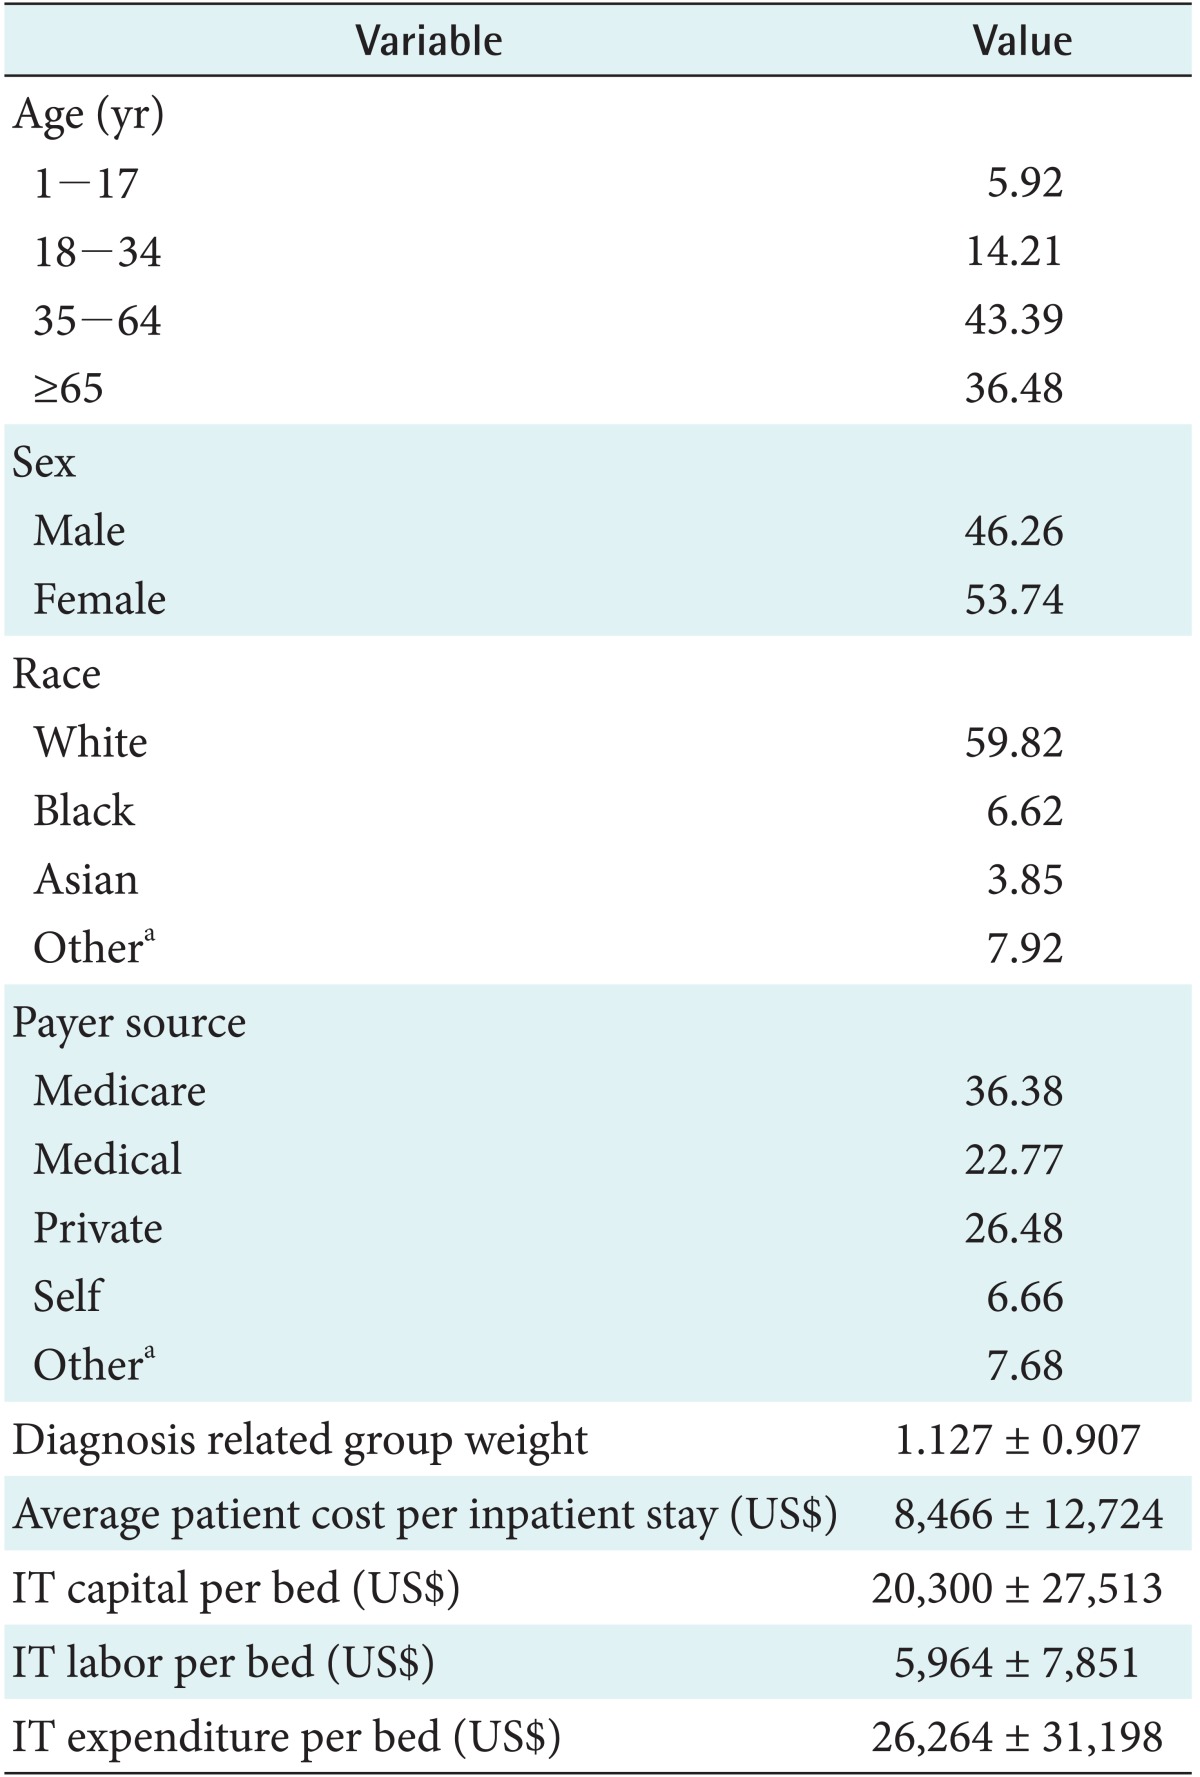
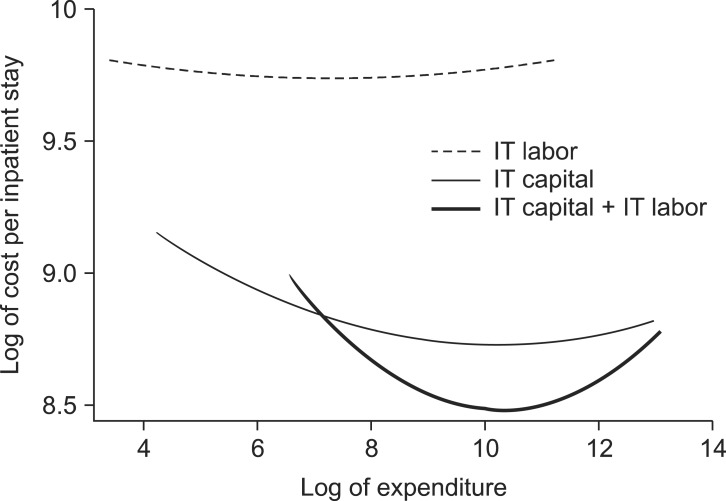
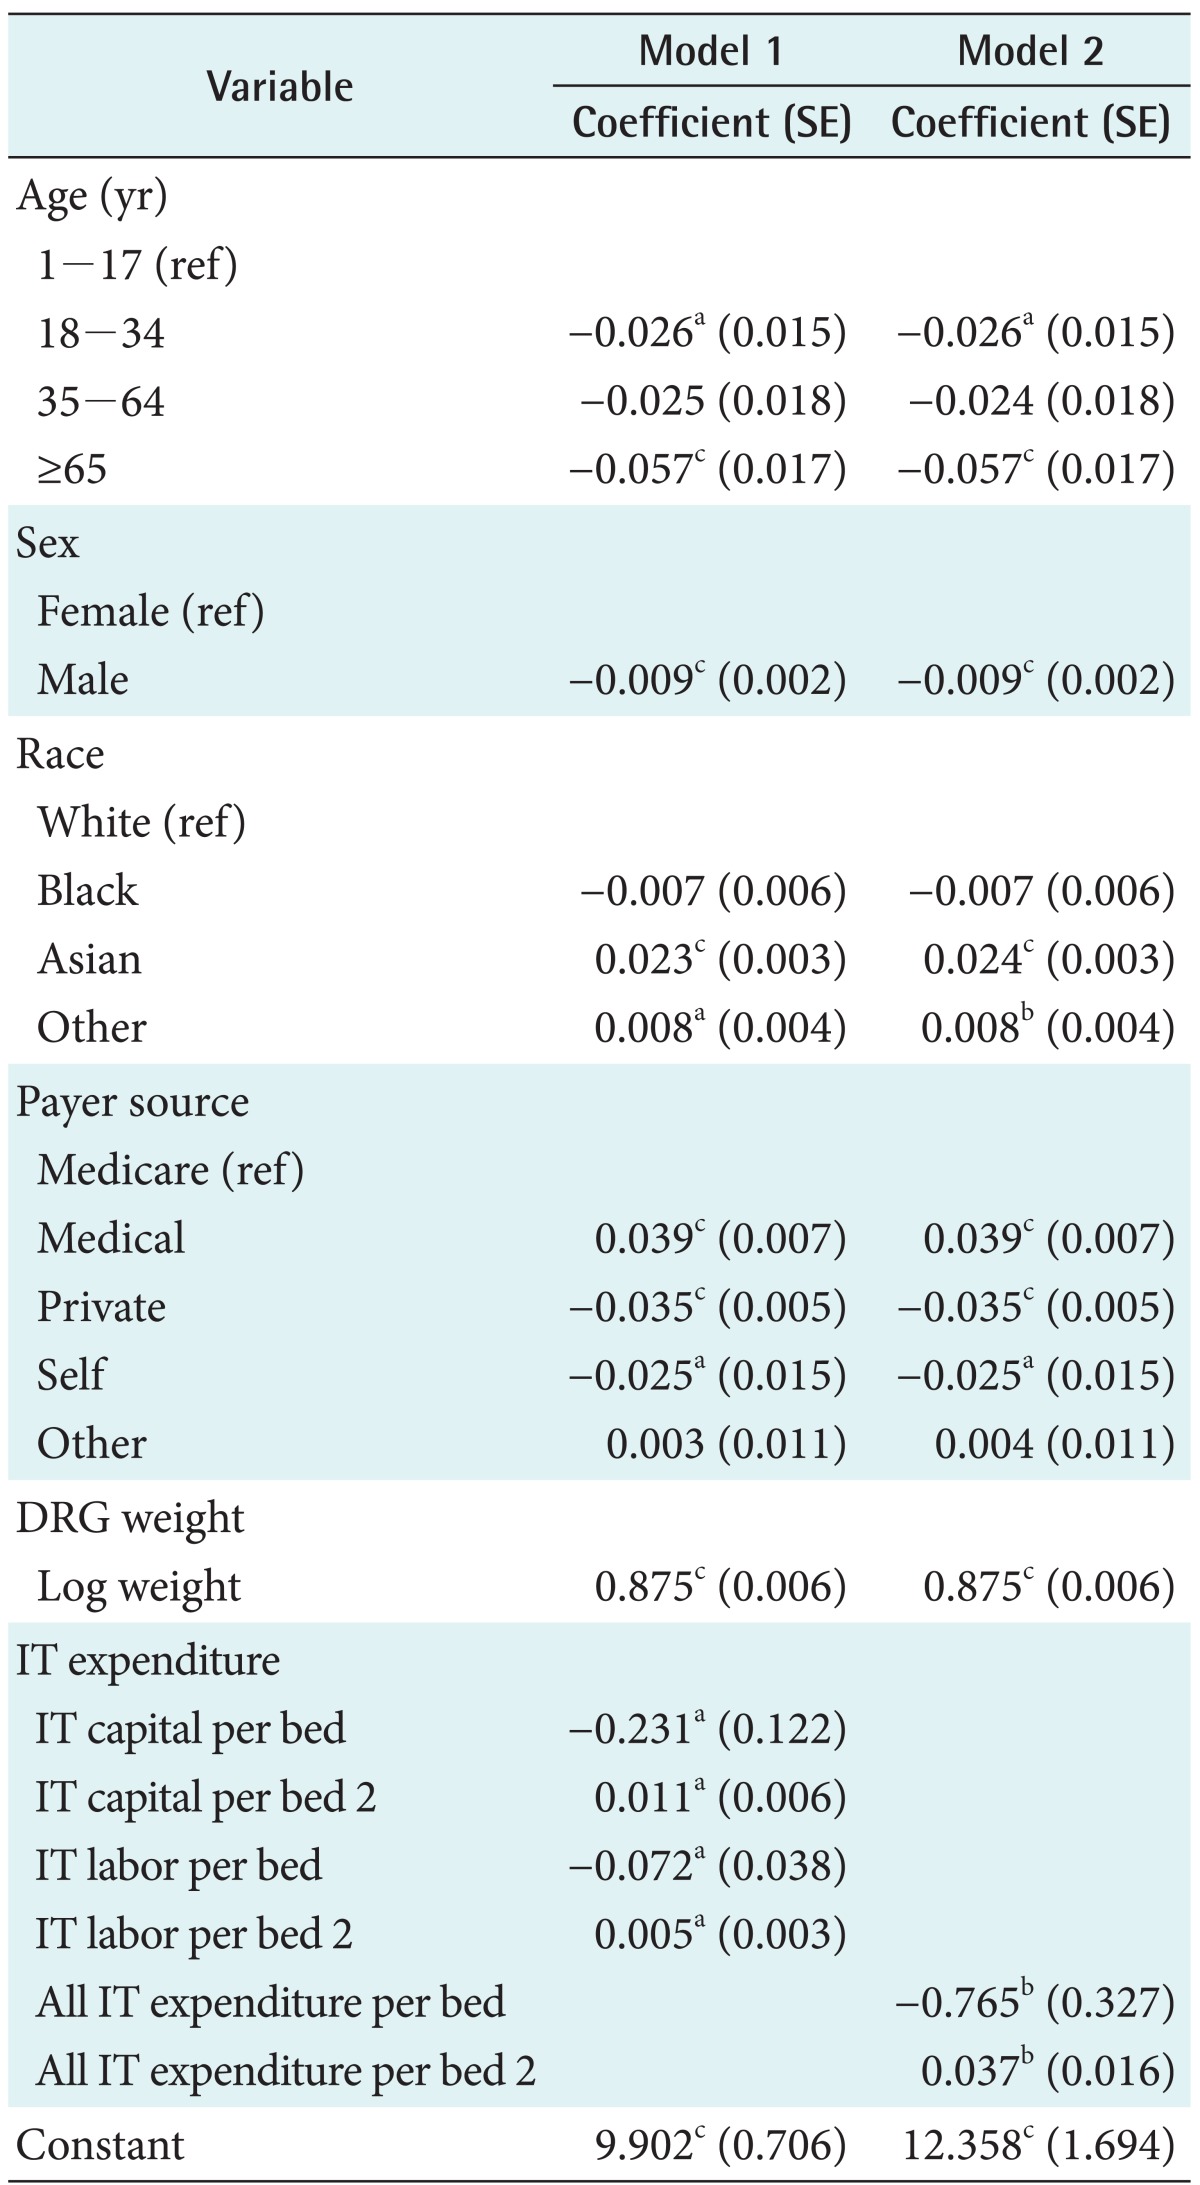
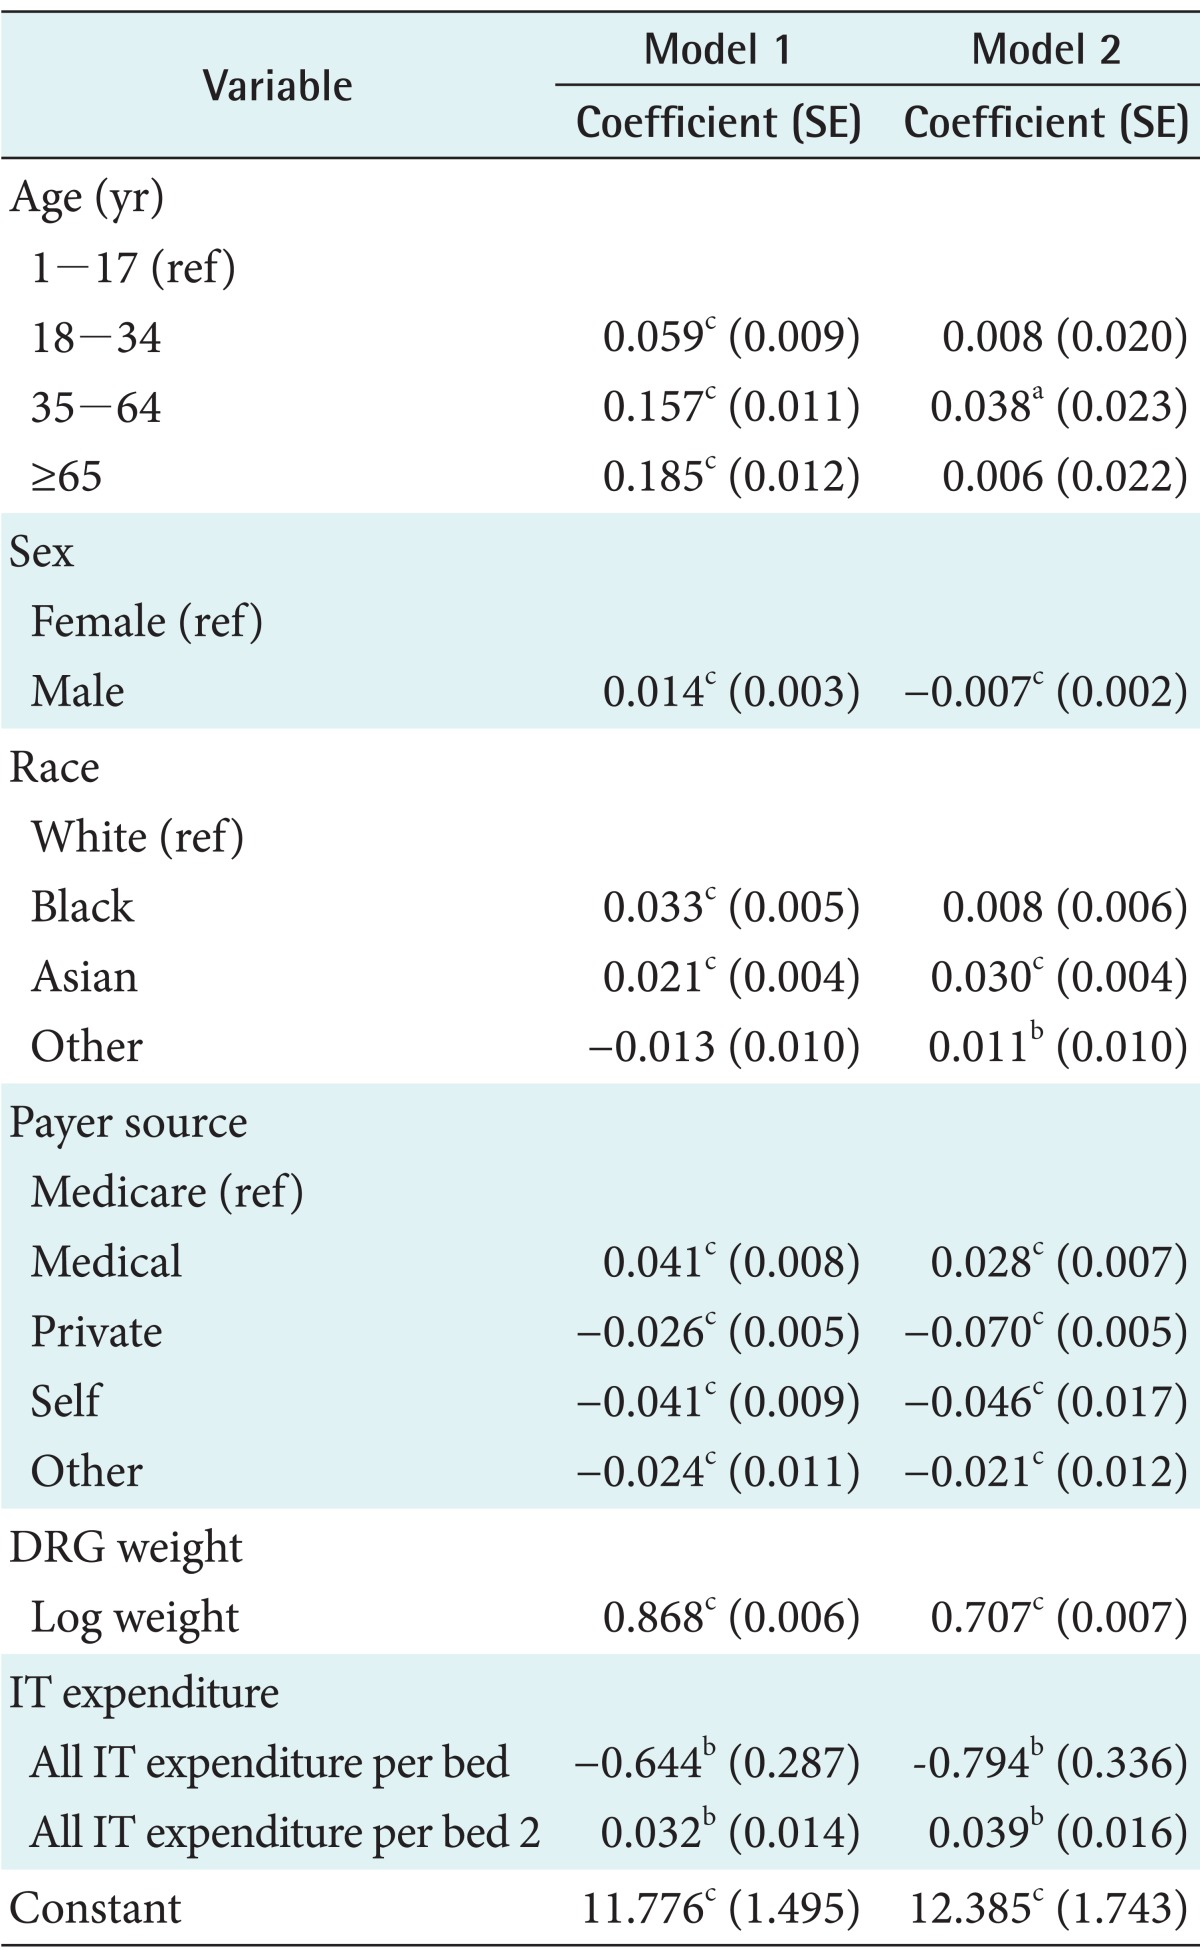
Table 2 presents the regression results. For the analysis, we applied hospital fixed effect with clustered error. To represent the possible non-linear relationship between patient-level cost and IT expenditure, a quadratic cost function was employed to fit the hospital cost function by adding linear and quadratic terms of IT capital per bed and labor per bed in Equation (3). The regression results in Table 2 show that the quadratic function of IT capital per bed and labor per bed adequately explained changes in patient cost. IT capital per bed and IT labor per bed were associated with cost in Model 1 in Table 2. This suggests a conventional U-shaped average cost curve. Figure 1 clearly shows the quadratic relationship between patient-level cost and IT expenditure. The dashed line of Figure 1 shows the quadratic relationship between patient-level cost and IT labor per bed. The average cost falls until the IT labor per bed of US$1,550 (log of 7.34) is reached, and it rise thereafter. The thin line in Figure 1 represents the quadratic relationship between patient-level cost and IT capital per bed. The average cost decreases until the IT capital per bed of US$27,909 (log of 10.239) is reached, and it rises thereafter. However, hospital's IT capital and IT labor expenditure account for a small percentage of revenue [1]. Thus, to capture the whole effect of IT expenditure, we summed these two values to obtain the total IT expenditure. Model 2 in Table 2 shows that all IT expenditure was significantly associated with cost. The thick line of Figure 1 also shows that patient-level cost decreased as all IT expenditure per bed increase up to US$28,695 (log of 10.264), and it increased thereafter.
We found similar results in age, sex, race, payer source, and DRG weight for Models 1 and 2. Older patients (65 and over) had the lower costs than any other age groups. Females and Asian had higher costs than their counterparts. Patients with private insurance had lower costs than those with other insurance. As expected, higher DRG weight was associated with higher cost.
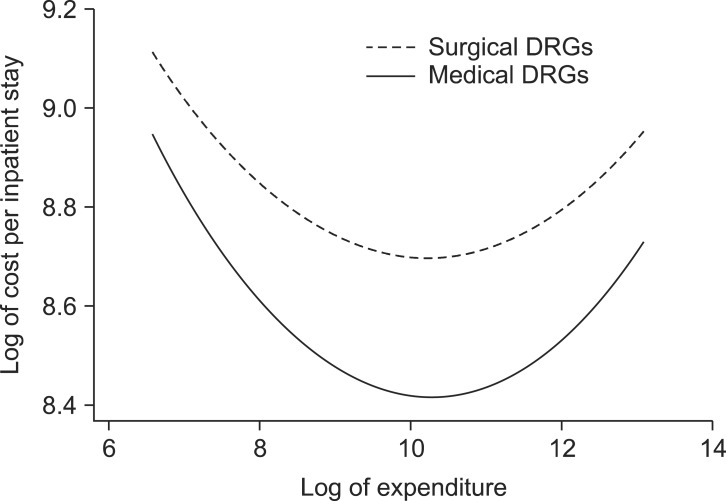
Next, we investigated the effect of health IT expenditure on costs across DRG types because different diseases may be differently associated with health IT. We classified all DRGs into medical or surgical diseases based on the DRG Expert category [29]. Results show that surgical diseases account for 17.8% of all DRGs, while medical diseases comprise the remainder. Table 3 showed that all IT expenditure was associated with both medical and surgical diseases. While the average cost for medical diseases is lower than that for surgical diseases, the cost slope is steeper in medical diseases than in surgical diseases (-0.076 vs. -0.059) in the falling cost part in Figure 2.
Moreover, we found slightly different results in relation to other independent variables in surgical and medical diseases. Regarding surgical disease, older patients (65 and over) had higher costs than any other age groups. Male and black patients had higher costs than their counterparts. Regarding medical disease, people in the age range of 35 to 64 had higher costs than the youngest age group (1-17). Unlike surgical disease, female patients had higher costs than males in medical disease. Asians also had higher costs than other race/ethnic groups. In both surgical and medical diseases, patients with medical insurance had higher costs than those with other insurance, while patients with self and private insurance had the lowest costs. Also, higher DRG weight was associated with increased cost.
Go to :
IV. Discussion
This study examined the effect of health IT expenditure on patient-level cost by analyzing OSHPD data obtained from 2000 to 2007. Unlike previous studies [4-8,10-12,14,15,19], we used a dollar measure of IT capital and labor expenditure. Also, we employed hospital fixed effects regression with clustered errors within hospitals and found the quadratic relationship between health IT expenditure and patient-level cost. The quadratic function in IT expenditure predicted a decrease in cost up to US$1,550 of IT labor per bed, US$27,909 of IT capital per bed, and US$28,695 of all IT expenditure per bed. This quadratic relationship is consistent with the marginal effect theory in economics. It implies that as the hospitals invest more in IT systems, their cost savings will increase. However, after a certain point, as they increase IT investment, their cost reduction will decrease. That is, further cost reduction will be limited without expanding general capital. According to Rosenberg [30], capital statement is an important factor in the diffusion of a technology because it plays a crucial role in the successful implementation of a new technology. Also, one quadratic relationship between IT expenditure and patient-level cost could be lack of enough money for hospitals to invest in health IT. Overall health IT expenditure accounted for only 5.3% of the total revenue in California hospitals [1]. Also, less than 8% of US hospitals have adopted basic EMR systems [31]. This lag in IT investment means that there may not be a significant reduction in cost. Conversely, the widespread of IT adoption may generate large cost savings [1].
Our findings are generally consistent with those of other studies [9,18,20,31] that found decreased costs due to health IT adoption. Some studies have examined the impact of IT on hospitals-level cost. Borzekowski [9] examined the relationship between health IT use and hospital operating costs and found that both financial/administrative and clinical IT systems at most automated hospitals were associated with lower costs. Furukawa et al. [18] also found that EMR adoption reduced licensed vocational nurse cost per hour by 2%-4%. Other studies examined patient cost reduction after IT adoption. Amarasingham et al. [20] measured IT adoption more flexibly as the level of automation based on physicians' daily interaction with the IT system and found that hospitals with automated IT systems had lower costs. Also, Evans et al. [32] found that the use of a database linked to a decision-support program and computer-based patient records significantly reduced total per-patient cost.
Moreover, we found different relationships between IT expenditure and patient cost in relation to different types of disease. We categorized DRGs into surgical and medical diseases and found that IT expenditure reduced cost more significantly in relation to medical diseases than surgical diseases. Medical disease is less complicated than surgical disease. Thus, health IT may capture the cost reduction more easily than for surgical disease.
There were some limitations in this study. First, our health IT expenditure measure may be heterogeneous because it includes all the IT applications including clinical and administrative ITs. Different IT systems may affect hospital cost differently. Because patient cost is aggregated from complex processes, some processes may not be affected by a clinical IT system, such as EMR or CPOE. However, cost management may be influenced by administrative IT systems because they can keep track patient record and improve charge capture. Second, we only used California hospital data. Thus, it may not be possible to generalize our results to other states in which the pattern of IT expenditure is affected by other factors or expenditures may occur at different rates. Third, the returns to IT expenditure may have occurred in ways that we could not observe in the data, such as increased quality or efficiency which is difficult to measure in cost. Fourth, health IT expenditure behavior may differ in some factors that we could not observe in our data. Thus, our estimates may remain biased. Lastly, we used the hospital's cost-to-charge ratio to calculate the cost of hospitals; however, the cost-to-charge ratio can vary widely within the same institutions for different services, and the conversion of cost multiplied by the cost-to-charge ratio is only a general approximation of real cost in hospitals.
Go to :
 XML Download