Abstract
Background
Doppler echocardiographic assessment of pulmonary venous flow has helped to characterize left ventricular diastolic function in various cardiac diseases of the heart. Abnormal pulmonary venous flow patterns have been described for a variety of conditions including restrictive myocardial disease such as cardiac amyloidosis, constrictive pericarditis, dilated cardiomyopathy and they also helped to assess the severity of mitral regurgitation. Therefore this study was designed to evaluate the changes of pulmonary venous flow profiles in several cardiac diseases which are commonly encountered clinically, such as congestive heart failure, mitral regurgitation, mitral stenosis, aortic regurgitation and left ventricular hypertrophy and also the differences between right and left pulmonary venous flow pattern in these conditions.
Method
We analyzed transesophageal echocardiographic findings of 328 patients(95 men and 233 women, mean age 54 ± 13 years) in those right and left pulmonary venous flow were obtainable. According to the echocardiographic findings, the above subjects were classified into control group(n=167), congestive heart failure group(n=23), mitral regurgitation group (n = 28) .mitral stenosis group(n=10). aortic regurgitation group(n=37), and left ventricular hypertrophy group(n=23). In this Study, the datas of subjects who did not show significant valvular lesions, ventricular hypertrophy, systolic or diastolic dysfunction were used as a control. Peak systolic velocity(peak S). systolic velocity integral(syst. V.I.), peak diastolic velocity(peak D), diastolic velocity integral (dias. V.I.), peak velocity of atrial contraction (peak A), velocity integral of atrial contraction(A. V.I.), peak systolic velocity/peak diastolic velocity ratio(peak S/peak D), and systolic velocity integral/diastolic velocity integral ratio(syst/dias V.I) were measured in each group.
Results
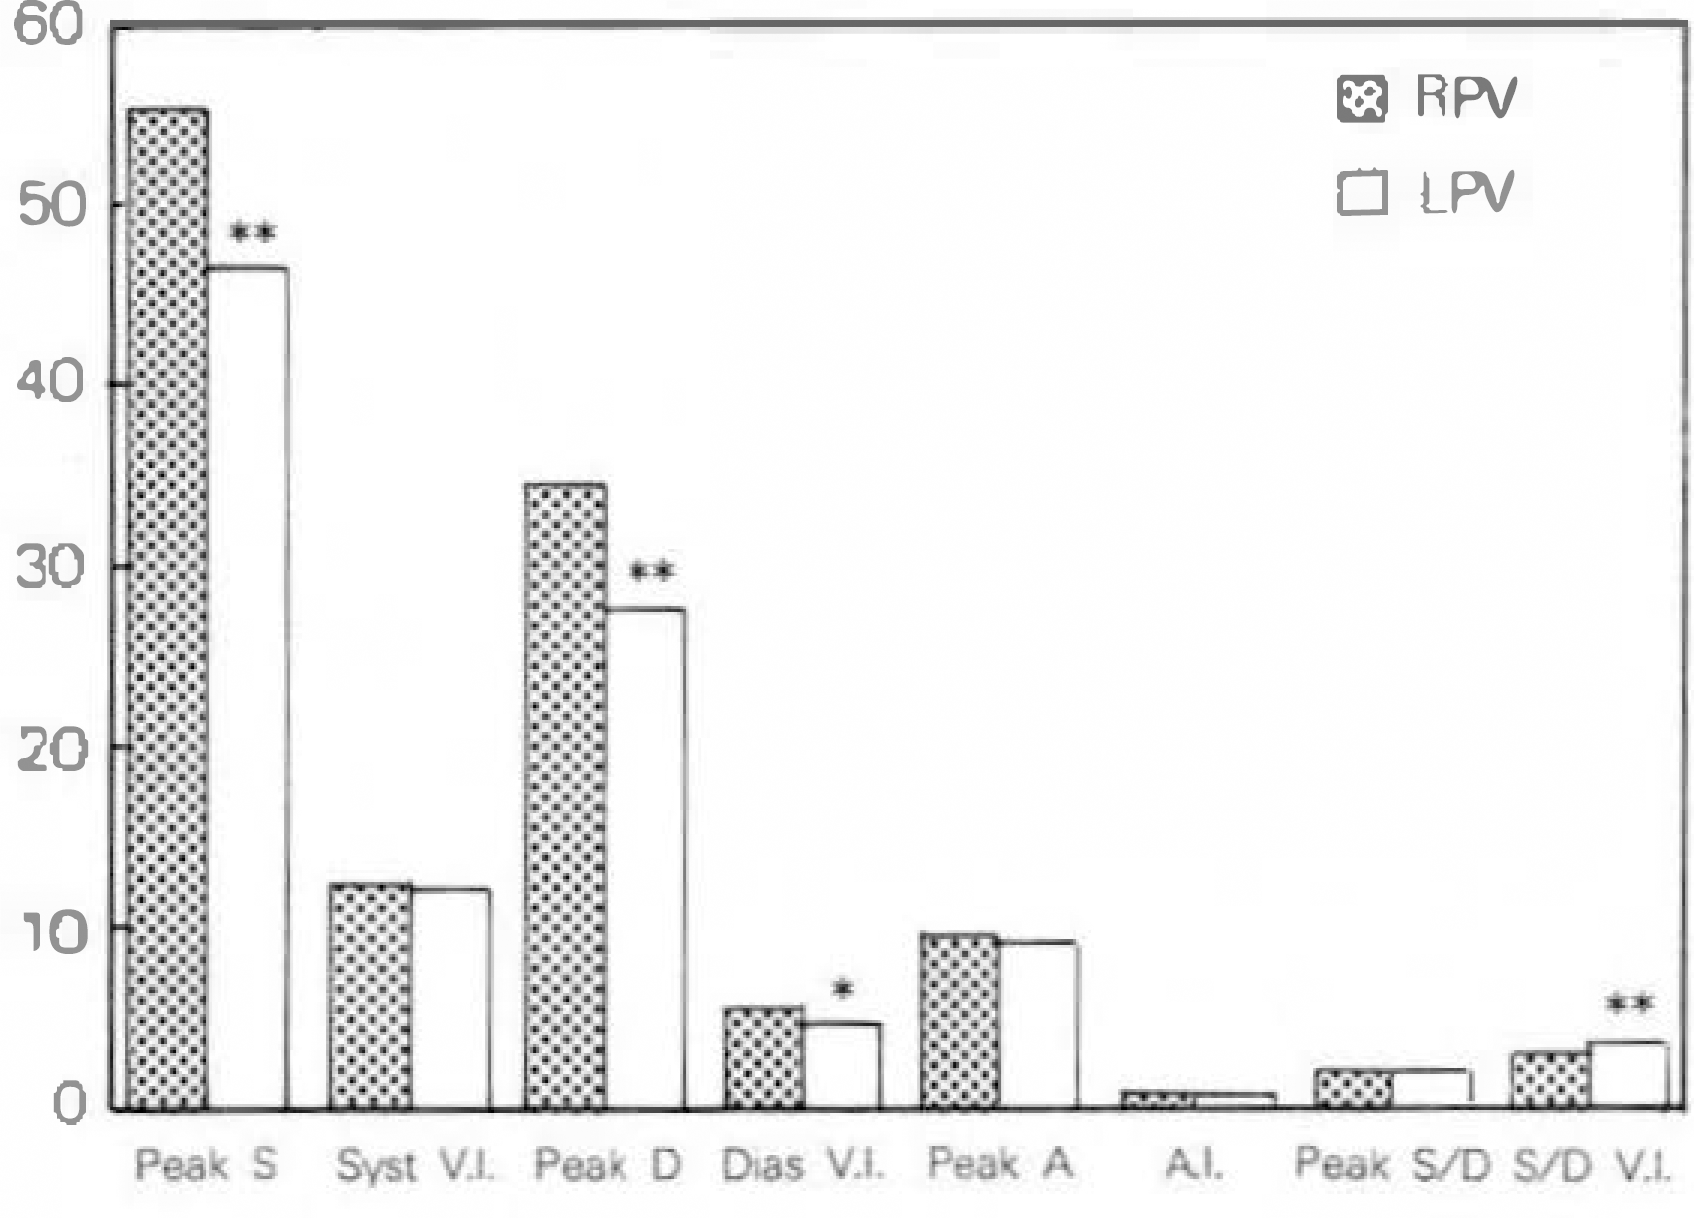
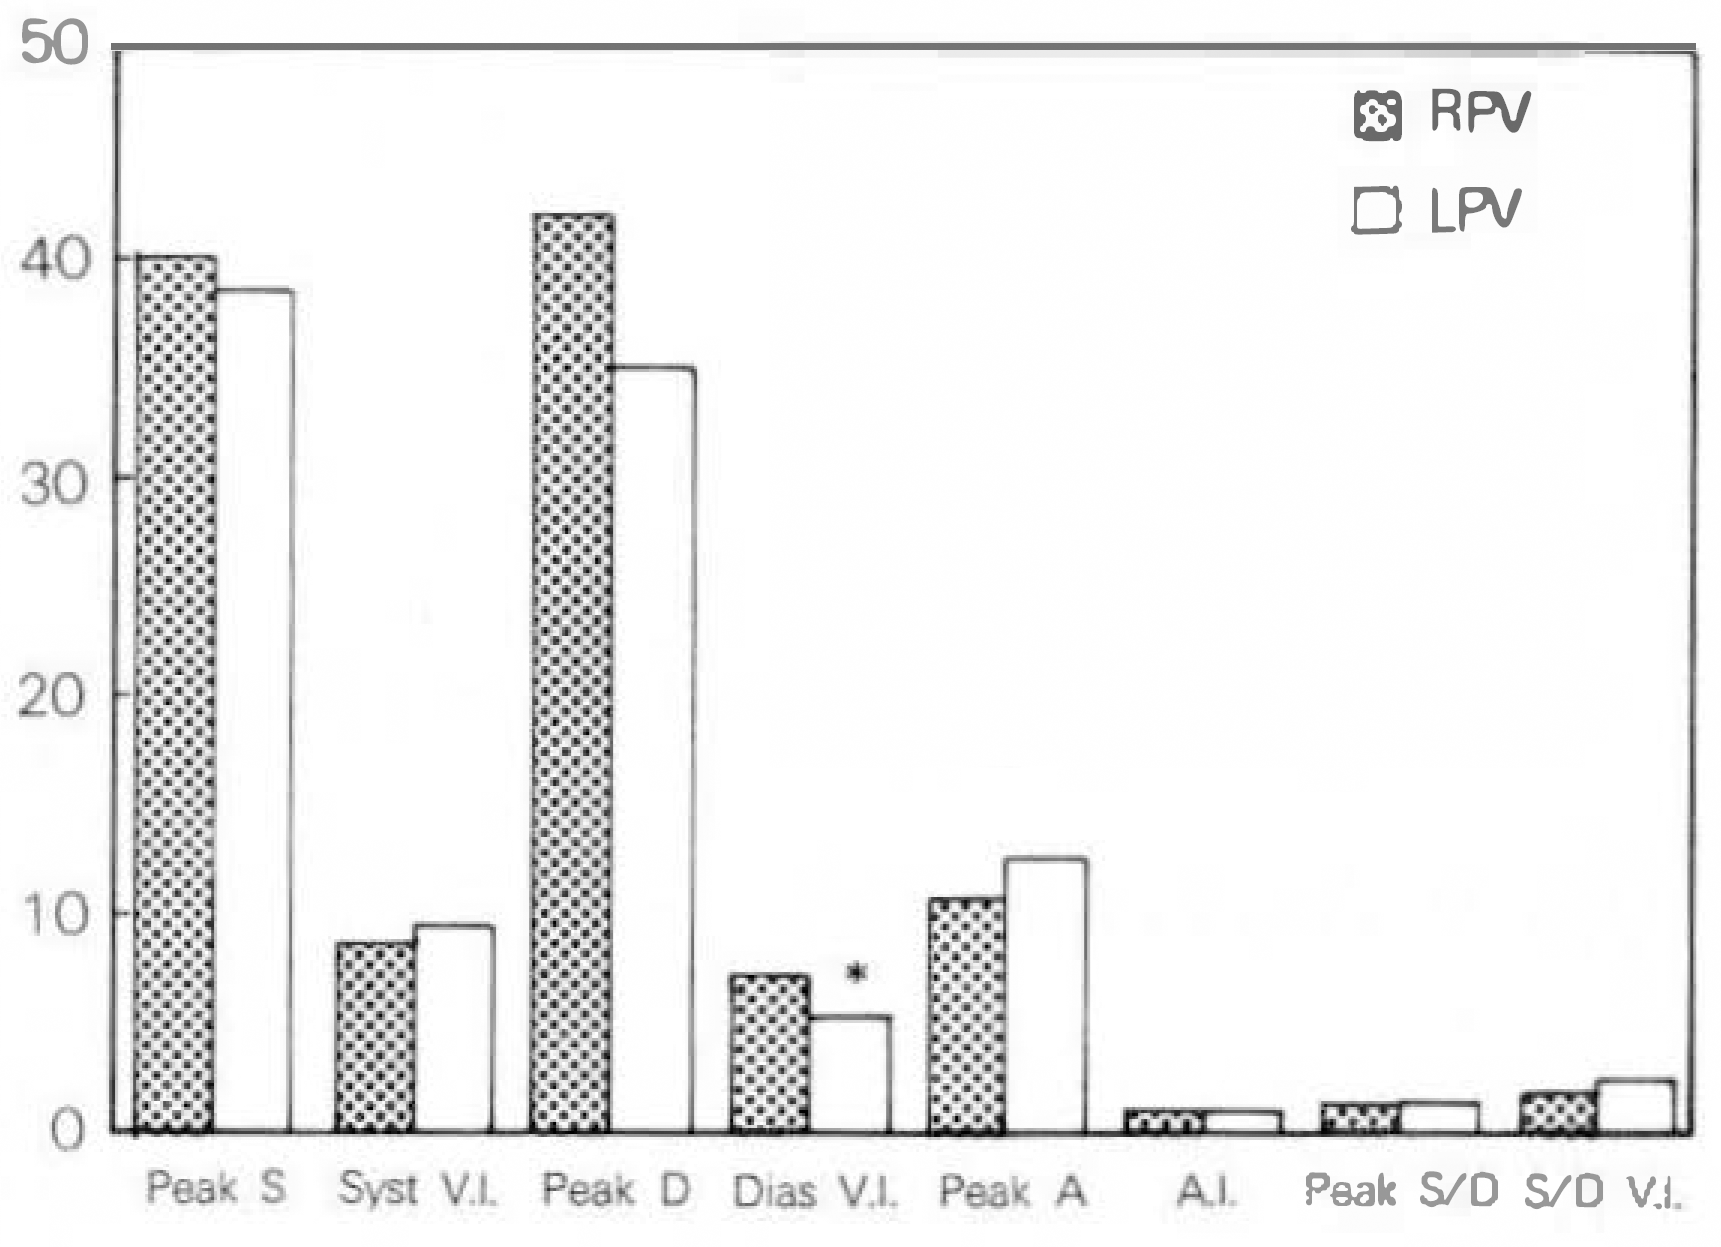
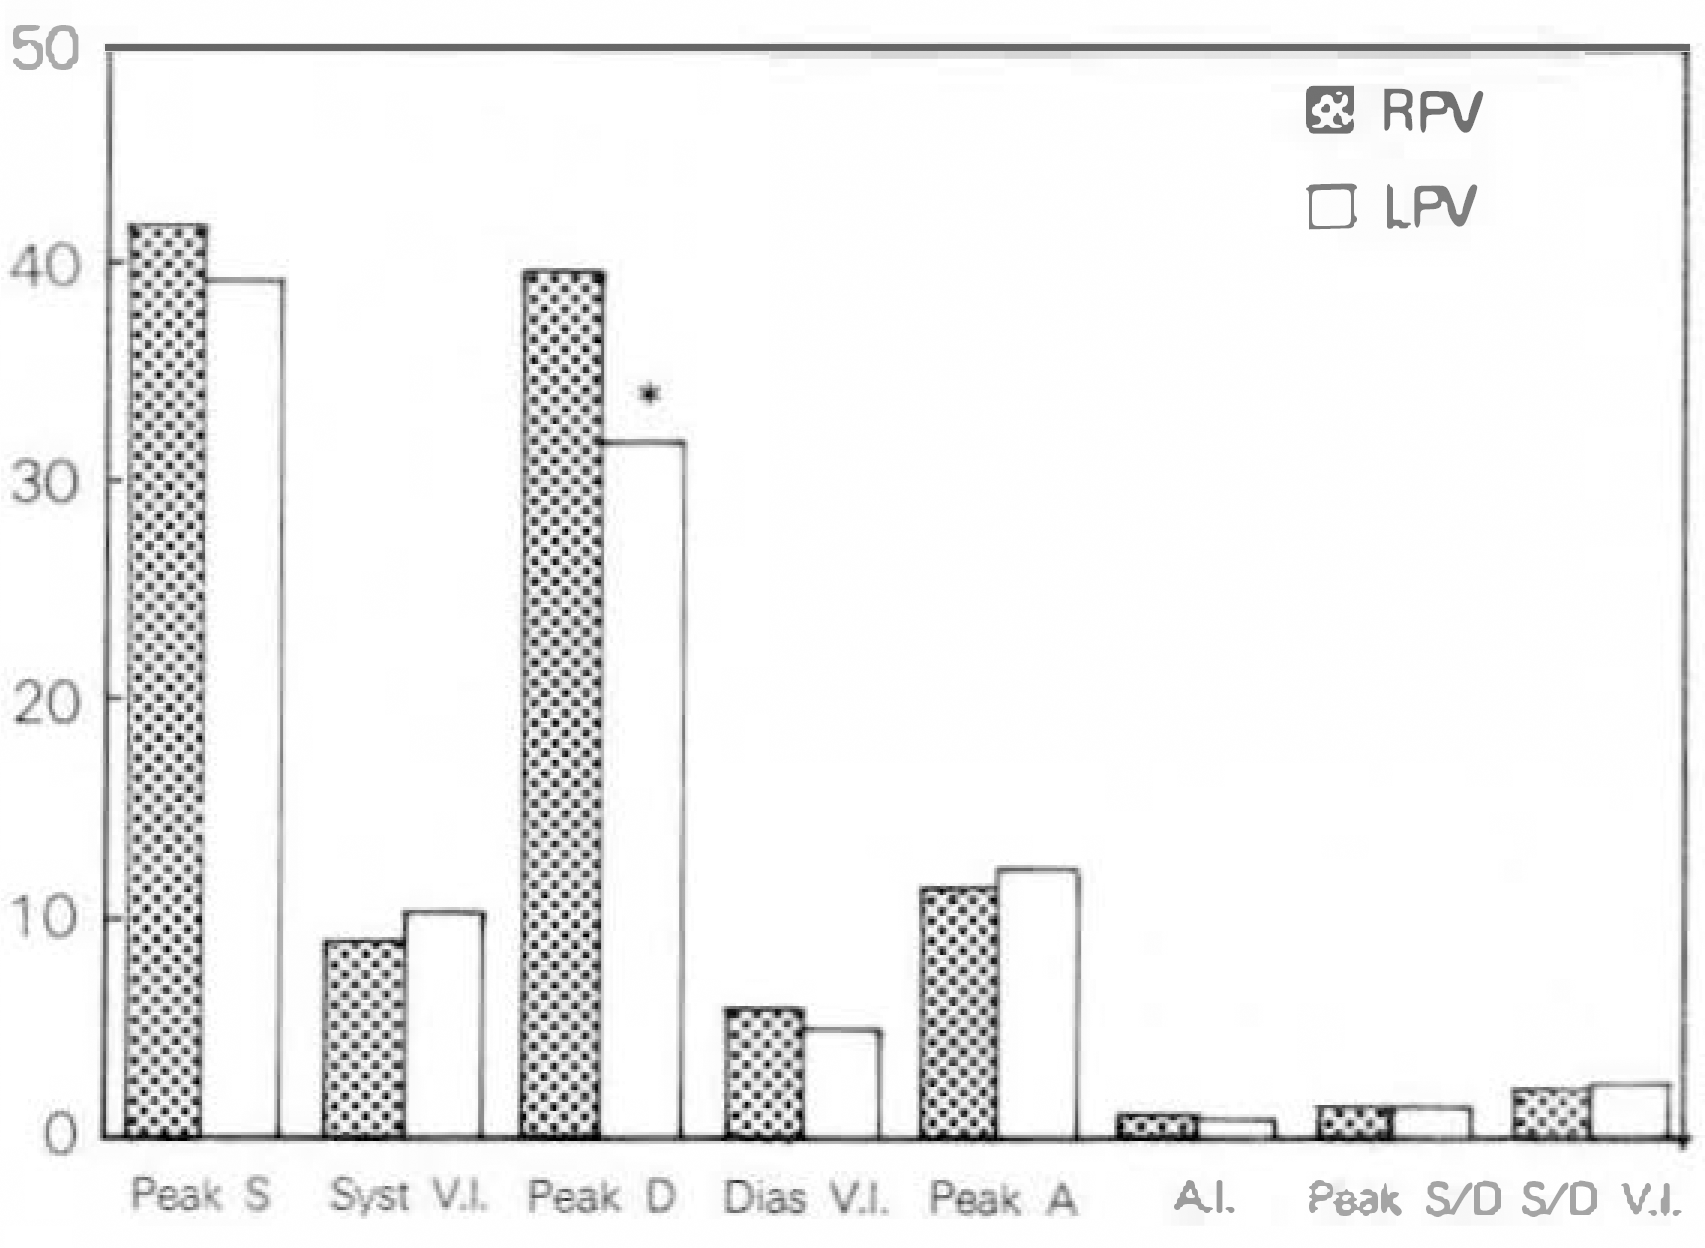
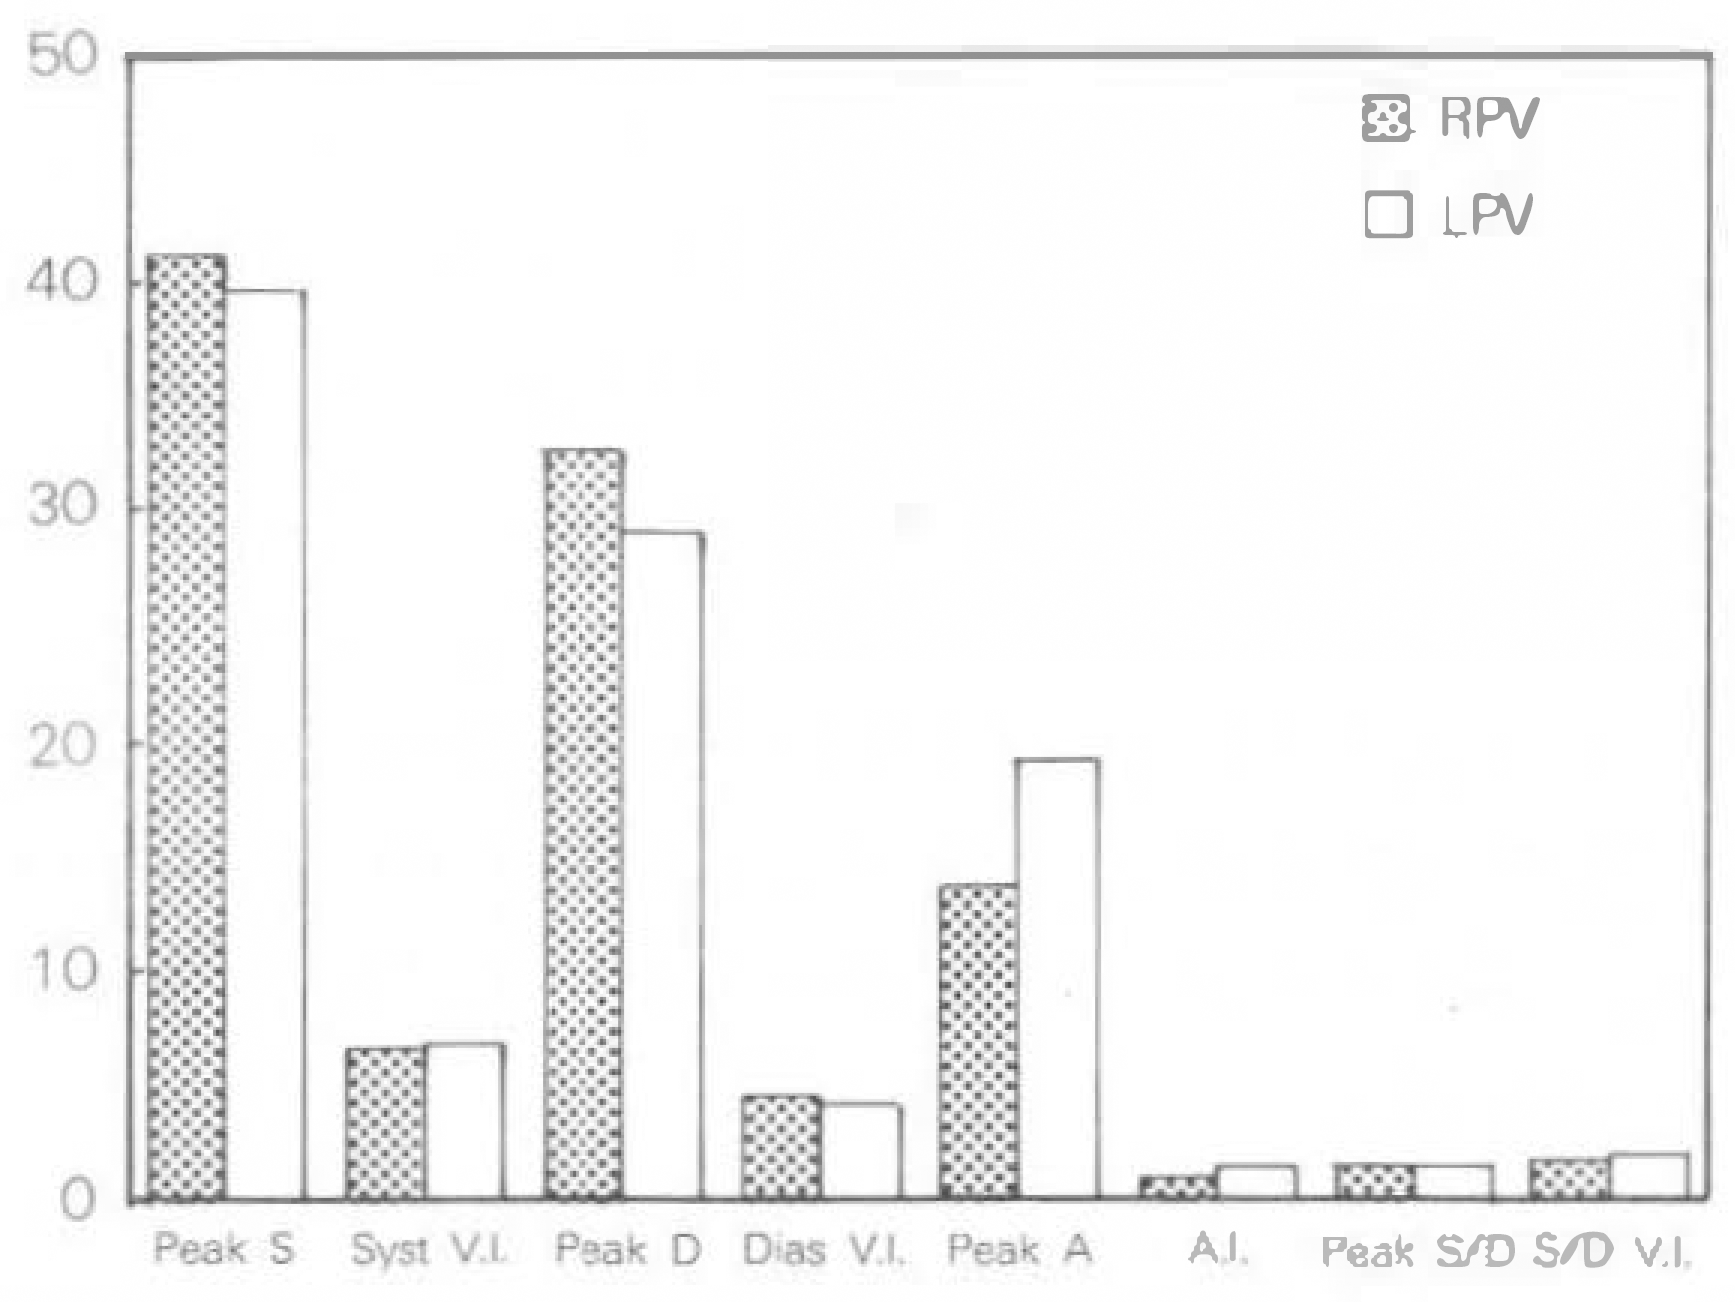
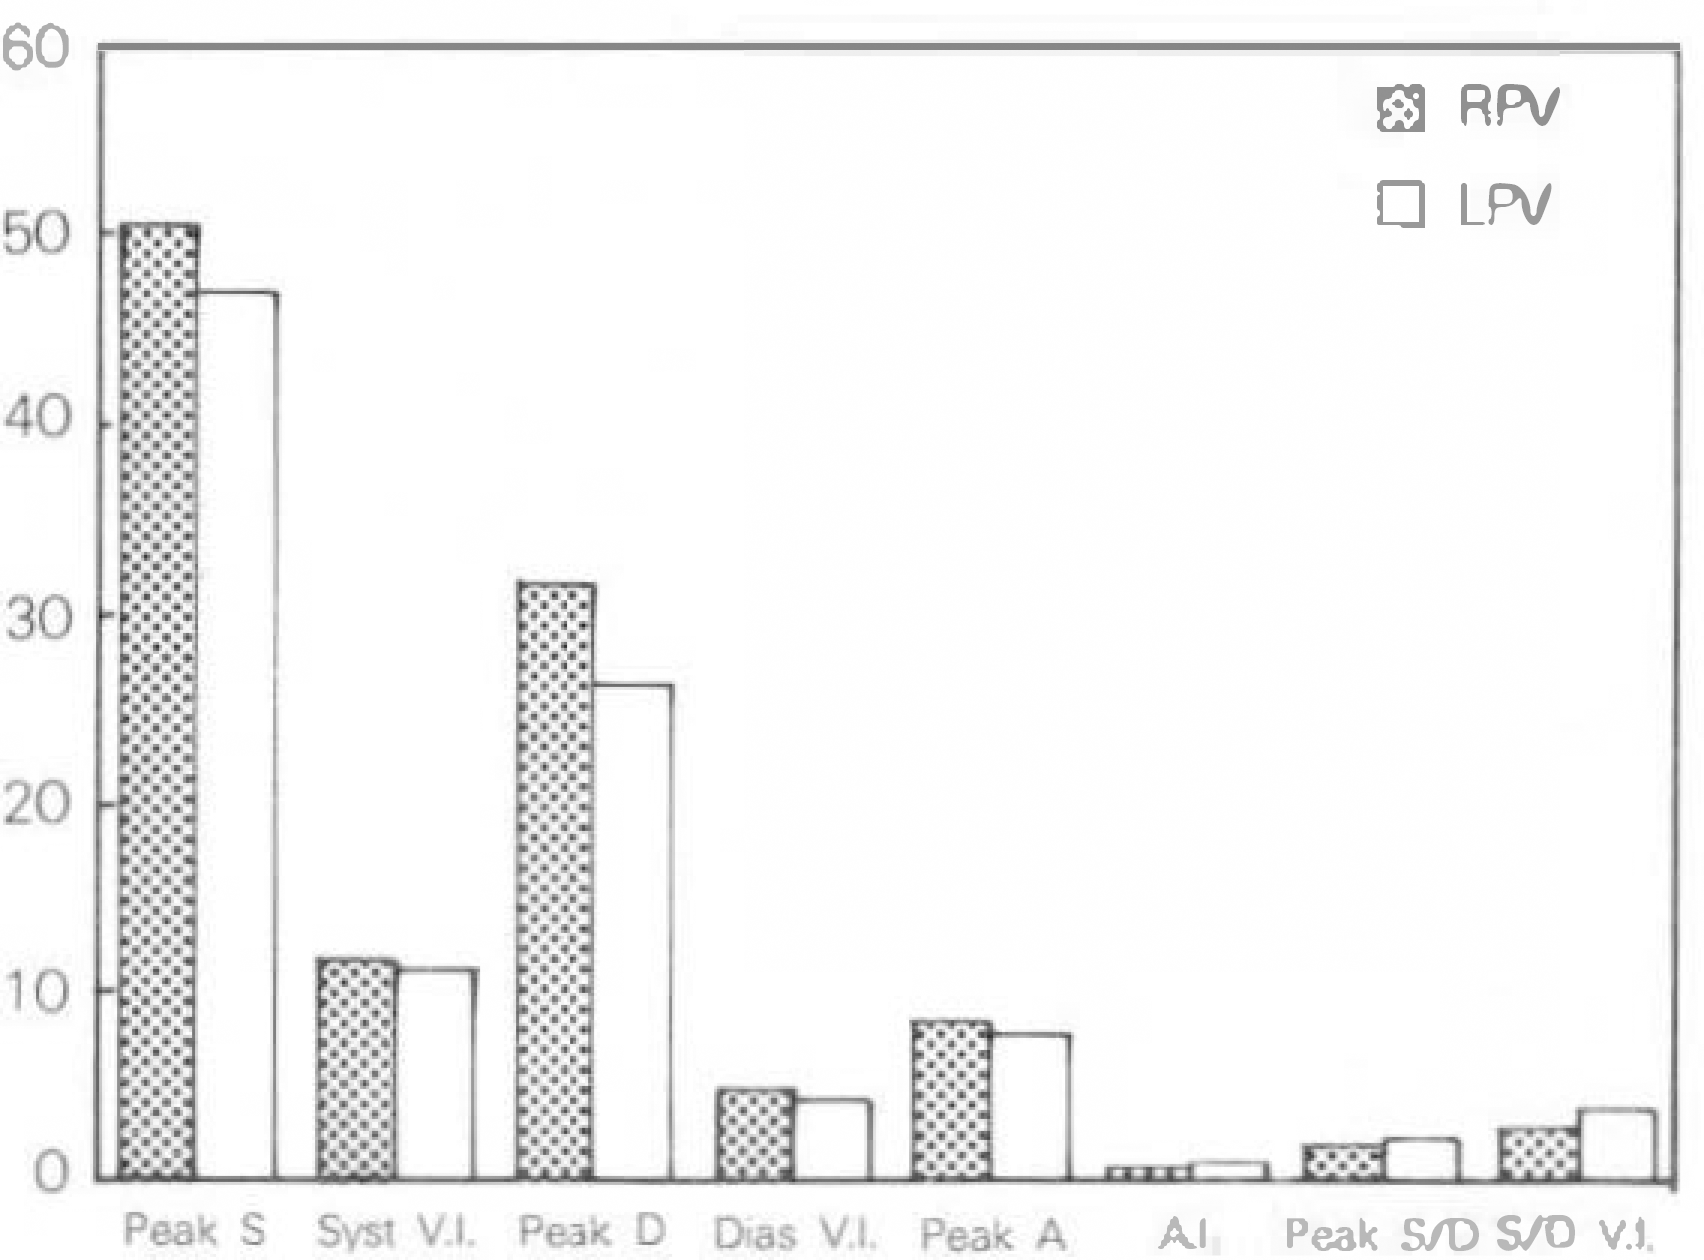
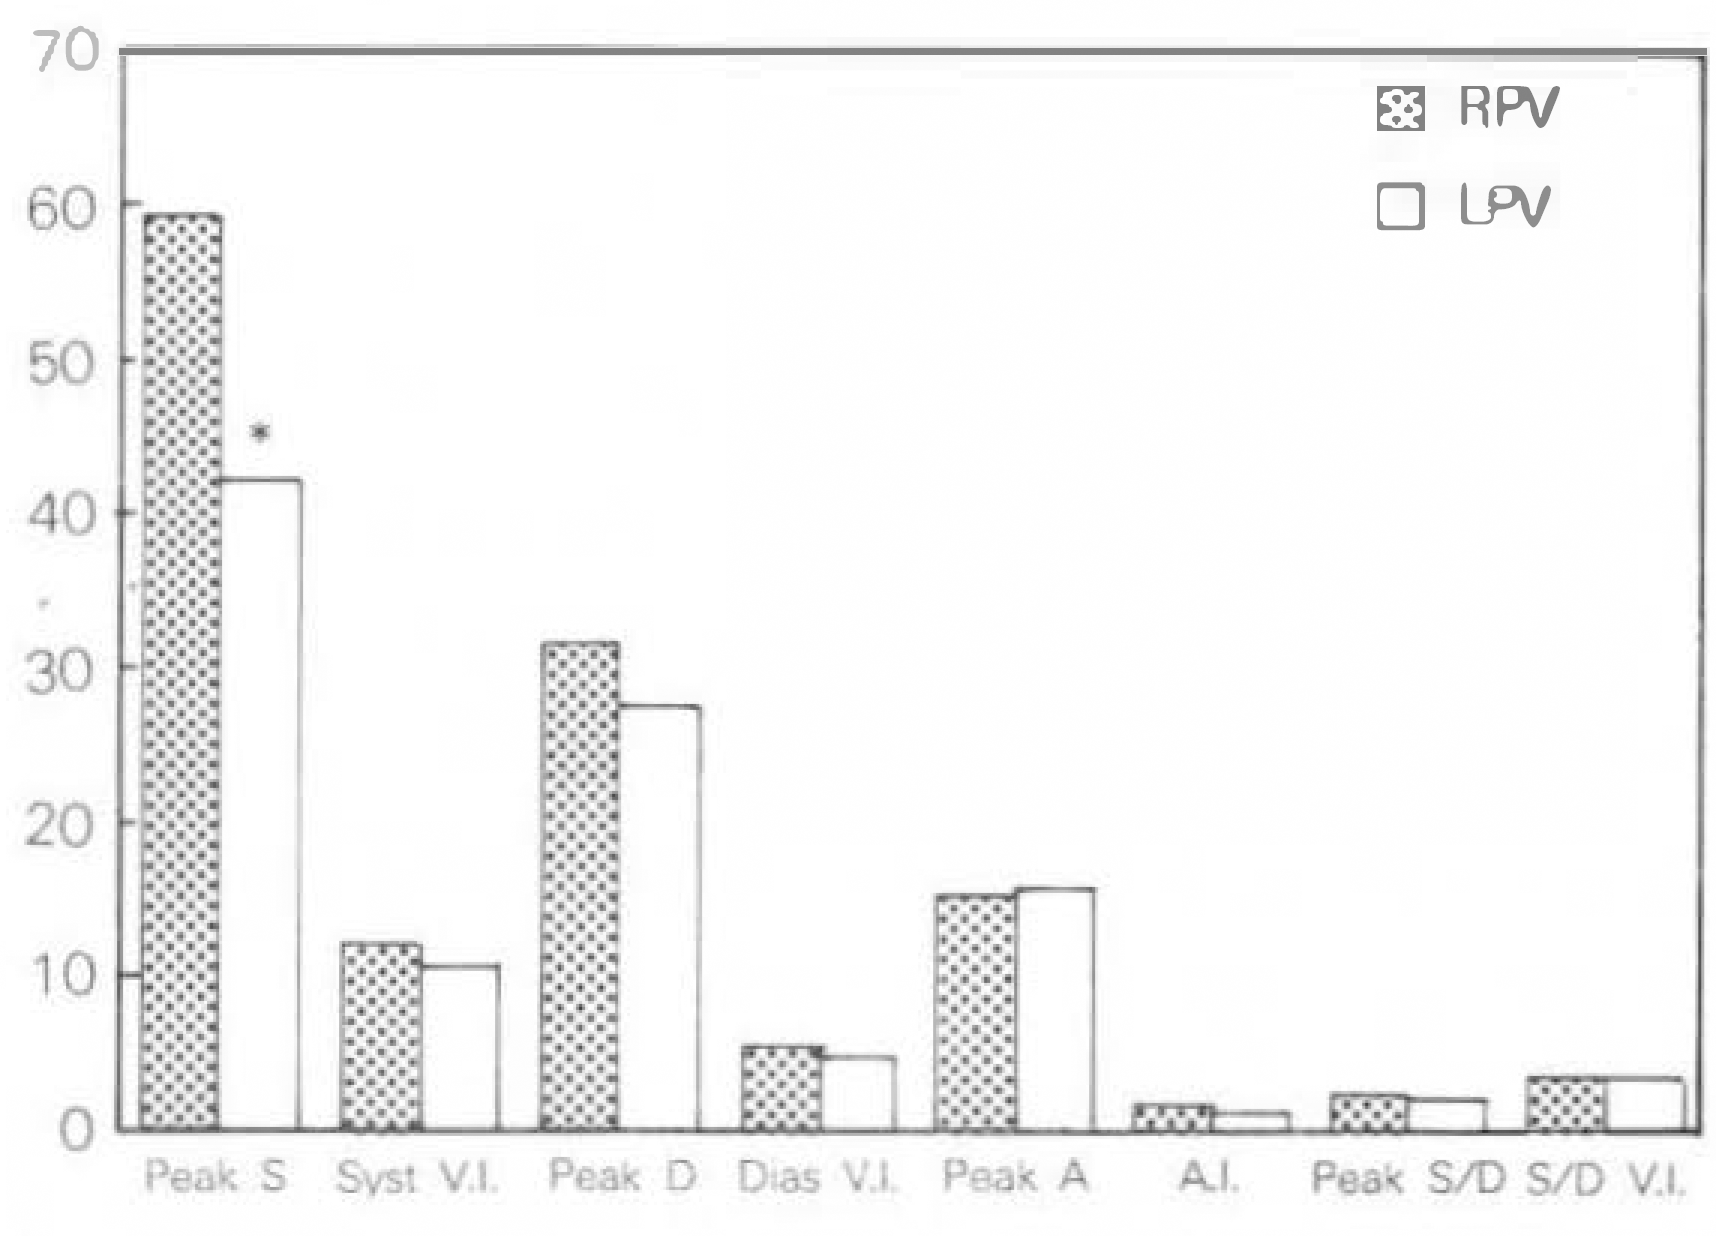
The pulmonary venous flow pattern of right and left pulmonary vein in each group and comparisons between different groups showed the findings as follows(table).
Conclusion
Analysis of pulmonary venous flow could be used as a useful index of evaluating diseased state of heart. Each group showed the relatively characteristic changes of pulmonary venous flow and those changes could be observed commonly in both right and left pulmonary vein. When one side of pulmonary veins could not be evaluated adequately, the valuable hemodynamic information could be obtained through the examintion of the other side pulmonary vein.
References
1). Klein Ak, Hatle LK, Burstow DJ, Seward JB, Kyle RA, Bailey KR, Luscher TF, Gertz MA, Tajik AJ. Doppler characterization of left ventricular diastolic function in cardiac amyloidosis. J Am Coll Cardiol. 13:1017–1026. 1989.

2). Schiavone WA, Calafoire PA, Currie PJ, Lytle BW. Doppler echocardiographic demonstration of pulmonary venous flow velocity in three patients with constrictive pericarditis before and after pericardiectomy. Am J Cardiol. 1:145–147. 1989.

3). Klein AL, Tajik AJ. Doppler assessment of pulmonary venous flow in healthy subjects, and in patients with heart disease. J Am Soc Echocardiogr. 4:379–392. 1991.

4). 이방헌. 도플러 심초음파도에 의한 화심설 확장기 농의 명가 한국싱초음파학회지 제 1 회 연수강좌. 42–45. 1993.
5). 채 장성. Pulmo,따ry venotα and LAA flow profiles. 한국심초음파학회지 제 1 회 연수강좌. 93–98. 1993.
6). 신길자 폐정맥 혈류의 도플러 혈류파 유형. 순환기 25권(부록). 235–250. 1995.
7). Keren G, Sherez J, Megidish R, Levitt B, Laniado S. Pulmonary venous flow pattern- its relationship to cardiacdynamics, a pulsed doppler echocardiographic study. Circulation. 71:1105–1112. 1985.
8). Smallhorn JF, Freedom RM, Olley PM. Pulsed doppler echocardiogrphic assessment of extraparenchymal pulmonary vein flow. J Am Coll Cardiol. 9:573–579. 1987.
9). Kuecherer HF, Muhiudeen IA, Kusumoto FM, Lee E, Moulinier LE, Cahalan MK, Schiller NB. Estimation of mean left atrial pressure from transesophageal pulsed doppler echocardiography of pulmonary venous flow. Circulation. 82:1127–1139. 1990.

10). Nishimura RA, Abel MD, Hatle LK, Tajik AJ. Assessment of diastolic function of the heart: Background and current applications of doppler echocardiography. Mayo Clin Proc. 64:181–204. 1989.
11). Rossvoll O, Hatle LK. Pulmonary venous flow velocities recorded by transthoracic doppler ultrasound: relation to left ventricular diastolic pressure. J Am Coll Cardiol. 21:1687–1696. 1993.
12). Nishimura RA, Abel MD, Hatle LK, Tajik AJ. Relation of pulmonary vein to mitral flow velocities by transesophageal doppler echocardiography. Effects of different loading conditions. Circulation. 81:1488–1497. 1990.
13). Smallhorn JF, Freedom RM. Pulsed doppler echocardiography in the preoperative evaluation of total anomalous pulmonary veous connections. J Am Coll Cardiol. 8:1413–1420. 1986.
14). Bartzokis TC, Lee RJ, Grogin HK, Schnittger I. Assessment of pulmonary venous flow by transesophageal echocardiography (Abstract). Circulation. 80(Suppl II):613. 1989.
15). Castello R, Pearson AC, Lenzen P, Labovitz AJ. Evaluation of pulmonary venous flow by transesophageal echocardiography in subjects with a normal heart: Comparisonwith transthoracic echocardiography. J Am Coll Cardiol. 18:65–71. 1991.
16). Meijburg HWJ, Visser CA, Weserhof PW, Kasteleyn I, Robes EO. Normal pulmonary venous flow characteristics as assessed by transesophageal pulsed doppler echocardiography. J Am Soc Echocardiogr. 5:588–597. 1992.

17). Keren G, Sonnenblick EH, LeJemetel TH. Mitral Annulus Motion, Relation to pulmonary venous and transmitral flows in normal subjects and in patients with dilated cardionyopathy. Circulation. 78:621–629. 1988.
18). Ormiston JA, Shah DM, Tei C, Wang M. Size and motion of the mitral annulus in man: A two-dismensional echocardiographic method and findings in normal subjects. Circulation. 64:113–120. 1981.
19). Castello R, Pearson AC, Lenzen P, Labovitz AJ. Effects of mitral regurgitation on pulmonary venous velocities derived from transesophageal echocardiography color-guided pulsed doppler imaging. J Am Coll Cardiol. 17:1499–1506. 1991.
20). 이길환 • 이만영 전숭석 • 박준철 채장성 • 김종 상· 김재형·흥순조·최규보;경식도 심초음파륨 이용한 숭모판 역류가 예갱맥혈류에 미치는 영 향. 한국심초음파학회지 제 1 권. 209–219. 1993.
21). 송재판 • 박숭정 • 박성욱 김재중 • 김원호 두영 철 • 이종구. 숭모판협착충 환자에서 경피적숭모판 악성형술이 폐정맥혈류속도에 미치는 영향. 순환기 23권. 14–24. 1993.
22). Keren G, Pardes A, Miller HI, Scherez J, Laniado S. Pulmonary venous flow determined by doppler echocardiography in mitral stenosis. Am J Cardiol. 65:246–249. 1990.

23). Feigenbaum H. Echocardiography. 5th Ed.p. 154–155. Pensylvania: Lea & Febiger;1994.
Fig. 1.
This figure shows the location of sample volume in right and left pulmonary vein in transesophageal echocardiography and the Doppler recording of right and left pulmonary venous flow.

Table 1.
Pulmonary venous flow patterns in several cardiac disease
| Control(n=167) | CHF(n=23) | MR(n = 28) | MS(n=10) | AR(n=37) | LVH(n=23) | ||
|---|---|---|---|---|---|---|---|
| RPV | Peak S(cm/sec) | 55.4 ± 14.4 | 40.0 ± 14.9∗∗ | 41.9 ± 21.4∗∗ | 41.1 ± 12.6∗∗ | 50.5 ± 13.8 | 59.3 ± 17.1 |
| Syst V.I.(cm) | 12.1 ± 3.8 | 8.5 ± 3.5∗∗ | 9.0 ± 4.1∗∗ | 6.6 ± 2.2∗∗ | 11.7 ± 3.5 | 12.1 ± 3.9 | |
| Peak D(cm/sec) | 34.4 ± 12.3 | 42.1 ± 20.2 | 39.8 ± 16.7 | 32.7 ± 13.6 | 31.6 ± 10.5 | 31.7 ± 11. | |
| Dias V.I.(cm) | 5.3 ± 2.4 | 7.0 ± 3.4∗ | 6.0 ± 2.6 | 4.4 ± 2.1 | 4.9 ± 2.1 | 5.3 ± 3.1 | |
| Peak A (cm/sec) | 9.4 ± 11.2 | 10.5 ± 11.1 | 11.4 ± 10.6 | 13.6 ± 8.5 | 8.4 ± 9.9 | 15.3 ± 14.2 | |
| A. VI(cm) | 0.7 ± 1.0 | 0.9 ± 1.0 | 0.9 ± 1.0 | 1.0 ± 0.7 | 0.7 ± 1.0 | 1.4 ± 1.4 | |
| Peak S/Peak D | 1.8 ± 1.1 | 1.2 ± 0.7∗∗ | 1.3 ± 1.1∗ | 1.4 ± 0.7 | 1.8 ± 0.8 | 2.2 ± 1.3 | |
| Syst/Dias VI. | 2.8 ± 1.7 | 1.7 ± 1.6∗∗ | 2.1 ± 2.7 | 1.7 ± 0.8∗∗ | 2.8 ± 1.2 | 3.2 ± 2.3 | |
| LPV | Peak S(cm/sec) | 46.4 ± 12.8‡ | 38.5 ± 16.2∗∗ | 39.2 ± 15.5∗∗ | 39.7 ± 19.5 | 46.8 ± 23.9 | 42.3 ± 12.3‡ |
| Syst V.I.(cm) | 11.9 ± 3.4 | 9.3 ± 4.9∗ | 10.3 ± 8.5 | 6.7 ± 2.6∗∗ | 11.1 ± 5.5 | 10.7 ± 4.3 | |
| Peak D(cm/sec) | 27.5 ± 9.0‡ | 35.1 ± 11.8∗∗ | 31.9 ± 8.3∗,† | 29.2 ± 10.7 | 26.2 ± 12.6 | 27.5 ± 12.2 | |
| Dias V.I.(cm) | 4.5 ± 3.1† | 5.3 ± 3.3† | 4.9 ± 2.1 | 4.1 ± 2.0 | 4.3 ± 2.6 | 4.6 ± 2.9 | |
| Peak A (cm/sec) | 8.8 ± 8.9 | 12.5 ± 9.9 | 12.1 ± 9.4 | 19.2 ± 16.2 | 7.8 ± 9.8 | 15.7 ± 10.4∗∗ | |
| A. V.I(cm) | 0.6 ± 0.7 | 0.9 ± 0.9∗ | 0.8 ± 0.8 | 1.4 ± 1.2 | 0.9 ± 1.9 | 1.0± 0.7∗∗ | |
| Peak S/Peak D | 1.8 ± 0.5 | 1.2 ± 0.7∗∗ | 1.3 ± 0.5∗∗ | 1.4 ± 0.4∗ | 2.1 ± 1.1 | 1.7 ± 0.7 | |
| Syst/Dias V.I | 3.3 ± 1.7‡ | 2.3 ± 1.7∗ | 2.3 ± 1.6∗∗ | 1.8 ± 0.6∗∗ | 3.8 ± 3.4 | 3.1 ± 2.1 |


 PDF
PDF ePub
ePub Citation
 Print
Print


 XML Download