

 PDF
PDF ePub
ePub Citation
 Print
Print


Abstract
Background
The accurate information about the volume of pericardial effusion can assist in clinical decisions and has important prognostic value. In addition, accurate quantification of serial change in effusion volume is necessary in assessing pericardial disease and making a decision of immediate drainage. This study was performed to evaluate the efficacy of 2-D echocardiographic quantification of pericardial effusion.
Method
The study populations are 22 patients with large pericardial effusion whose volume of effusion is confirmed by paracentesis or surgical drainage. Through the echocardiographic review, the volume of pericardial sac and heart was calculated by method of D'cruz and then, the effusion volume was derived as the difference of two volumes. Each echocardiographically calculated volume of pericardial effusion was compared with the measured volume drained percutaneously or surgically.
Results
The volume of pericardial effusion calculated echocafdiographically was excellently correlated with the drained volume(r=0.90, p < 0.01). The echo-free space was well correlated with the volume of pericardial effusion in the anterior aspect of the heart(r=0.7I, p < 0.01), but not in the posterior aspect.
Go to : 
References
1). D'cruz I, Hoffman PK. A new cross sectional echocardiographic method for estimating the volume of large pericardial effusions. Br Heart J. 66:448–451. 1991.
2). Singh S, Wann LS, Schuchard GH, Klopfenstein HS, Leimgruber PP, Keelan MH, Brooks HL. Right ventricular and right atrial collapse in patients with cardiac tarnponade-a combined echocardiographic and hemodynamic study. Circulation. 70:966–971. 1984.
3). Feigenbaum H, Zary a, Waldhausen JA. Use of ultrasound in the diagnosis of pericardial effusion. Ann Intern Med. 65:443–452. 1966.

4). Horowitz MS, Schulz CS, Stinson EB, Harrison DC, Popp RL. Sensitivity and specificity of echocardiographic diagnosis of pericardial effusion. Circulation. 50:239–247. 1974.
5). Parameswaran R, Goldberg H. Echocardiogrphic quantitation of pericardial effusion of pericardial effusion. Chest. 83:767–770. 1983.
6). Prakash R, Moorthy K, Delvicario L, Aronow WS. Reliability of echocardiography in quantitating pericardial effusion: A prospective study. JCU. 5:398–402. 1977.
7). Eisenberg MJ, Oken K, Guerrero S, Saniei MA, Schiller NB. Prognostic value of echocardiography in hospitalized patients with pericardial effusion. Am J Cardiol. 70:934–939. 1992.
8). Arvin S. Echocardiography. p. 224. New york: Churchill Livingstone;1984.
9). Himelman RB, Kircher B, Rockey DC, Schiller NB. Inferior vena cava plethora with blunted respiratory response: A sensitive echocardiographic sign of cardiac tamponade. J Am Coll Cardiol. 12:1470–1477. 1988.
10). Menapace FJ. Two-dimensional echocardiography in pericardial disease. Giuliani E, editor. ed.Two-dimensional real-time ultrasonic imaging of the heart. p. 182. Boston: Martinus Nijhoff;1985.
11). Sutton MJ, Oldershaw PJ, editors. eds.:. Echocardiography and Doppler. p. 384. New York: Blackwell;1989.
12). Vazquez de Prada JA, Jiang L, Handshumacher BS, Xie SW, Rivera JM, Schwammenthal E, Guerrero JL, Weyman AE, Levine RA, Picard MH J. Quantification of pericardial effusions by three-dimensional echocardiography. J Am Coll Cardiol. 24:254–259. 1994.
Go to :
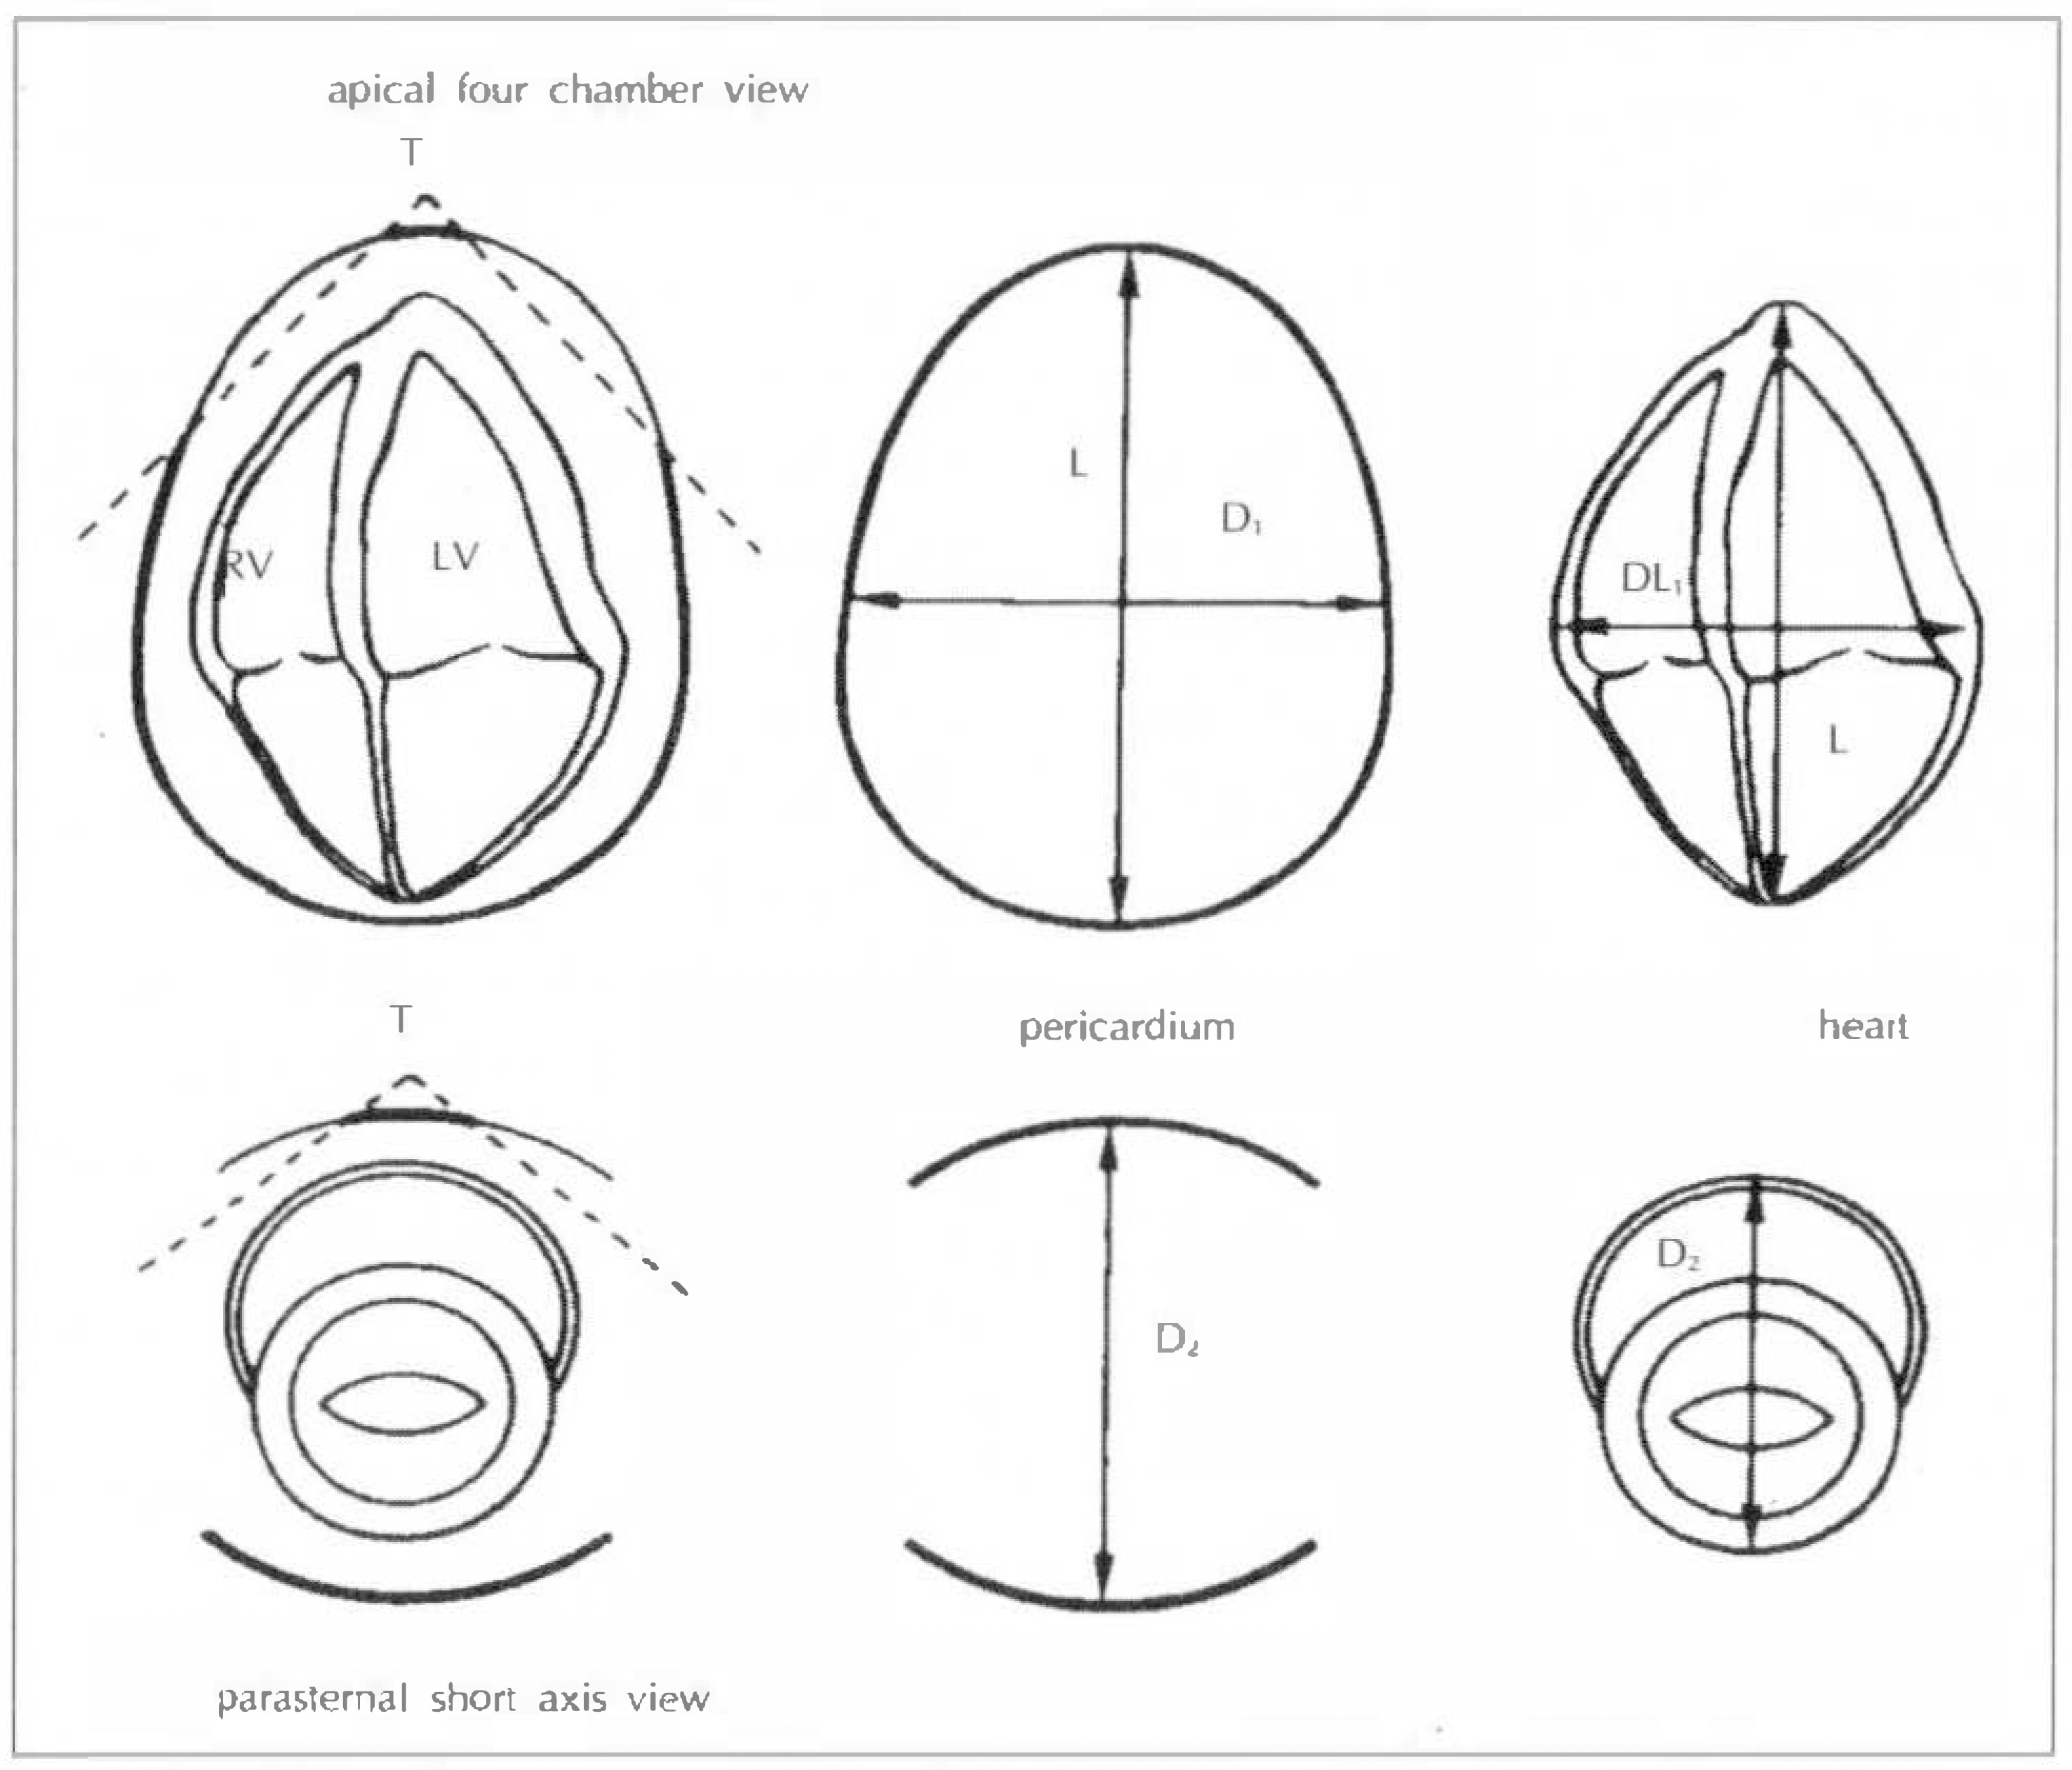 | Fig. 1.Diagram showing measurement of each parameters in the quantitation of pericardial effusion. |


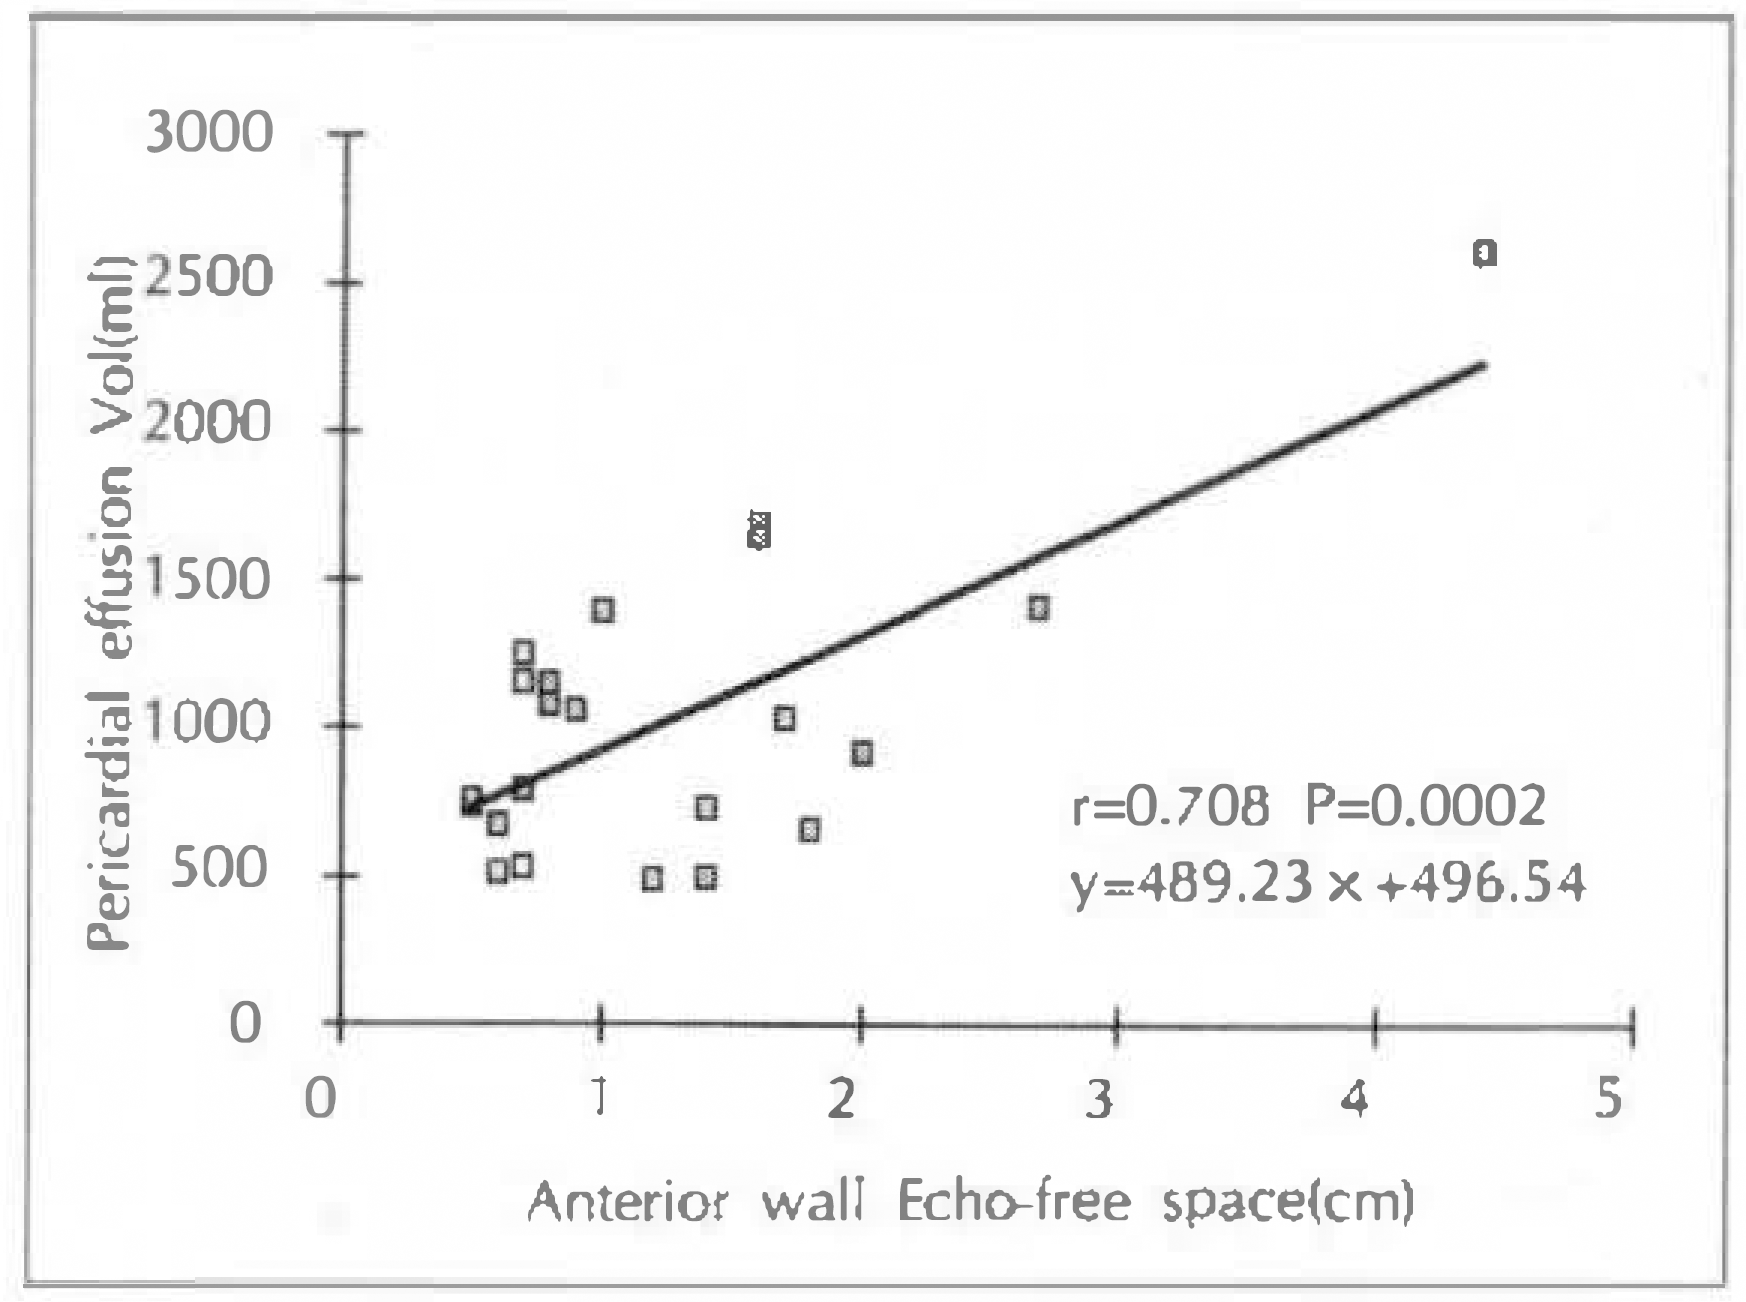
Table 1.
Clinical characteristics and echocardiographic findings of study populations
 XML Download