Abstract
Background
Measurement of coronary flow velocity in clinical cases contributes to understanding the pathophysiology of coronary circulation. To evaluate the coronary hemodynamics, we analyzed the pattern of coronary flow velocity with a new device consisting of 15Mhz piezoelectric transducer integrated onto the tipped 0.018 inch or 0.014 inch flexible, steerable angioplasty guidewire.
Method
A low profile (0.018 in. or 0.014 in.) Doppler angioplasty guidewire was used to measure the basal blood flow velocity in proximal coronary artery after intracoronary infusion of 200μg nitroglycerine, hyperemic blood flow velocity after intracoronary infusion of adenosine (12μg for LCA, 6μg for RCA). We measured several parameters such as APV (average peak velocity, cm/sec), DSVR (diastolic systolic velocity ratio), MPV (maximal peak velocity, cm/sec), PVI (peak velocity integral, cm), SPVI (systolic peak velocity integral, cm), DSIR (diastolic systolic integral ratio), ASPV (average systolic peak velocity, cm/sec) in basal and hyperemic states. This measurements were made in 17 patients undergoing coronary angiography.
Results
1) APV, ADPV, MPV, in the basal state were higher in LCA than in RCA (32.1 ± 16.6, 40.0 ± 23.6, 57.1 ± 29.0/15.8 ± 9.1, 17.1 ± 10.2, 24.5 ± 20.9cm/sec) and DSVR was also higher in LCA (2.7 ± 2.1/1.4 ± 0.6). But ASPV and SPVI was not different (p> 0.05). Significant increases in APV were noted in LCA (32.1 ± 16.6 → 60.6 ± 17.6cm/sec) and in RCA (15.8 ± 9.1 → 42.1 ± 15.5cm/sec) after adenosine infusion compared with basal state. DSVR measured in basal state were not statistically different from values in hyperemic state in LCA and RCA (2.7 ± 2.1 → 2.3 ± 1.7, 1.4 ± 0.6 → 1.4 ± 0.5, p > 0.05).
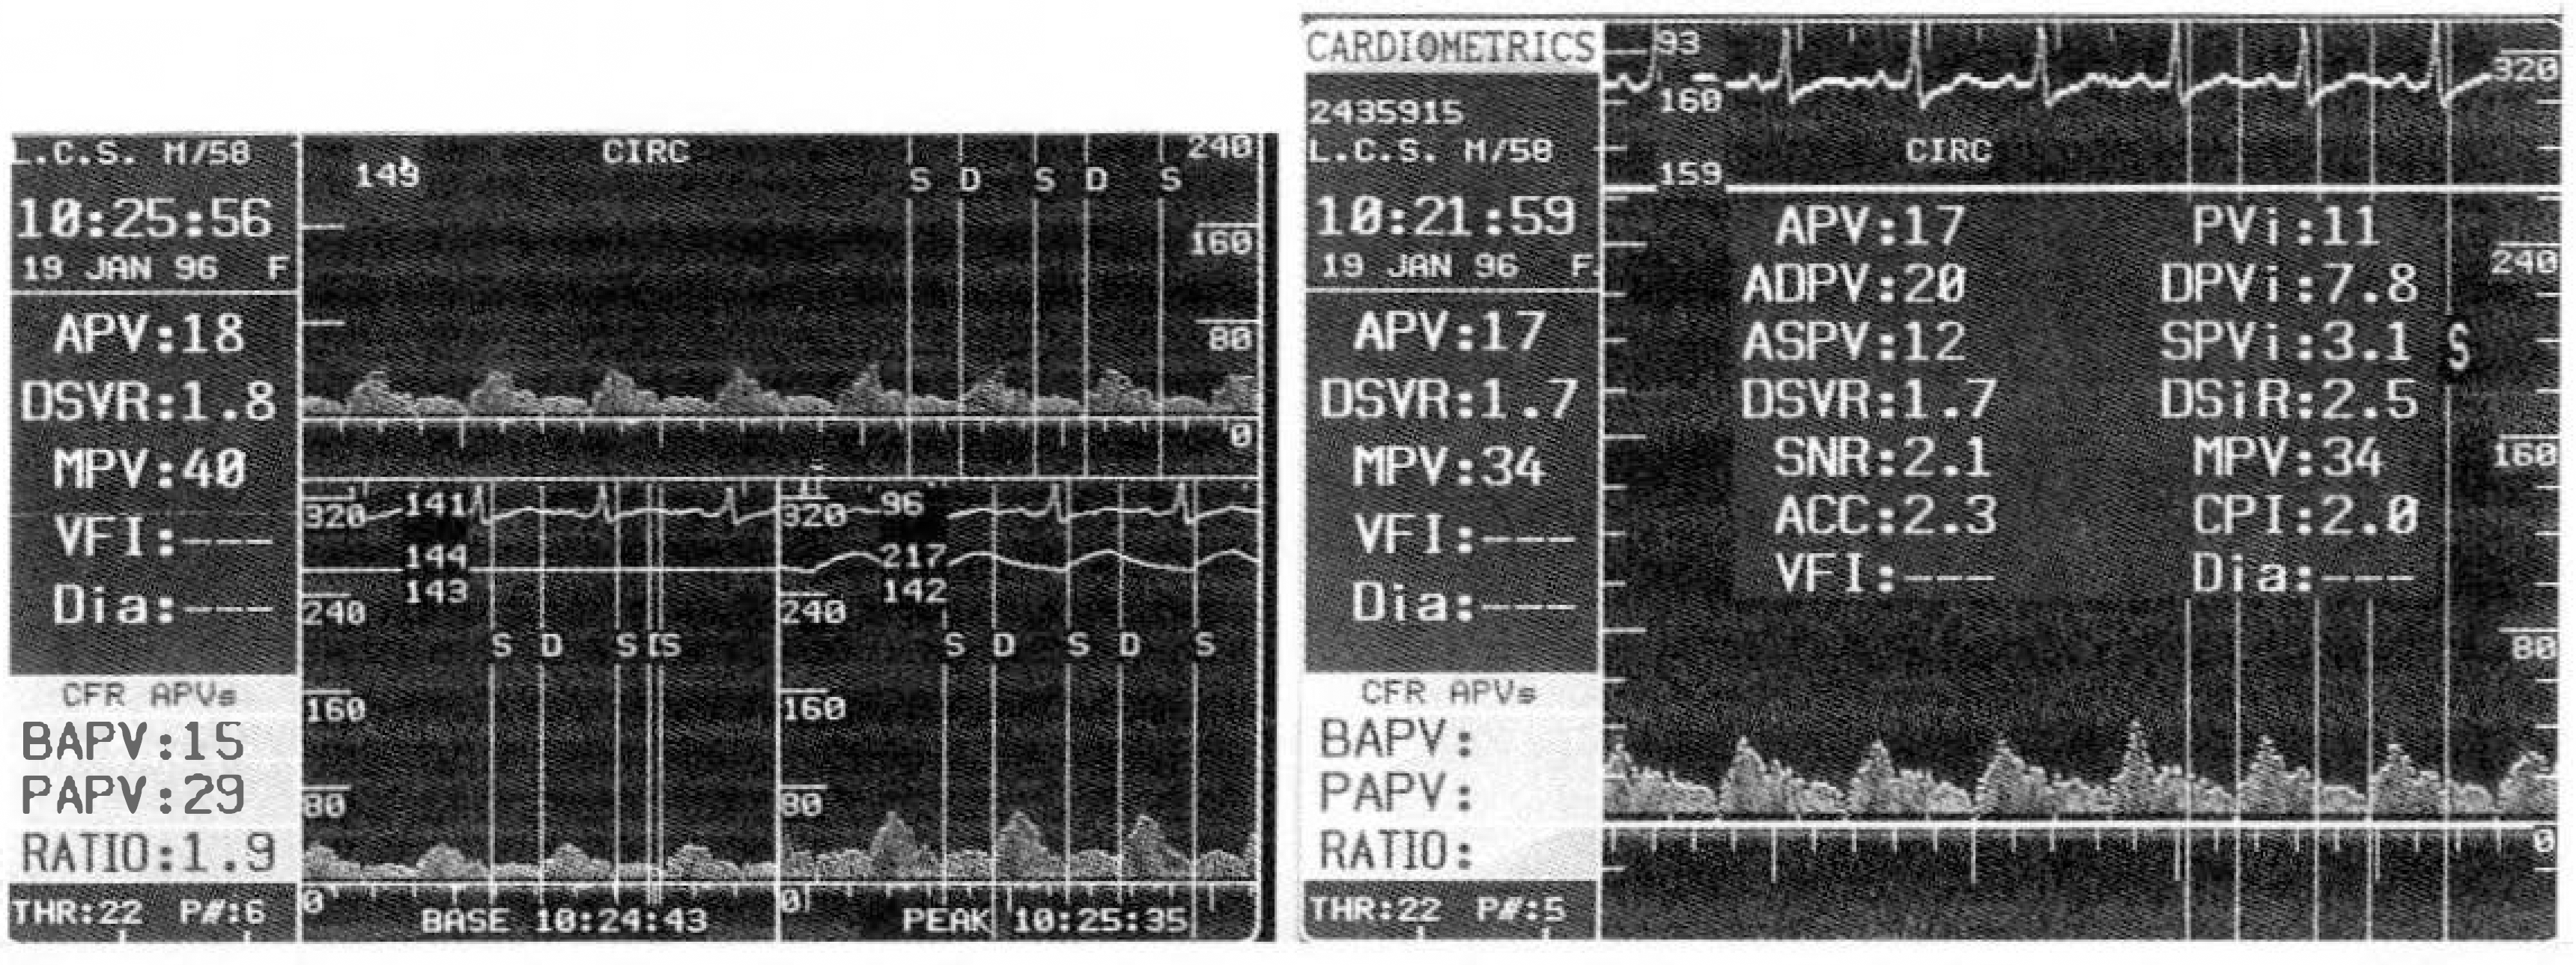
Fig. 1.
Diastolic dominant flow pattern in the proximal segment of moderately stenotic left coronary artery(left) and measured several parameters(right).
APV=Average peak velocity
ASPV=Average systolic peak velocity
PVi = Peak velocity integral
SPVi=Systolic peak velocity integral
ADPV=Average diastolic peak velocity
DSVR=Diastolic systolic velocity ratio
DPVi = Diastolic peak velocity integral
DSiR= Diastolic systolic integral ratio
MPV=Mean peak velocity

Table 1.
Patients Characteristics
Table 2.
Parameters between both coronary arteries in the basal state


 PDF
PDF ePub
ePub Citation
 Print
Print


 XML Download