Abstract
Background
Diastolic dysfunction of left ventricle appears to be one of the earliest detectable abnormalities in a number of disorders. The aims of this study is to evaluate the influence of left ventricular diastolic dysfunction on left atrial function in patients with ischemic heart diseases.
Method
Echocardiography, coronary and left ventricular(LV) angiography and LV catheterization were performed in 43 patients with ischemic heart disease to assess the influence of left ventricular(LV) diastolic dysfunction on left atrial function. They were divided to two groups by the absolute increase in left ventricular pressure during left atrial contraction(A amplitude; Group I: > 5mmHg, Group II: < 5mmHg).
Results
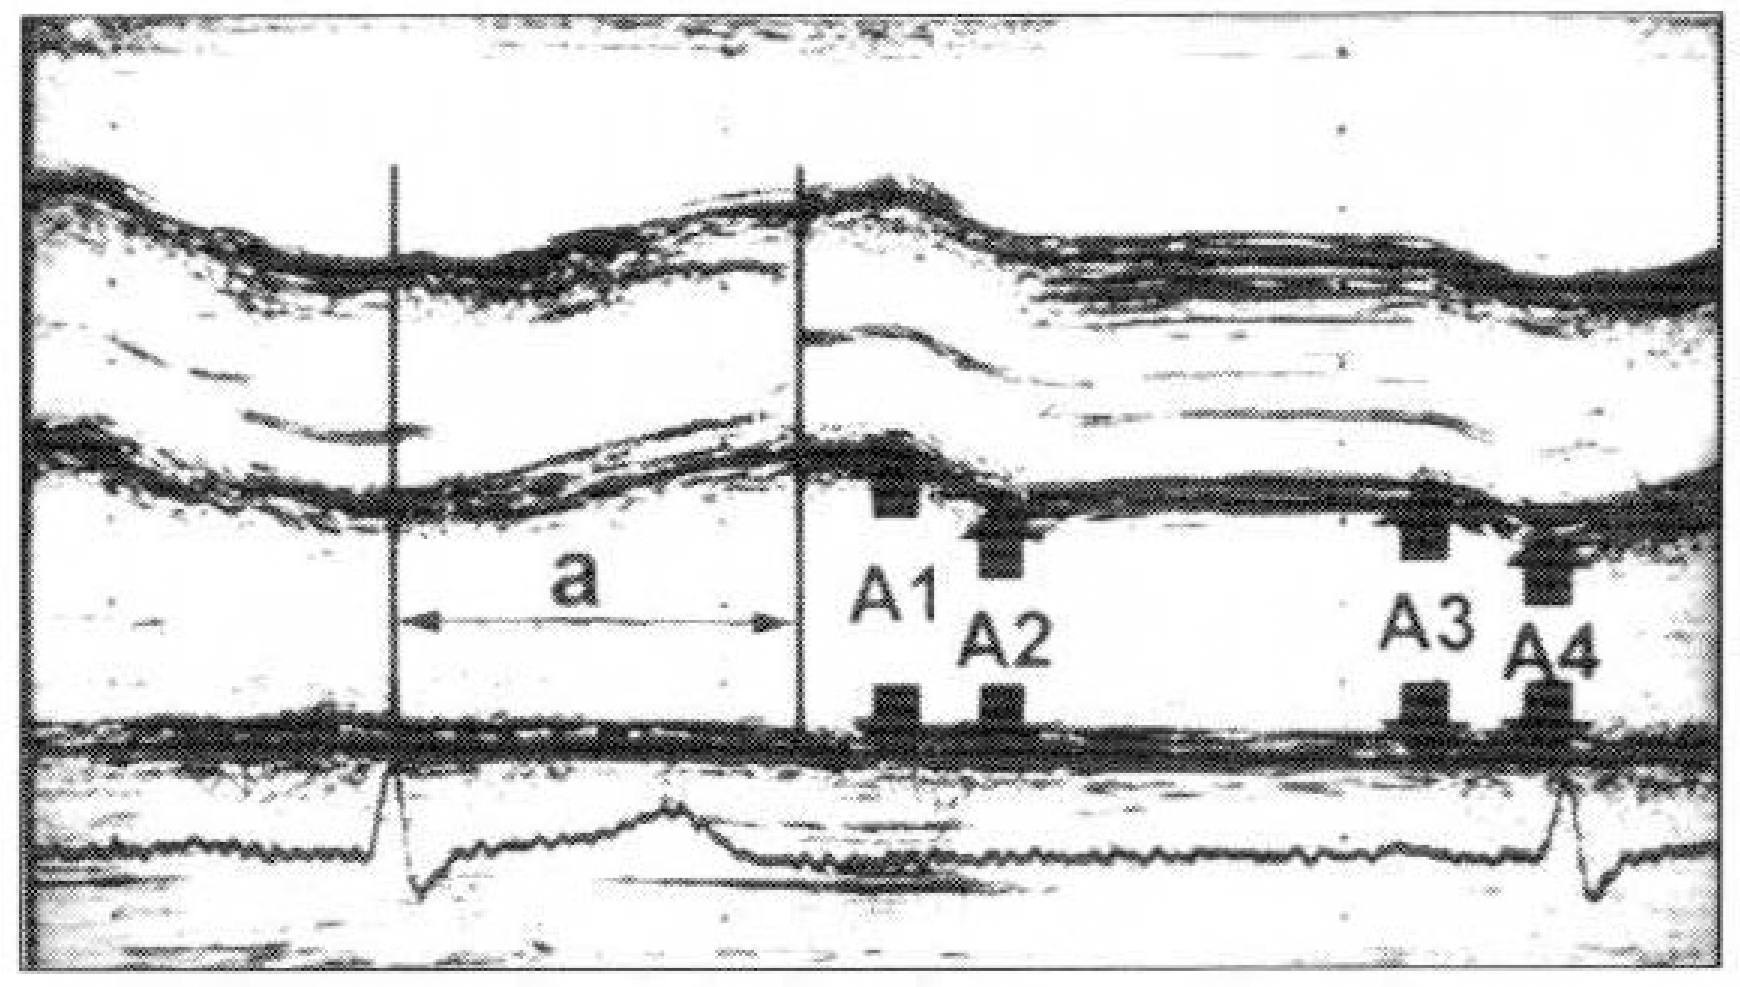
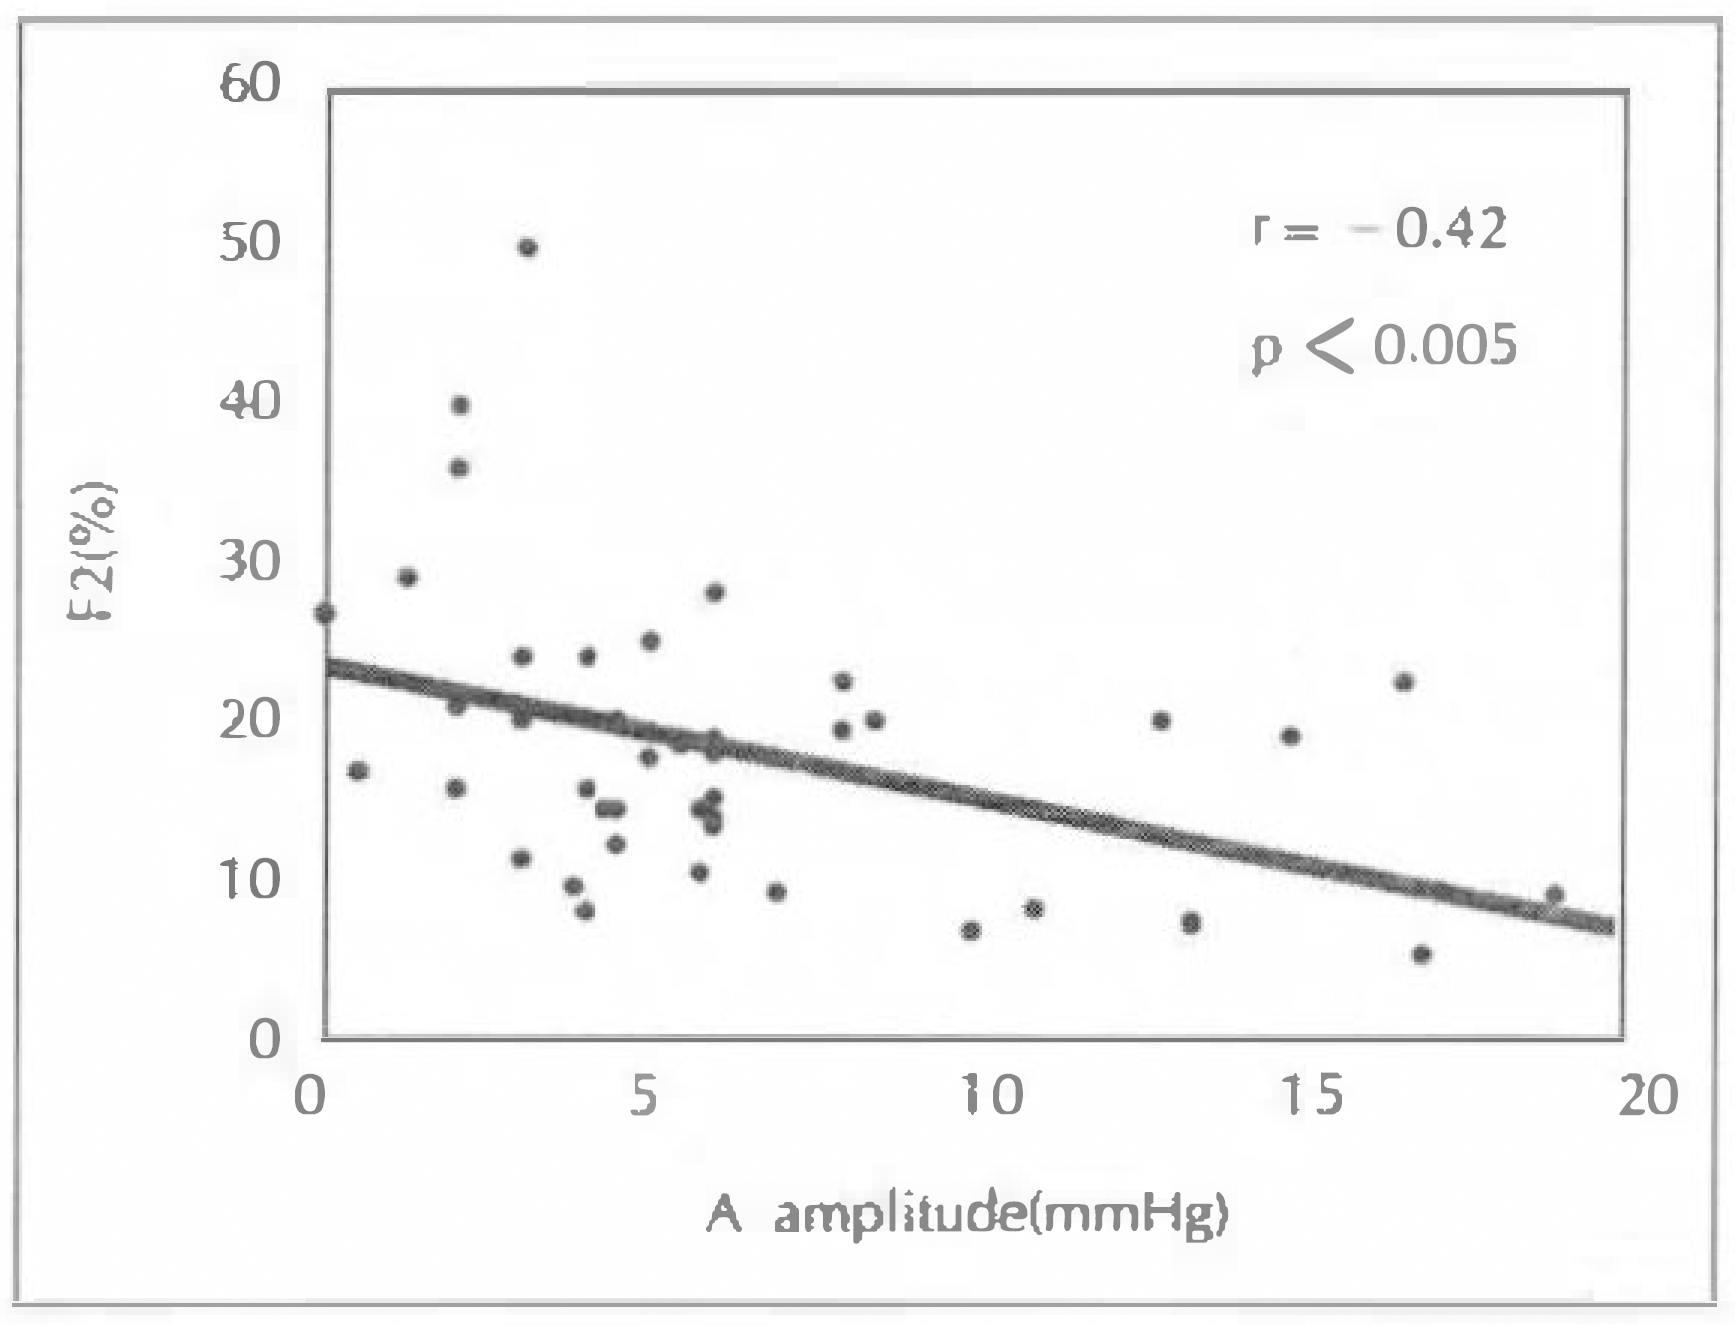
There were no significant difference in severity of coronary arterial lesions and Doppler echocardiographic parameters between the two groups. In M-mode echocardiography, left atrial dimensions were measured at presystole(Al), early diastole(A2), and before and after left atrial contraction (A3, A4). In Group I, Al was 37.3 ± 5.1mm, A2 was 33.8 ± 5.2mm, A3 was 34.4 ± 5.5mm, and A4 was 29.3 ± 5.0mm. In Group II, Al, 37.0 ± 4.1mm, A2, 33. 2 ± 4.9mm, A3, 34.1 ± 4.3mm, and A4, 28.5 ± 4.6mm. The fractional shortening of early and late diastolic phase of left atrium[Fl = (A1-A2)/A1 × 100), F2 = ((A3-A4)/A3× 100)] by the formula were 9.4 ± 5.1 %, 14.9 ± 6.7 % each, in Group I. In Group II, 12.1 ± 7.3 %, 20.6 ± 10.2 % each. F2 was higher in Group II (p < 0.05). Left ventricular end diastolic pressure(LVEDP), LV pressure just before atrial contraction(Pre-A pressure) and absolute increase in left ventricular pressure during left atrial contraction(A amplitude) were more higher in group 1 (Group I: 18.4 ± 7.9mmHg, 10.0 ± 5.7mmHg, 10.3 ± 4.4mmHg, Group 11: 9.77 ± 5.4mmHg, 6.5 ± 4.1mmHg, 3.5 ± 1.6mmHg, p < 0.0005, p <0.05, p < 0.0001). There was a good negative correlation between A amplitude and F2(r = – 0.42, p < 0.005).
Conclusion
In patients with ischemic heart disease, LVEDP was higher and left ventricular ejection fraction and late diastolic fractional shortening of left atrium were lower in group with higher A amplitude. Thus, left atrial systolic function was reduced in proportion to left ventricular stiffness.
References
1). Thomas JD, Weyman AE. Echocardiographic Doppler evolution of left ventricular diastolic function. Circulation. 84:977. 1991.
2). Lawson WE, Brown EJ Jr, Swinford RD, Proctor Claire, Cohn PF. A new use for M-mode echocardiography in detecting left ventricular diastolic dysfunction in coronary artery disease. Am J Cardiol. 58:210. 1986.

3). 컴동운 · 손대원 · 요병회 박영배 · 최윤식 · 서정 돈 이영우. 허혈성 심질환에서 비판혈척인 방법 을 이용한 화심실 확장기 기능의 변화. 순환기. 19:651. 1989.
4). 정익모 – 조숭연 · 박성상, 백경원 · 성원홈 – 박숭 정 – 검성순 이웅구: 성근 경색중 환자에서 간혈 척 도플러 심초음파 검사에 의한 싱실 확장 기능 에 관한 연구 대한내과학회잡지. 35:497. 1988.
5). Bonow RO, Bacharach SL, Green MV, Kent KM, Rosing DR, Lipson LC, Leon MB, Epistein SE. Impaired left ventricular diastolic filling in patients with coronary arterial disease: Assessment with radionuclide angiography. Circulation. 64:2. 1981.
6). Langer GA. Ion fluxes in cardiac excitation and contraction and their relation to myocardial contractility. Physio Rev. 48:708. 1968.

7). Nishimura RA, Abel MD, Hatle LK, Tajik AJ. Assessment of diastolic function of the heart: Background and current applications of Doppler echocardiography. Mayo Clin Proc. 6:181. 1989.
8). Mulvagh S, Quinones MA, Kleiman NS, Jorge CB, Zoghbi WA. Estimation of left ventricular end-diastolic pressure from Doppler transmitral flow velocity in cardiac patients independent of systolic performance. J Am Coll Cardiol. 20:112. 1992.

9). Rossvoll Ole, Hatle LK. Pulmonary venous flow velocities recorded by transthoracic Doppler ultrasound: Relation to left ventricular diastolic pressure. J Am Coll Cardiol. 21:1687. 1993.
10). Judkins MP. Selective coronary angiography. Part I: A percutaneous transfemoral technic. Radiology. 89:815. 1967.
11). Bristow JD, Van Zee BE, Judkins MP. Systolic and diastolic abnormalities of the left ventricle in coronary artery disease. Circulation. 219:1970.

12). Pouleur H, Rousseau MF, Van Eyll C, Gurne O, Hanet C, Charlier AA. Impaired regional diastolic distensibility in coronary artery disease: Relations with dynamic left ventricular compliance. Am Heart J. 112:721. 1986.

13). 이상호 · 박영훈 · 손만수 · 백선홈 · 최재웅 · 안태 훈 · 신익끌. 급성 심근경색중 환자에서 도플러 심초음파즙 이용한 좌섬설 충만에 관한 고찰. 순환 기. 23:223. 1993.
14). Williams JF, Sonnenblick EH, Broundwald E. Determinants of atrial contractile force in the intact heart. Am J Physio. 209:1061. 1965.

15). Nishigaki Kazuhiko, Arakawa Michio, Miwa Hiroshi, Kagawa Kensaku, Noda Toshiyuki, Ito Yoshimi. A study on left atrial transport function effect of age or left ventricular ejection fraction on left atrial storage function. The Journal of Vascular Disease. 45:953. 1994.
16). Wind BE, Snider AR, Buda AJ, O'Neill WW, Topol EJ, Dilworth LR. Pulsed Doppler assessment of left ventricular diastolic filling in coronary artery disease before and immediately after coronary angioplasty. Am J Cardiol. 59:1041. 1987.

17). Miller TR, Grossman SJ, Schectman KB, Biello DR, Ludbrook PA, Ehsani AA. Left ventricular diastolic filling and its association with age. Am J Cardiol. 58:531. 1986.

18). Braunwald E, Frahm CJ. Studies on Starlings law of the heart, IV: observations on the haemodynamic functions of the left atrium in man. Circulation. 24:633. 1996.
19). Rahmitoola SH, Ehsani A, Sinno MZ, Leo HS, Rosen KM, Gunnar RM. Left atrial transport in myocardial function: importance of its booster pump function. Am J Med. 59:686. 1975.
20). Clarkson PBM, Wheeldon NM, Lim PO, Pringle SD, MacDonald TM. Left atrial size and function: assessment using echocardiographic automatic boundary detection. Br Heart J. 74:664. 1995.

21). Matsuda Yasuo, Toma Yoichi, Ogawa Hiroshi, Matsuzaki Masunori, Katayama Kazuhiro, Fujii Takashi, Yoshino Fumio, Moritani Kohshiro, Kumada Toshiaki, Kusukawa Reizo. Importance of left atrial function in patients with myocardial infarction. Circulation. 67:566. 1983.

22). Appleton CP, Galloway JM, Gonzalez MS, Gaballa M, Basnight MA. Estimation of left ventricular filling pressure using two dimensional and Doppler echocardiography in adult patients with cardiac disease. J Am Coll Cardiol. 22:1972. 1993.
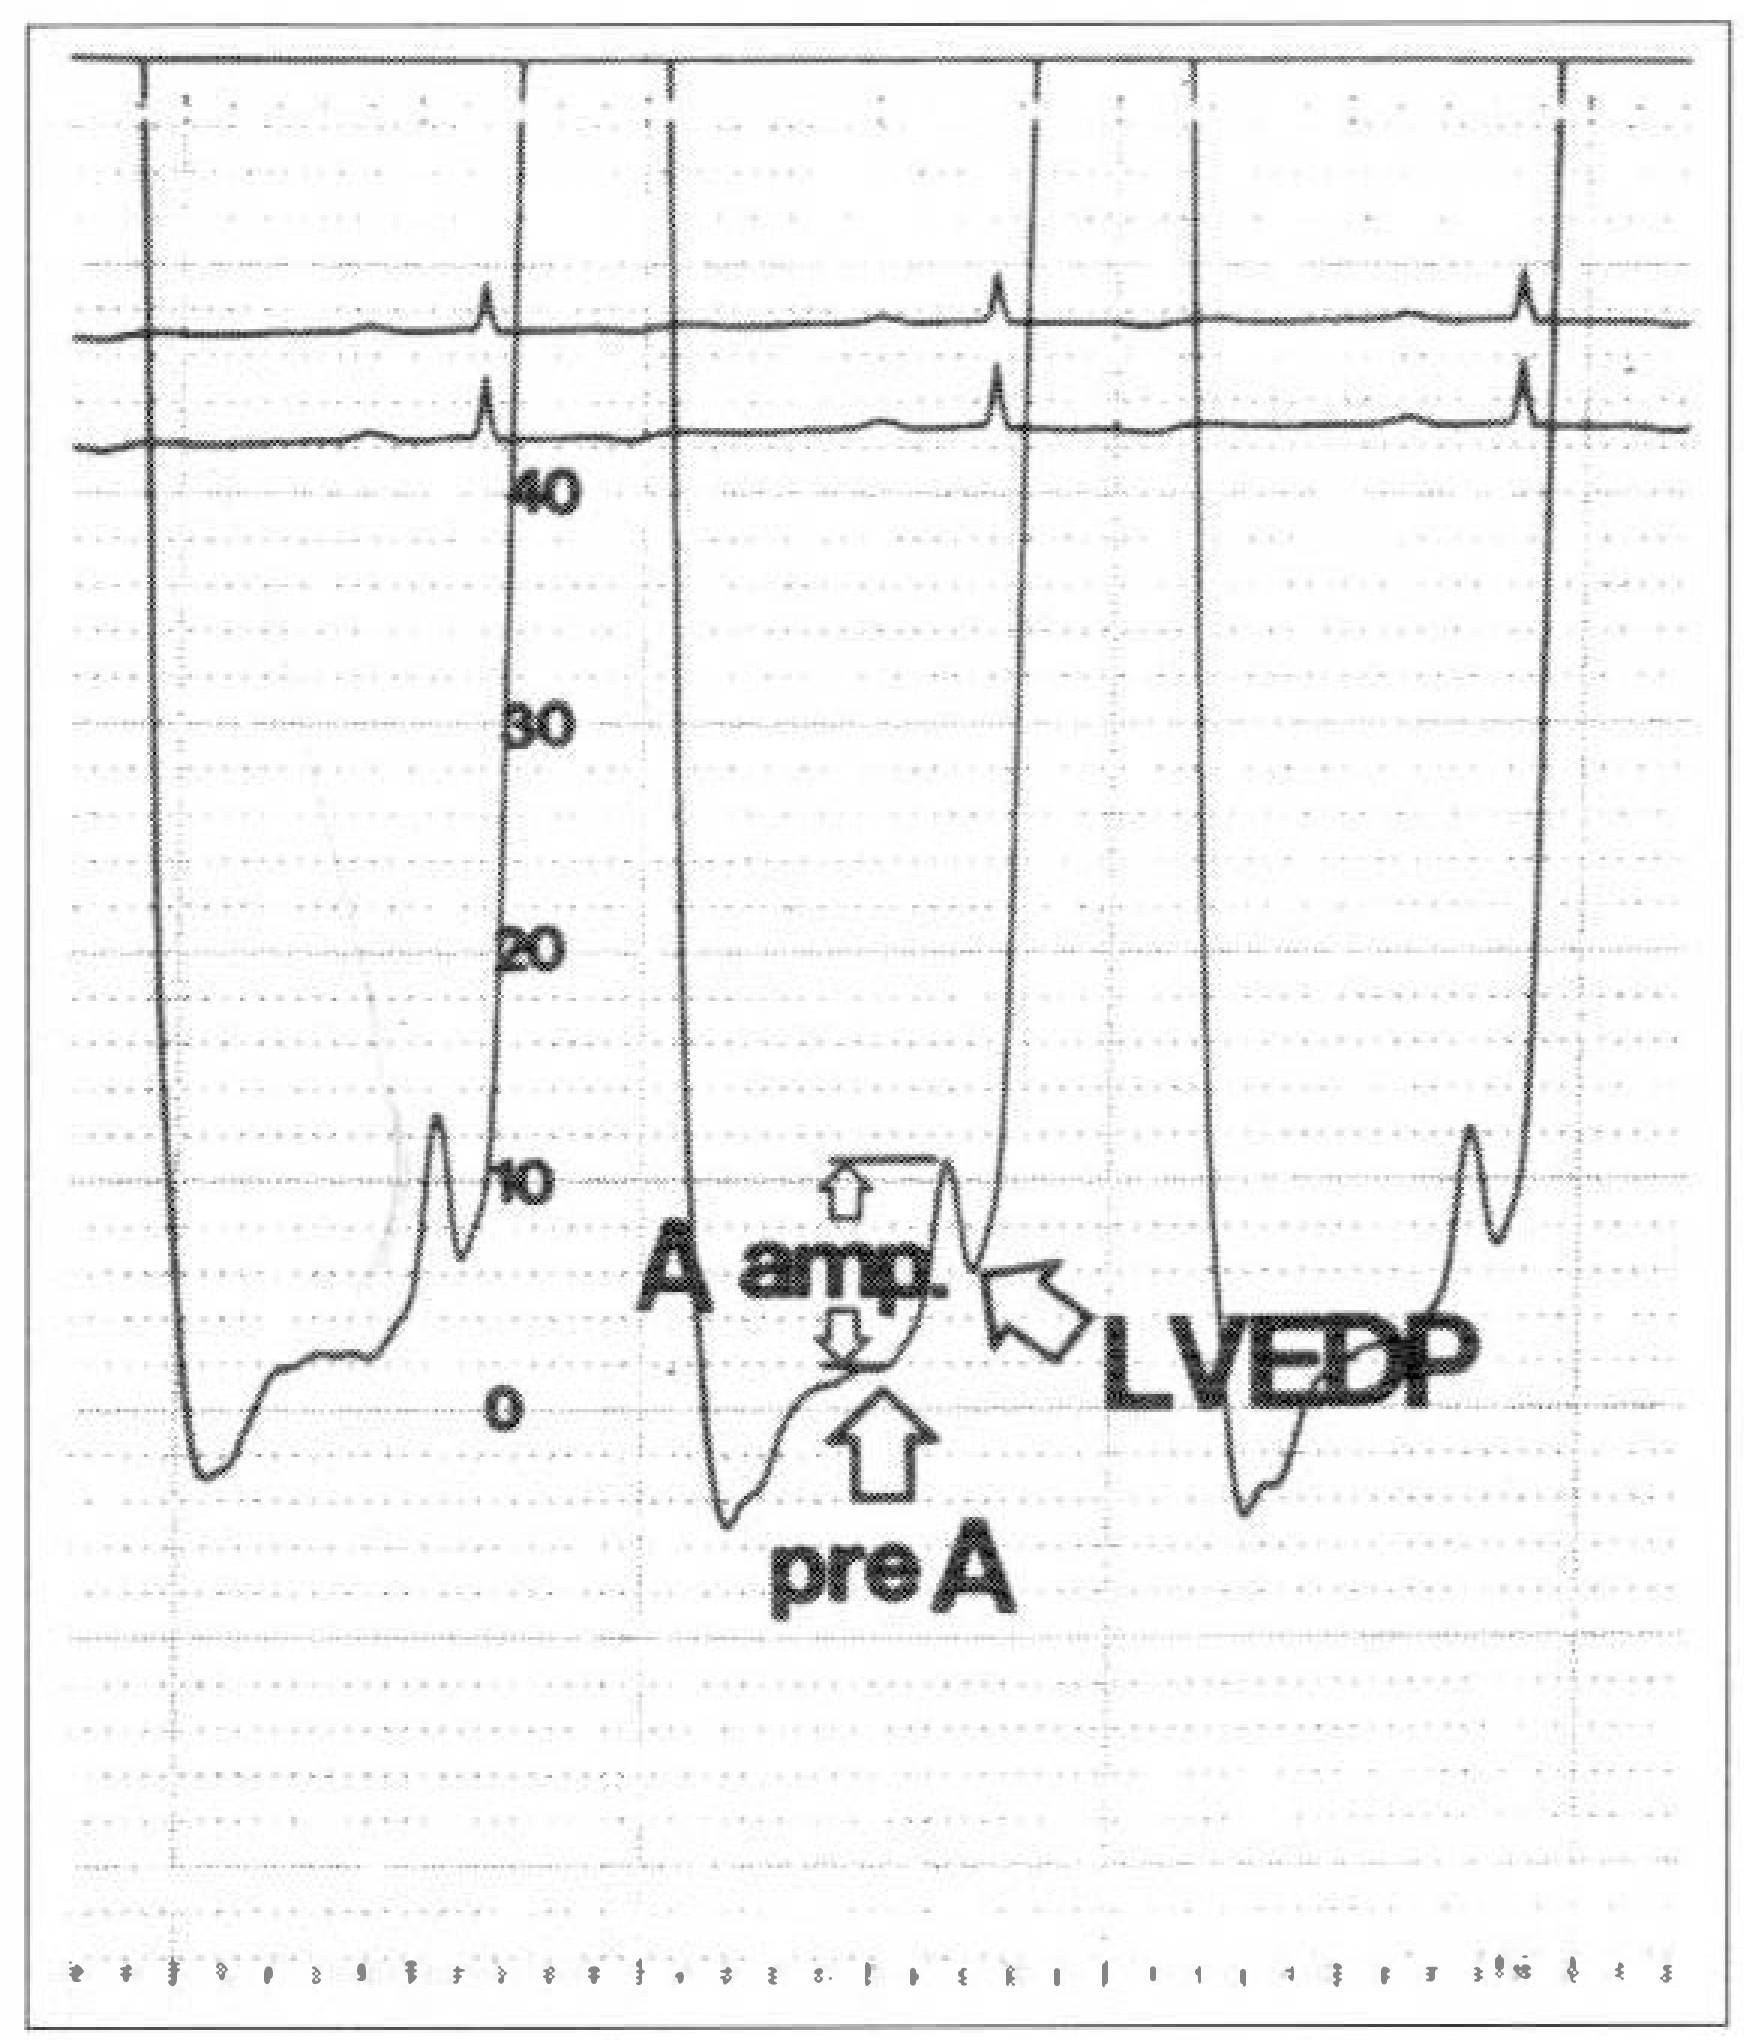
Fig. 1.
The left ventricular pressure recording illustrating pressure measurements in this study. These included left ventricular pressure just before atrial contraction(pre-A), left ventricular end diastolic pressure(LVEDP) and the absolute pressure increase in left ventricle that occurred as a result of left atrial contraction(A amp.).

Fig. 2.
Measurements of the left atrial dimensions in M-mode echocardiography, left atrial dimensions were measured at presystole(A1), early diastole(A2), and before and after left atrial contraction(A3, A4). a: interval between R wave and closure of aortic valve.

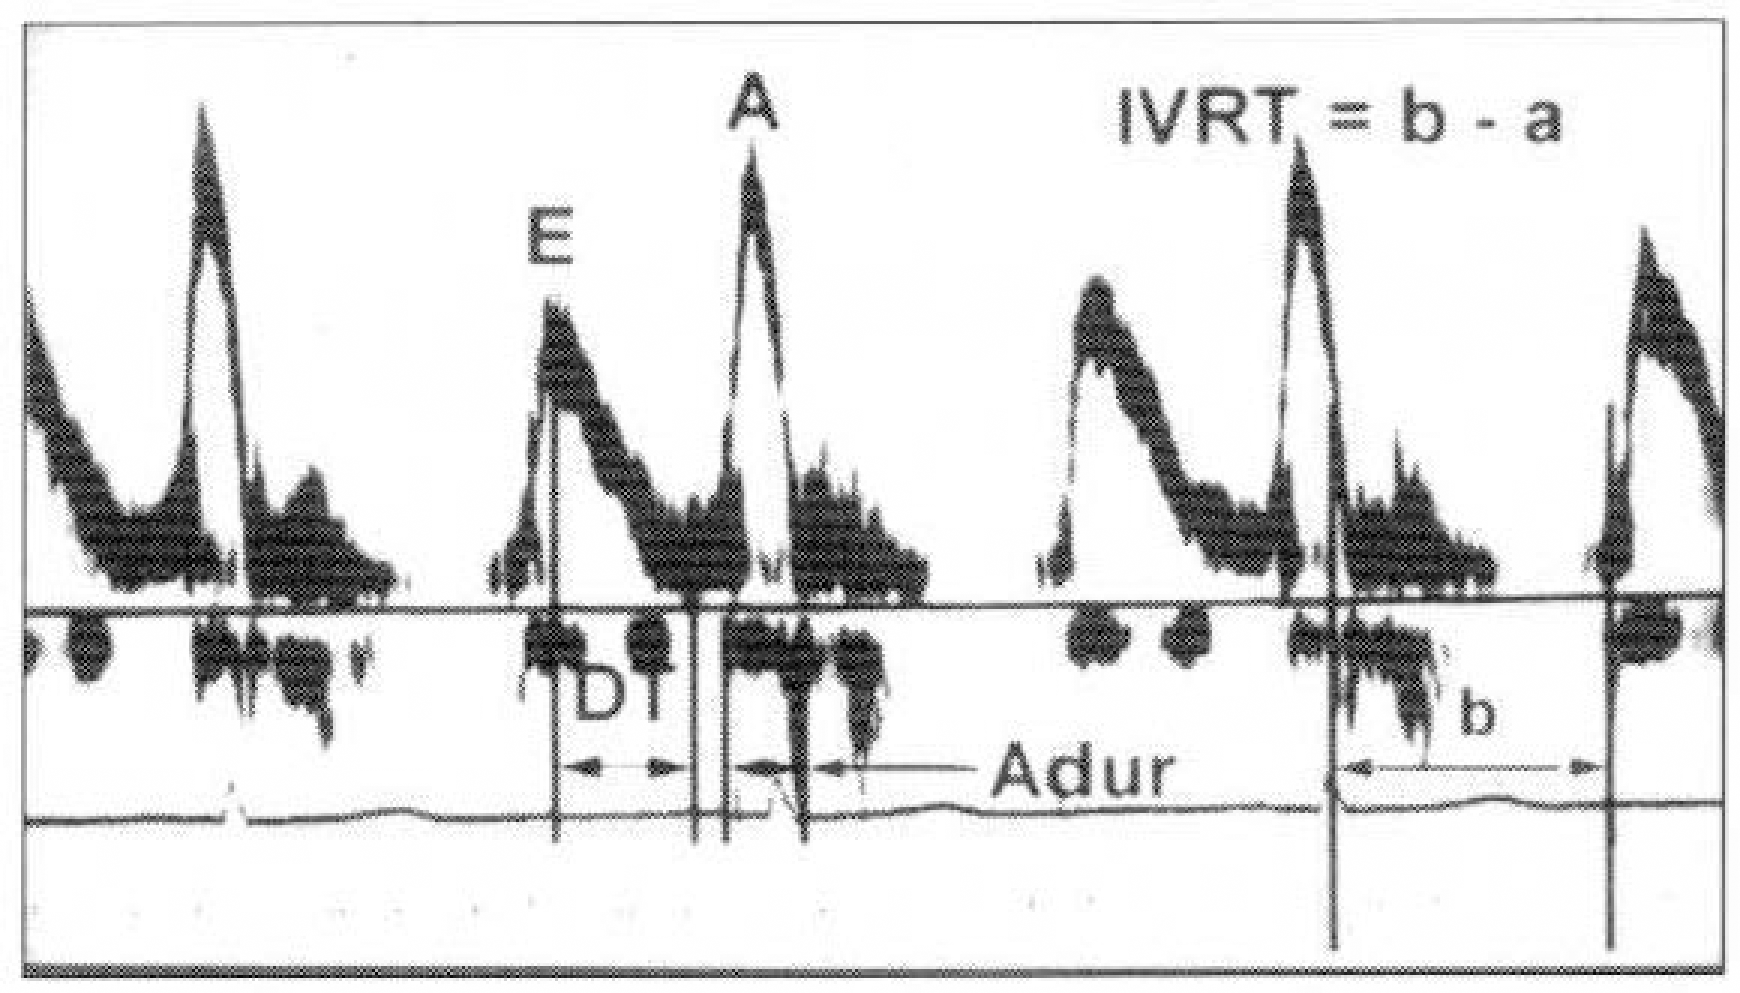
Fig. 3.
The Doppler echocardiographic recording of transmitral flow illustrating several of the Doppler variables measured in this study. E: peak velocity of early mitral flow, A: peak velocity of late mitral flow, IVRT: isovolumic relaxation time, A dur.: duration of late mitral flow. DT: deceleration time of mitral flow b: interval between R wave and onset of E wave.

Fig. 4.
The correlation between the absolute increase in left ventricular pressure during atrial contraction(A amplitude) and the fractional shortening of late diastolic phase of left atrium(F2). This figure shows a good negative correlation between them.

Table 1.
Clinical and angiographic findings
Table 2.
Comparison of left ventricular angiography and cardiac catheterization findings between two groups
Table 3.
Comparison of m-mode echocardiographic findings between two groups
Table 4.
Comparison of doppler echocardiographic findings between two groups


 PDF
PDF ePub
ePub Citation
 Print
Print


 XML Download