Abstract
Calcification of myocardium is most common in the site of an old infarction or in an aneurysmal wall. In addition, myocardial calcification may occur in association with endomyocardial fibrosis and hyperparathyroidism, as a result of focal toxic or inflammatory myocardial necrosis, as well as in patients undergoing hemodialysis. Calcium deposits due to parasites and due to neoplastic disease may also be seen. But left ventricular endomyocardial calcification associated with apical hypertrophic cardiomyopathy is very rare. This report describes 2 cases of apical hypertrophic cardiomyopathy with left ventricular endomyocardial calcification, diagnosed by the echocardiographic, angiographic and histologic findings.
References
1). Koestner AW, Bush CA, Baba N. Endomyocardial fibrosis with calcification of the myocardium Arch Pathol Lab Med. 102:406. 1978.
2). Silver MA, Bonow RO, Deglin SM, Maron BJ, Cannon RO, Roberts WC. Acquired left ventricular endocardial constriction from massive mural calcific deposits: A newly recognized cause of impairment to left ventricular filling. Am J Cardiol. 53:1468. 1984.

3). Bolz KD, Bathen J, Skjaepe T, Halovorsen TB. Massive left ventricular endomyocardial calcification associated with apical hypertrophic cardiomyopathy. Fortschr Geb Rontgenstr Nuklearmed Erganzungsband. 149:436. 1988.

4). Terman DS, Alfrey AC, Hammond WS, Donndelinger T, Ogden DA, Holmes JH. Cardiac calcification in uremia. Am J Med. 50:744. 1971.

5). Sakamoto T, Tei C, Murayama M, Ichiyasu H, Hada Y, Hayashi T, Amano K. Giant T wave inversion as a manifestation of asymmetrical apical hypertrophy of the left ventricle. Echocardiographic and ultrasonographic study. Jpn Heart J. 17:611. 1976.
6). Yamaguchi H, Nakanishi S, Nishijo T, Nagasaki F, Matsumoto S, Ishimura T. Hypertrophic cardiomyopathy with giant negative T wave Jpn Circ J. 40(suppl):110. 1976.
7). Yamaguchi H, Ishimura T, Nishiyama S, Nagasaki F, Nakanishi S, Takatsu F, Nishijo T, Umeda T, Machii K. Hypertrophic nonobstructive cardiomyopathy with giant negative T waves(Apical hypertrophy): ventriculgraphic and echocardiographic features in 30 patients. Am J Cardiol. 44:401. 1979.
8). Maron BJ. Apical hypertrophic cardiomyopathy: The continuing saga. J Am Coll Cardiol. 15:91. 1990.

9). Webb JG, Sasson Z, Rakowski H, Liu P, Wigle ED. Apical hypertrophic cardiomyopathy: Clinical follow-up and diagnostic correlates. J Am Coll Cardiol. 15:83. 1990.

10). Louie EK, Maron BJ. Apical hypertrophic cardiomyopathy: Clinicakl and two-dimensional echocardiographic assessment. Ann Intern Med. 106:663. 1987.
11). 이명곤 • 박종수 • 안영근 · 박주형 ‘ 정명호 • 조정 판 • 박종훈 • 강정채. 원발성 비후형 십근중에서 심근비후 형태에 따른 임상상의 추이. 대한내과학 회지. 45:456. 1993.
12). Kvaerness J, Rinck PA, Bolz KD, Bathen J, Skjaerpe T. MR imaging of apical hypertrophic cardiomyopathy with left ventricular endomyocardial calcification. J Comput Assist Tomogr. 15:489. 1991.
13). Ross EM, Rosing DR, McGuire LB, Maron BM, Roberts WC. Impaired left ventricular systolic and diastolic dilatation associated with papillary muscle calcification in hypertrophic cardiomyopathy. Am J Cardiol. 15:488. 1986.
Fig. 1.
Chest roentgenogram(A) and fluoroscopy(B) show curvilinear calcification within the heart shadow.

Fig. 3.
Two-dimensional echocardiogram of the patient in the parasternal long axis view(A) and apical 4 chamber view(B). LV apex is markedly thickend and echogenic materials are scattered around the inner surface of LV apex.
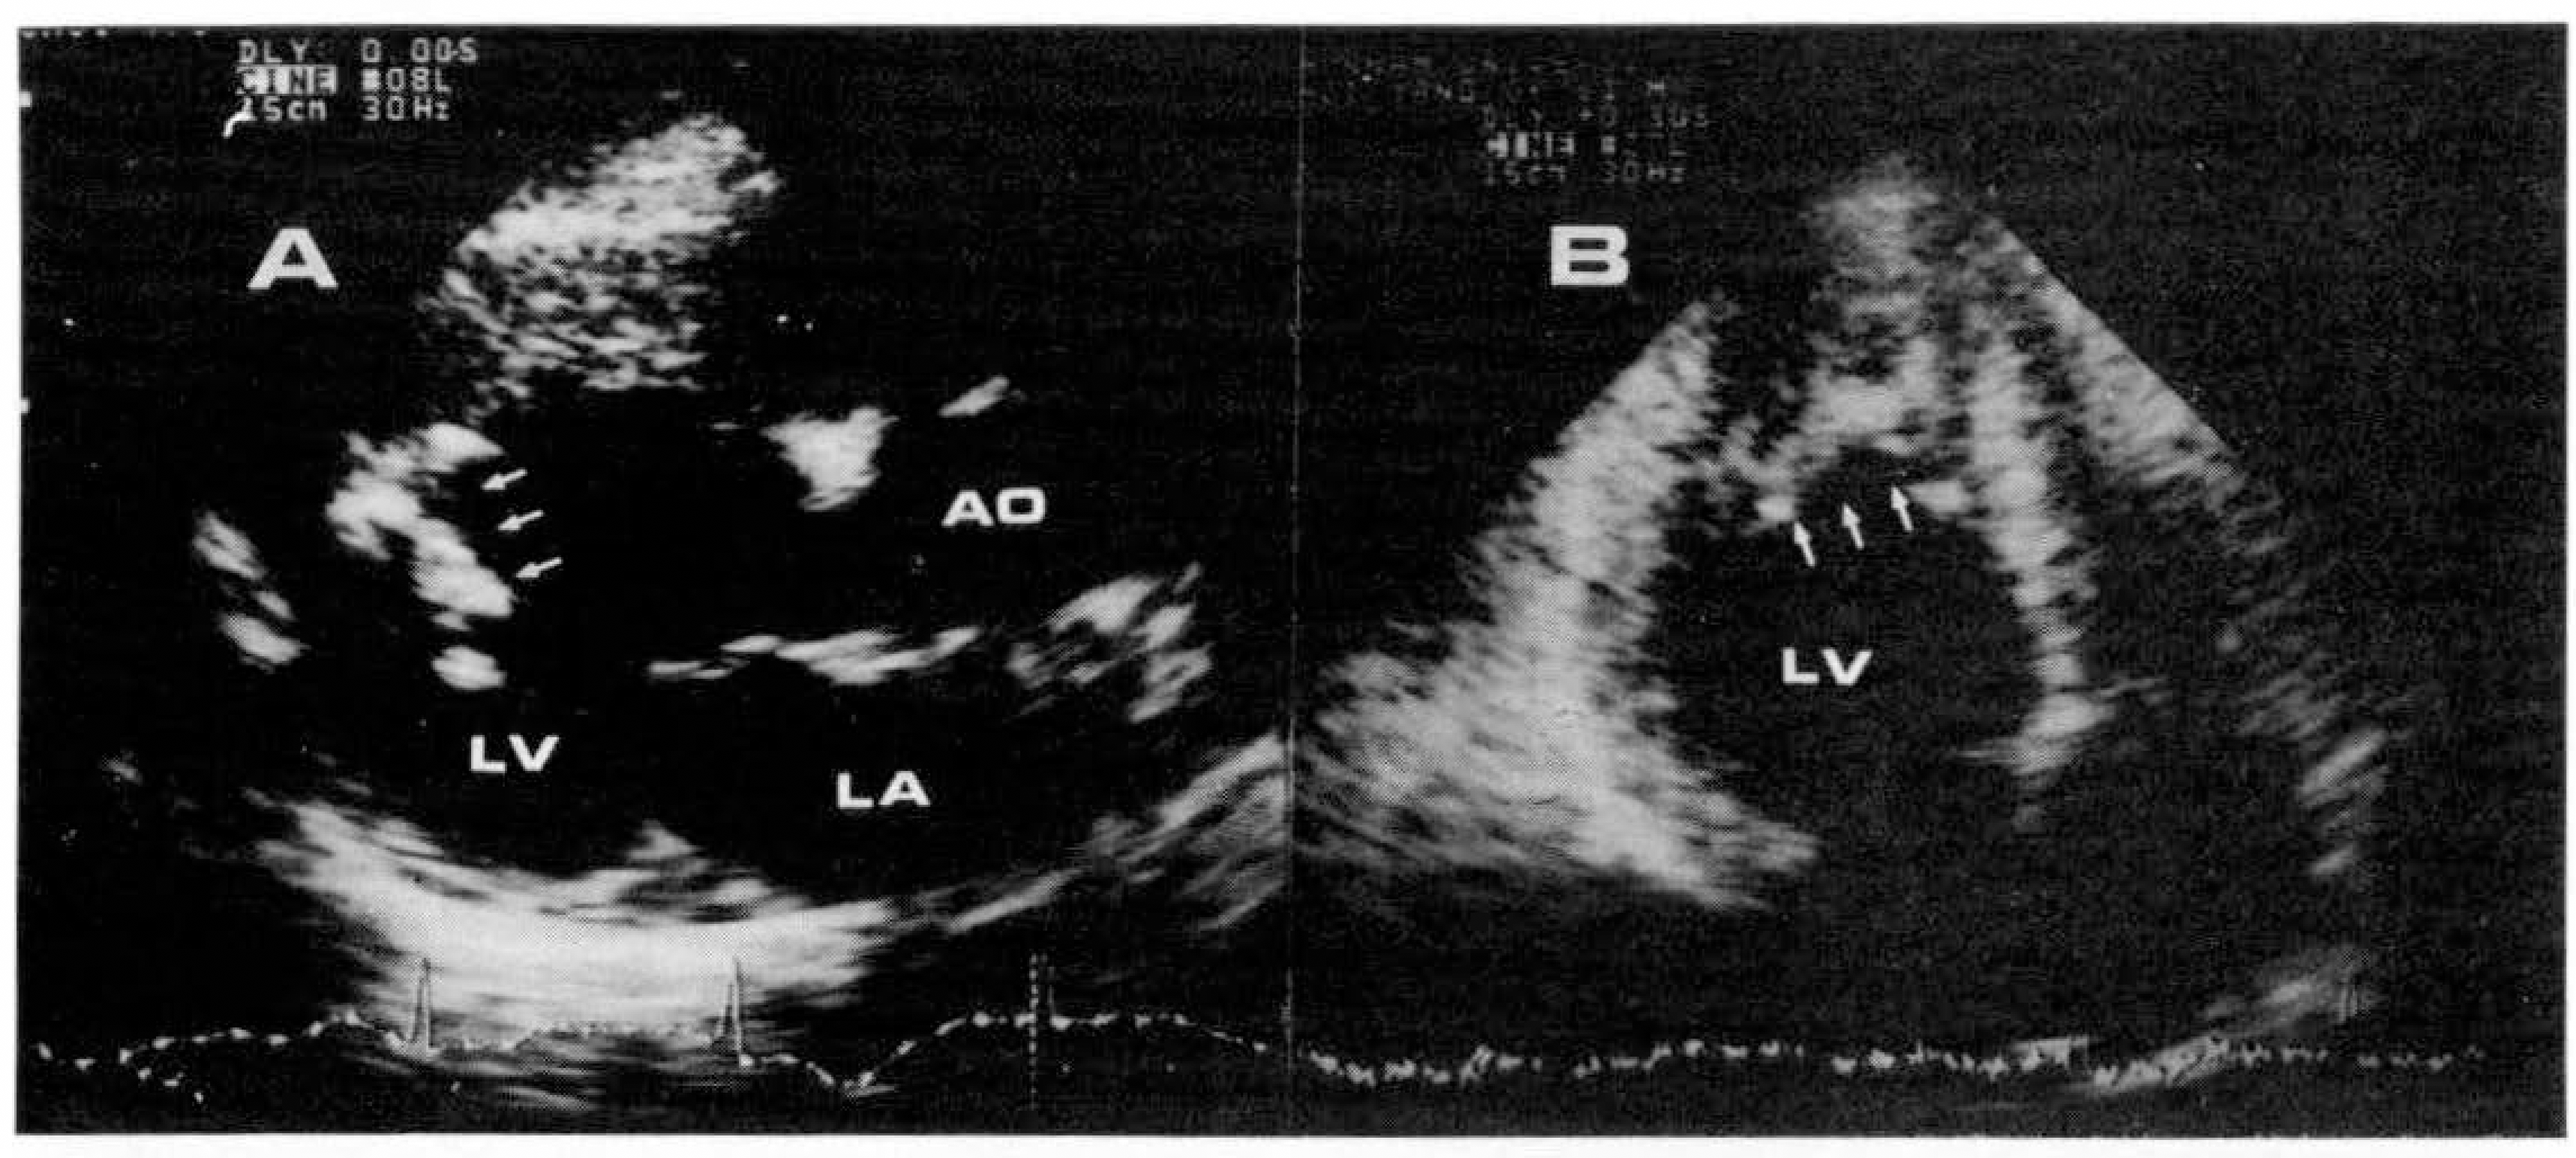
Fig. 6.
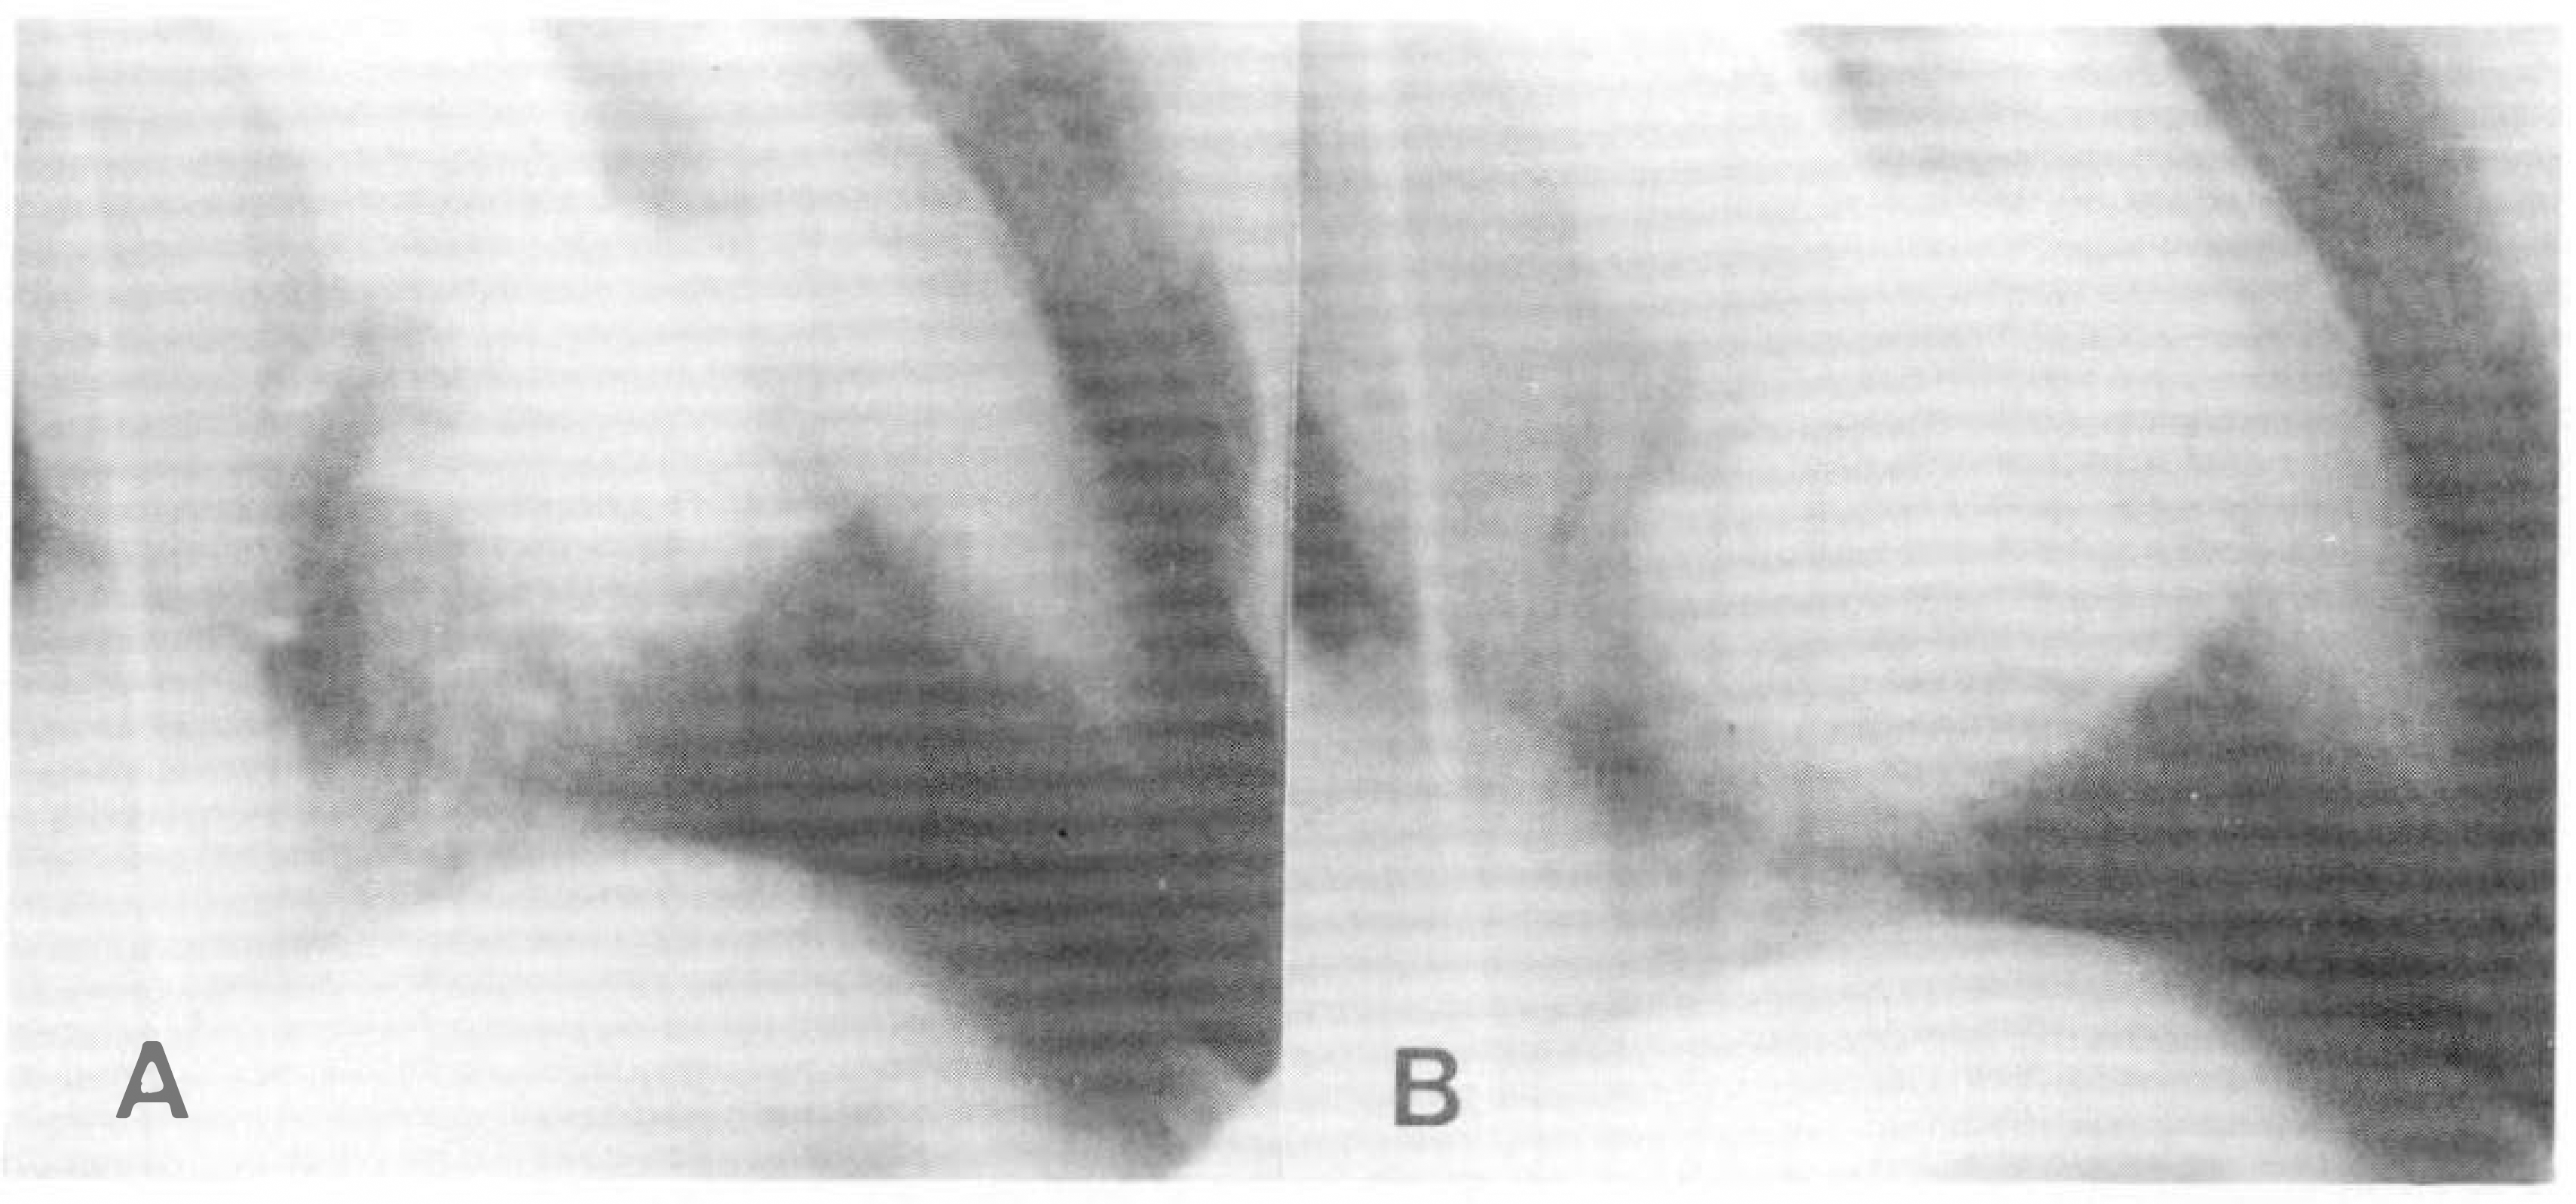
Left ventriculogram(RAO view) shows globular shape of LV cavity during systole(A: systole, B: diastole).

Fig. 8.
Two-dimensional echocardiogram of the patient in the parasternal long axis view(A) and apical 4 chamber view(B). LV wall thickness is markedly increased toward the apex and echogenic materials are scattered around the innner surface of LV apex.

Fig. 10.
Left ventriculogram(RAO view) shows globular shape of LV cavity during systole(A: systole. B: diastole).


 PDF
PDF ePub
ePub Citation
 Print
Print





 XML Download