

 PDF
PDF ePub
ePub Citation
 Print
Print


Abstract
Background
A number of studies have demonstrated that an accurate measurement of the peak tricuspid regurgitation velocity with continuous wave Doppler, which may predict the right ventricular systolic pressure using the simplified Bernoulli equation. However, the peak velocities are often of low intensity on the spectral Doppler display if the tricuspid regurgitation(TR) is not severe. The aim of this study was to evaluate the usefulness of measuring the time interval from pulmonary closure to the end of tricuspid regurgitation, in predicting peak tricuspid regurgitant velocity and hence derive peak right ventricular systolic and pulmonary artery pressure (PAP).
Methods
We studied 19 patients with normal PAP (group A), and 7 with pulmonary hypertension(group B), 27 with postop state of the open cardiac surgery(group C). who underwent echocardiographic and Doppler assessment. Pulmonary elosure(PC) was taken as the closure artifact on the Doppler recording in the main pulmonary artery. Regurgitant flow was identified and recorded in continuous wave mode from the apex. The time interval from end of the TR to PC(TR end PC) was measured, and corrected by 100/min of heart rate.
Results
The time interval of corrected “TR and –PC” was 12.95 ± 48.69 msec in group A, 16.8 ± 43.15 msec in group C, where as 72.43 ± 37.71 msec in group B(p<0.01. comparing with group A). The correlation between TR end –PC and TR gradient was low in group A and C(r=0.12, 0.41 respectively), but high in group B(r=0.73)(TR gradient=0.55 ×TR end-PC + 29.1).
Conclusions
The time interval of TR end –PC in the patients with pulmonary hypertension was higher than normal subjects. And also, we found a good correlation between TR end –PC and TR gradient in patients with pulmonary hypertension. However, in postop state of the open cardiac surgery, there was no significant correlation. The precise explanations of this are by no means clear, but abnormal function of the right ventricle may affect the dynamics of regurgitant flow.
References
1). Stevenson JG. Comparison of several noninvasive methods for estimation of pulmonary artery pressure. J Am Soc Echo. 2:157–171. 1989.

2). Kitabatake A, Inoue M, Asao M. Noninvasive evaluation of pulmonary hypertension by a pulsed Doppler technique. Circulation. 68:302–309. 1983.
3). Dabestani A, Mahan G, Gardin JM. Evaluation of pulmonary artery pressure and resistance by pulsed Doppler echocardiography. Am J Cardiol. 59:662–668. 1987.
4). Kosturakis D, Goldberg SJ, Allen HD, Loeber C. Doppler echocardiographic prediction of pulmonary arterial hypertension in congenital heart disease. Am J Cardiol. 53:1110–1115. 1984.
5). Chan KL, Currie PJ, Seward JB, Hagler DJ, Mair DD, Tajik AJ. Comparison of three Doppler ultrasound methods in the prediction of pulmonary artery pressure. J Am Coll Cardiol. 9:549–554. 1987.
6). Stevenson JG, Kawabori I, Guntheroth WG. Noninvasive estimation of peak pulmonary artery pressure by M-mode echocardiography. J Am Coll Cardiol. 70:657–672. 1984.
7). Hatle L, Angelsen B, Tromsdal A. Noninvasive estimation of pulmonary artery systolic pressure with Doppler ultrasound. Br Heart J. 45:157–165. 1981.
8). Yock PG, Popp RL. Noninvasive estimation of right ventricular systolic pressure by Doppler ultrasound in patients with tricuspid regurgitation. Circulation. 70:657–662. 1984.
9). Burstin L. Determination of pressure in the pulmonary artery by external graphic recordings. Br Heart J. 29:396–404. 1967.
10). Brecker SJD, Xiao HB, Stojnic BB, Mbaissouroum M, Gibson DG. Assessment of the peak tricuspid regurgitant velocity from the dynamics of retrograde flow. Int J Cardiol. 34:267–271. 1992.
Fig. 1.
The method measuring a time interval from Q wave to end of the tricuspid regurgitation(Q-TR end)(A), from Q to pulmonary closure(Q-PC)(B).

Fig. 2.
The method measuring a tricuspid regurgitation gradient from the peak regurgitant flow velocity using a simplified Bernoulli equation.
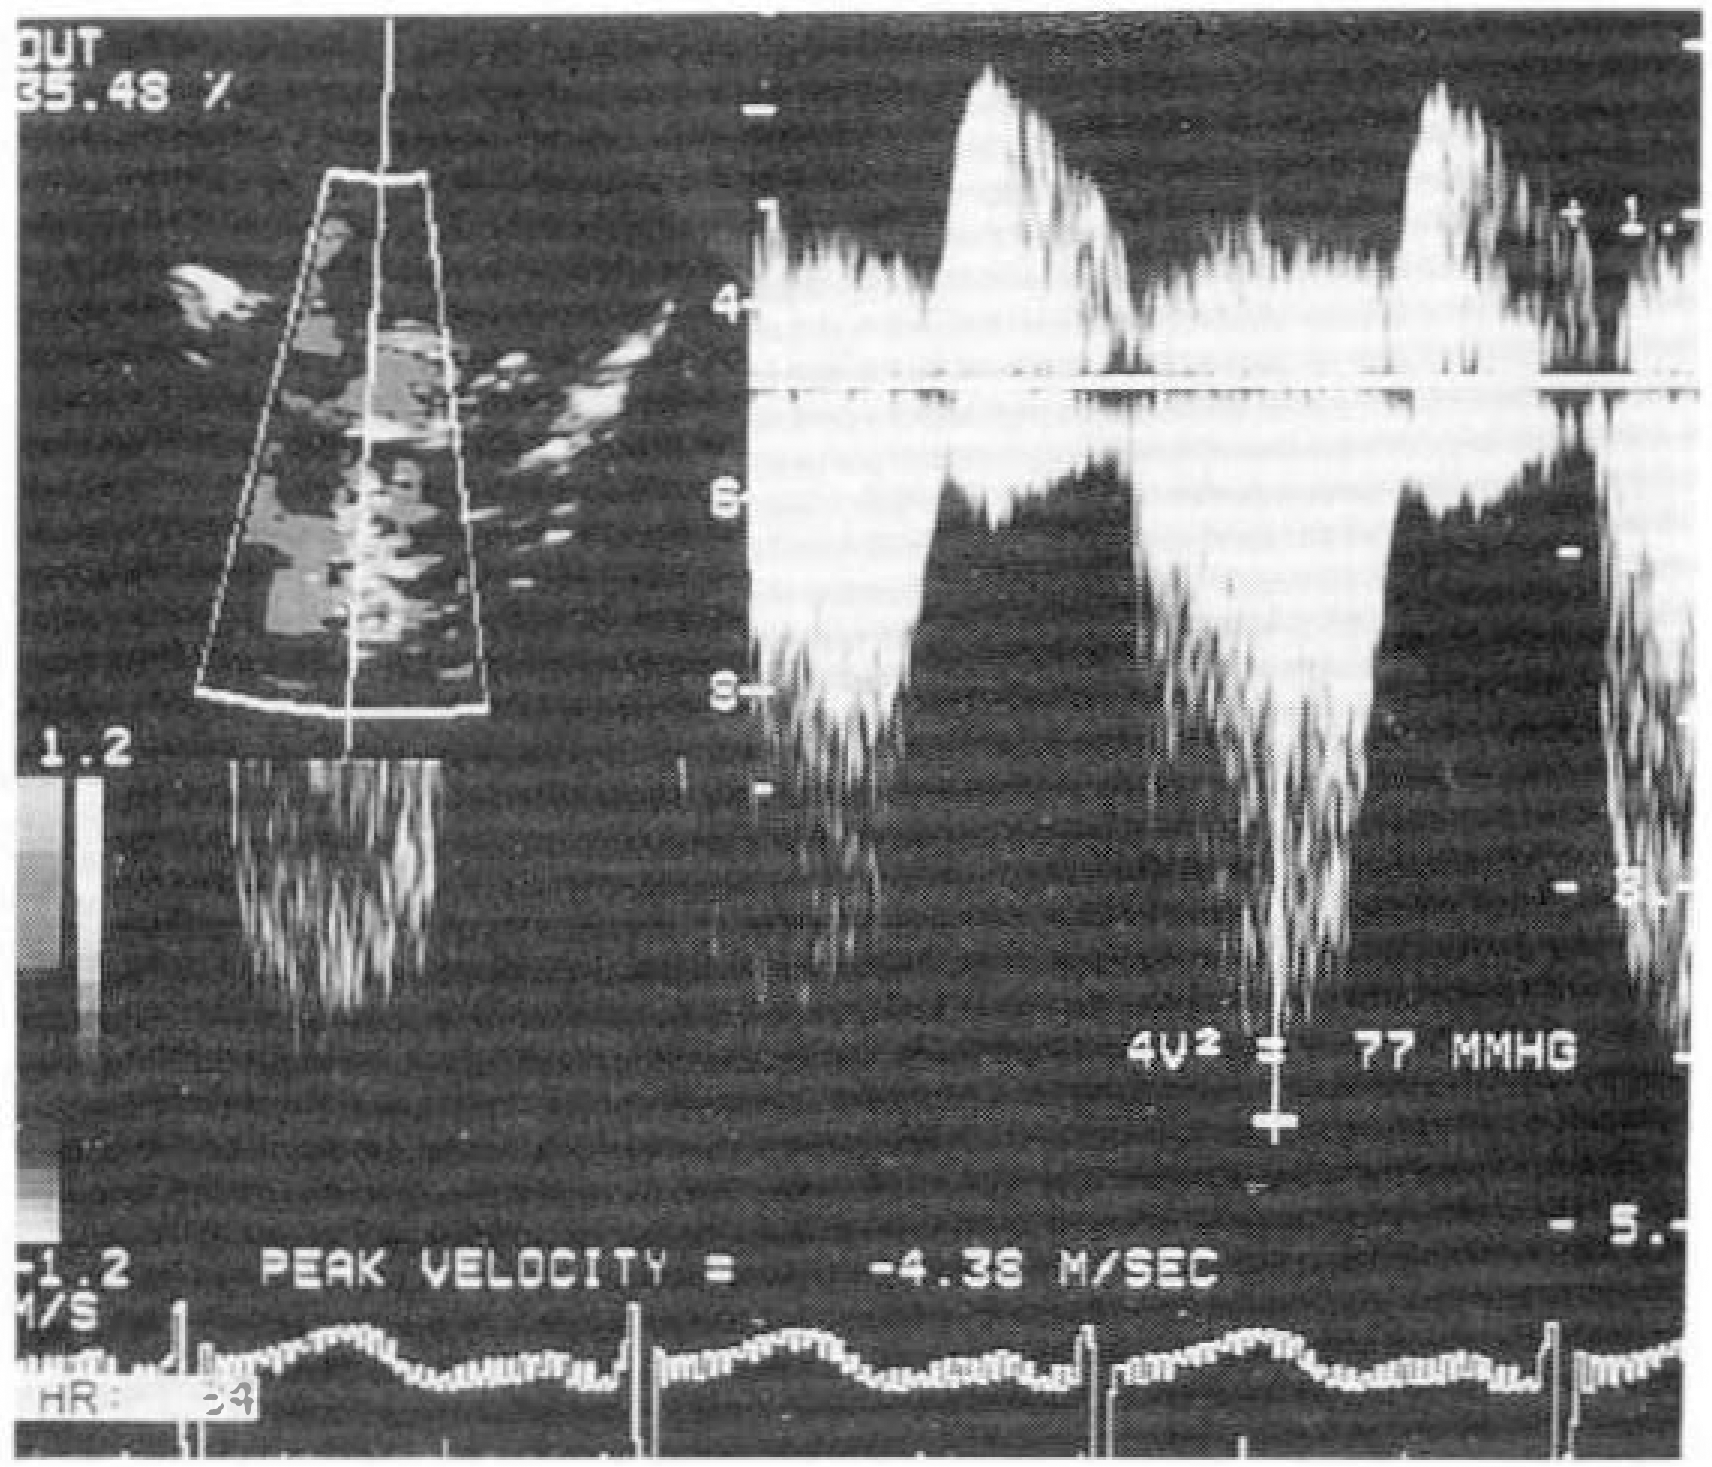
Fig. 3.
Relationship between peak right ventricular-right atrial pressure gradient and the time interval from pulmonary closure(PC) to the end of tricuspid regurgitation(TR end –PC), for the patients with pulmonary hypertension.
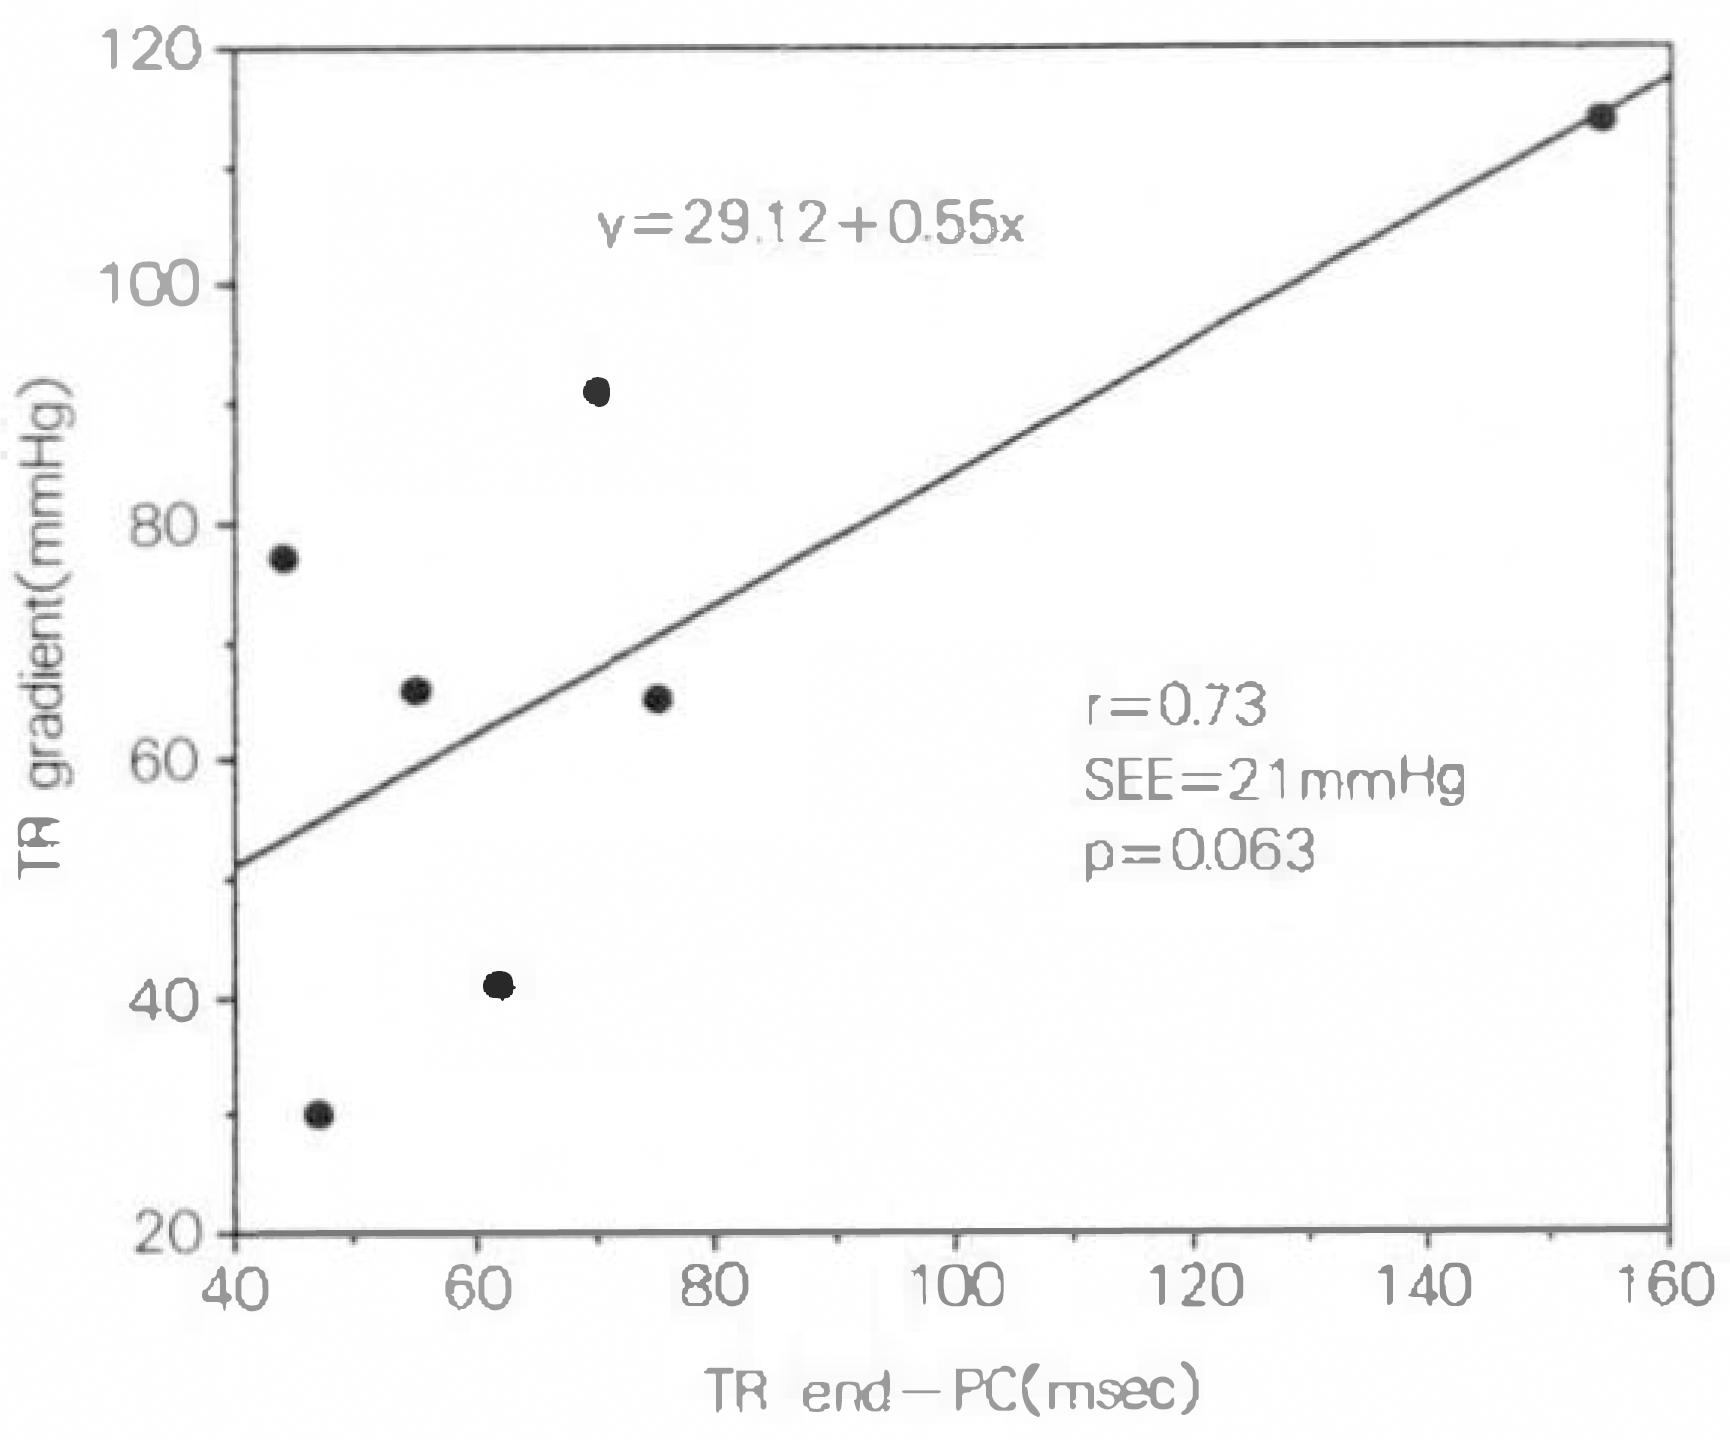
Table 1.
Doppler echocardiographic estimates in three groups with tricuspid regurgitation
| Groups | A[n=19] | B[n=7] | C[n=27] |
|---|---|---|---|
| age[yr] | 4.88 ± 4.45 | 5.33 ± 4.84 | 5.05 ± 3.98 |
| TR gradient(mmHg) | 19.63 ± 7.46 | 64.38 ± 32.46∗∗ | 23.5 ± 18.34∗ |
| Q-PC(msec) | 362 ± 42.64 | 369.14 ± 38.96 | 375.64 ± 40.06 |
| Q-TC(msec) | 398.79 ± 40.06 | 462.2 ± 15.22∗∗∗ | 404.19 ± 54.71∗∗ |
| TO-PC(msec) | 36.79 ± 30.90 | 87.4 ± 35.80∗ | 27.11 ± 33.40∗ |
| Q-TR end(msec) | 365.42 ± 52.99 | 441.57144.47∗∗ | 407.46 ± 78.87∗ |
| TR end–PC(msec) | 4.11 ± 29.17 | 72.43 ± 37.71∗∗ | 28.12 ± 42.39∗ |
 XML Download